this topic, and how techniques developed in one area can be applied in .... âThe exact notion of an anomaly is different for different application domains. For.
A modified version of this technical report will appear in ACM Computing Surveys, September 2009.
Anomaly Detection : A Survey VARUN CHANDOLA University of Minnesota ARINDAM BANERJEE University of Minnesota and VIPIN KUMAR University of Minnesota Anomaly detection is an important problem that has been researched within diverse research areas and application domains. Many anomaly detection techniques have been specifically developed for certain application domains, while others are more generic. This survey tries to provide a structured and comprehensive overview of the research on anomaly detection. We have grouped existing techniques into different categories based on the underlying approach adopted by each technique. For each category we have identified key assumptions, which are used by the techniques to differentiate between normal and anomalous behavior. When applying a given technique to a particular domain, these assumptions can be used as guidelines to assess the effectiveness of the technique in that domain. For each category, we provide a basic anomaly detection technique, and then show how the different existing techniques in that category are variants of the basic technique. This template provides an easier and succinct understanding of the techniques belonging to each category. Further, for each category, we identify the advantages and disadvantages of the techniques in that category. We also provide a discussion on the computational complexity of the techniques since it is an important issue in real application domains. We hope that this survey will provide a better understanding of the different directions in which research has been done on this topic, and how techniques developed in one area can be applied in domains for which they were not intended to begin with. Categories and Subject Descriptors: H.2.8 [Database Management]: Database Applications— Data Mining General Terms: Algorithms Additional Key Words and Phrases: Anomaly Detection, Outlier Detection
1. INTRODUCTION Anomaly detection refers to the problem of finding patterns in data that do not conform to expected behavior. These non-conforming patterns are often referred to as anomalies, outliers, discordant observations, exceptions, aberrations, surprises, peculiarities or contaminants in different application domains. Of these, anomalies and outliers are two terms used most commonly in the context of anomaly detection; sometimes interchangeably. Anomaly detection finds extensive use in a wide variety of applications such as fraud detection for credit cards, insurance or health care, intrusion detection for cyber-security, fault detection in safety critical systems, and military surveillance for enemy activities. The importance of anomaly detection is due to the fact that anomalies in data translate to significant (and often critical) actionable information in a wide variety of application domains. For example, an anomalous traffic pattern in a computer To Appear in ACM Computing Surveys, 09 2009, Pages 1–72.
2
·
Chandola, Banerjee and Kumar
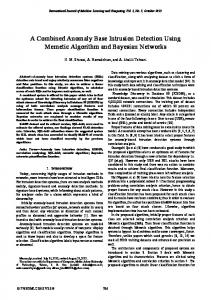
network could mean that a hacked computer is sending out sensitive data to an unauthorized destination [Kumar 2005]. An anomalous MRI image may indicate presence of malignant tumors [Spence et al. 2001]. Anomalies in credit card transaction data could indicate credit card or identity theft [Aleskerov et al. 1997] or anomalous readings from a space craft sensor could signify a fault in some component of the space craft [Fujimaki et al. 2005]. Detecting outliers or anomalies in data has been studied in the statistics community as early as the 19th century [Edgeworth 1887]. Over time, a variety of anomaly detection techniques have been developed in several research communities. Many of these techniques have been specifically developed for certain application domains, while others are more generic. This survey tries to provide a structured and comprehensive overview of the research on anomaly detection. We hope that it facilitates a better understanding of the different directions in which research has been done on this topic, and how techniques developed in one area can be applied in domains for which they were not intended to begin with. 1.1 What are anomalies? Anomalies are patterns in data that do not conform to a well defined notion of normal behavior. Figure 1 illustrates anomalies in a simple 2-dimensional data set. The data has two normal regions, N1 and N2 , since most observations lie in these two regions. Points that are sufficiently far away from the regions, e.g., points o1 and o2 , and points in region O3 , are anomalies. y o1
N1
o2 N2 O3
x Fig. 1.
A simple example of anomalies in a 2-dimensional data set.
Anomalies might be induced in the data for a variety of reasons, such as malicious activity, e.g., credit card fraud, cyber-intrusion, terrorist activity or breakdown of a system, but all of the reasons have a common characteristic that they are interesting to the analyst. The “interestingness” or real life relevance of anomalies is a key feature of anomaly detection. Anomaly detection is related to, but distinct from noise removal [Teng et al. 1990] and noise accommodation [Rousseeuw and Leroy 1987], both of which deal To Appear in ACM Computing Surveys, 09 2009.
Anomaly Detection : A Survey
·
3
with unwanted noise in the data. Noise can be defined as a phenomenon in data which is not of interest to the analyst, but acts as a hindrance to data analysis. Noise removal is driven by the need to remove the unwanted objects before any data analysis is performed on the data. Noise accommodation refers to immunizing a statistical model estimation against anomalous observations [Huber 1974]. Another topic related to anomaly detection is novelty detection [Markou and Singh 2003a; 2003b; Saunders and Gero 2000] which aims at detecting previously unobserved (emergent, novel) patterns in the data, e.g., a new topic of discussion in a news group. The distinction between novel patterns and anomalies is that the novel patterns are typically incorporated into the normal model after being detected. It should be noted that solutions for above mentioned related problems are often used for anomaly detection and vice-versa, and hence are discussed in this review as well. 1.2 Challenges At an abstract level, an anomaly is defined as a pattern that does not conform to expected normal behavior. A straightforward anomaly detection approach, therefore, is to define a region representing normal behavior and declare any observation in the data which does not belong to this normal region as an anomaly. But several factors make this apparently simple approach very challenging: —Defining a normal region which encompasses every possible normal behavior is very difficult. In addition, the boundary between normal and anomalous behavior is often not precise. Thus an anomalous observation which lies close to the boundary can actually be normal, and vice-versa. —When anomalies are the result of malicious actions, the malicious adversaries often adapt themselves to make the anomalous observations appear like normal, thereby making the task of defining normal behavior more difficult. —In many domains normal behavior keeps evolving and a current notion of normal behavior might not be sufficiently representative in the future. —The exact notion of an anomaly is different for different application domains. For example, in the medical domain a small deviation from normal (e.g., fluctuations in body temperature) might be an anomaly, while similar deviation in the stock market domain (e.g., fluctuations in the value of a stock) might be considered as normal. Thus applying a technique developed in one domain to another is not straightforward. —Availability of labeled data for training/validation of models used by anomaly detection techniques is usually a major issue. —Often the data contains noise which tends to be similar to the actual anomalies and hence is difficult to distinguish and remove. Due to the above challenges, the anomaly detection problem, in its most general form, is not easy to solve. In fact, most of the existing anomaly detection techniques solve a specific formulation of the problem. The formulation is induced by various factors such as nature of the data, availability of labeled data, type of anomalies to be detected, etc. Often, these factors are determined by the application domain in To Appear in ACM Computing Surveys, 09 2009.
4
·
Chandola, Banerjee and Kumar
which the anomalies need to be detected. Researchers have adopted concepts from diverse disciplines such as statistics, machine learning, data mining, information theory, spectral theory, and have applied them to specific problem formulations. Figure 2 shows the above mentioned key components associated with any anomaly detection technique. Research Areas Machine Learning Data Mining Statistics Information Theory Spectral Theory ...
Anomaly Detection Technique
Nature of Data
Labels
Anomaly Type
Output
Problem Characteristics
Application Domains Intrusion Detection Fraud Detection Fault/Damage Detection Medical Informatics ...
Fig. 2.
Key components associated with an anomaly detection technique.
1.3 Related Work Anomaly detection has been the topic of a number of surveys and review articles, as well as books. Hodge and Austin [2004] provide an extensive survey of anomaly detection techniques developed in machine learning and statistical domains. A broad review of anomaly detection techniques for numeric as well as symbolic data is presented by Agyemang et al. [2006]. An extensive review of novelty detection techniques using neural networks and statistical approaches has been presented in Markou and Singh [2003a] and Markou and Singh [2003b], respectively. Patcha and Park [2007] and Snyder [2001] present a survey of anomaly detection techniques To Appear in ACM Computing Surveys, 09 2009.
·
Anomaly Detection : A Survey
5
used specifically for cyber-intrusion detection. A substantial amount of research on outlier detection has been done in statistics and has been reviewed in several books [Rousseeuw and Leroy 1987; Barnett and Lewis 1994; Hawkins 1980] as well as other survey articles [Beckman and Cook 1983; Bakar et al. 2006]. Table I shows the set of techniques and application domains covered by our survey and the various related survey articles mentioned above.
Techniques
Applications
Classification Based Clustering Based Nearest Neighbor Based Statistical Information Theoretic Spectral Cyber-Intrusion Detection Fraud Detection Medical Anomaly Detection Industrial Damage Detection Image Processing Textual Anomaly Detection Sensor Networks
1 √ √ √ √ √ √ √ √ √ √ √ √ √
2 √ √ √ √
3 √ √ √ √
4 √
5
√
6 √ √ √ √
7
8
√
√ √
√
Table I. Comparison of our survey to other related survey articles.1 - Our survey 2 - Hodge and Austin [2004], 3 - Agyemang et al. [2006], 4 - Markou and Singh [2003a], 5 - Markou and Singh [2003b], 6 - Patcha and Park [2007], 7 - Beckman and Cook [1983], 8 - Bakar et al [2006]
1.4 Our Contributions This survey is an attempt to provide a structured and a broad overview of extensive research on anomaly detection techniques spanning multiple research areas and application domains. Most of the existing surveys on anomaly detection either focus on a particular application domain or on a single research area. [Agyemang et al. 2006] and [Hodge and Austin 2004] are two related works that group anomaly detection into multiple categories and discuss techniques under each category. This survey builds upon these two works by significantly expanding the discussion in several directions. We add two more categories of anomaly detection techniques, viz., information theoretic and spectral techniques, to the four categories discussed in [Agyemang et al. 2006] and [Hodge and Austin 2004]. For each of the six categories, we not only discuss the techniques, but also identify unique assumptions regarding the nature of anomalies made by the techniques in that category. These assumptions are critical for determining when the techniques in that category would be able to detect anomalies, and when they would fail. For each category, we provide a basic anomaly detection technique, and then show how the different existing techniques in that category are variants of the basic technique. This template provides an easier and succinct understanding of the techniques belonging to each category. Further, for each category we identify the advantages and disadvantages of the techniques in that category. We also provide a discussion on the computational complexity of the techniques since it is an important issue in real application domains. To Appear in ACM Computing Surveys, 09 2009.
6
·
Chandola, Banerjee and Kumar
While some of the existing surveys mention the different applications of anomaly detection, we provide a detailed discussion of the application domains where anomaly detection techniques have been used. For each domain we discuss the notion of an anomaly, the different aspects of the anomaly detection problem, and the challenges faced by the anomaly detection techniques. We also provide a list of techniques that have been applied in each application domain. The existing surveys discuss anomaly detection techniques that detect the simplest form of anomalies. We distinguish the simple anomalies from complex anomalies. The discussion of applications of anomaly detection reveals that for most application domains, the interesting anomalies are complex in nature, while most of the algorithmic research has focussed on simple anomalies. 1.5 Organization This survey is organized into three parts and its structure closely follows Figure 2. In Section 2 we identify the various aspects that determine the formulation of the problem and highlight the richness and complexity associated with anomaly detection. We distinguish simple anomalies from complex anomalies and define two types of complex anomalies, viz., contextual and collective anomalies. In Section 3 we briefly describe the different application domains where anomaly detection has been applied. In subsequent sections we provide a categorization of anomaly detection techniques based on the research area which they belong to. Majority of the techniques can be categorized into classification based (Section 4), nearest neighbor based (Section 5), clustering based (Section 6), and statistical techniques (Section 7). Some techniques belong to research areas such as information theory (Section 8), and spectral theory (Section 9). For each category of techniques we also discuss their computational complexity for training and testing phases. In Section 10 we discuss various contextual anomaly detection techniques. We discuss various collective anomaly detection techniques in Section 11. We present some discussion on the limitations and relative performance of various existing techniques in Section 12. Section 13 contains concluding remarks. 2. DIFFERENT ASPECTS OF AN ANOMALY DETECTION PROBLEM This section identifies and discusses the different aspects of anomaly detection. As mentioned earlier, a specific formulation of the problem is determined by several different factors such as the nature of the input data, the availability (or unavailability) of labels as well as the constraints and requirements induced by the application domain. This section brings forth the richness in the problem domain and justifies the need for the broad spectrum of anomaly detection techniques. 2.1 Nature of Input Data A key aspect of any anomaly detection technique is the nature of the input data. Input is generally a collection of data instances (also referred as object, record, point, vector, pattern, event, case, sample, observation, entity) [Tan et al. 2005, Chapter 2] . Each data instance can be described using a set of attributes (also referred to as variable, characteristic, feature, field, dimension). The attributes can be of different types such as binary, categorical or continuous. Each data instance might consist of only one attribute (univariate) or multiple attributes (multivariate). In To Appear in ACM Computing Surveys, 09 2009.
Anomaly Detection : A Survey
·
7
the case of multivariate data instances, all attributes might be of same type or might be a mixture of different data types. The nature of attributes determine the applicability of anomaly detection techniques. For example, for statistical techniques different statistical models have to be used for continuous and categorical data. Similarly, for nearest neighbor based techniques, the nature of attributes would determine the distance measure to be used. Often, instead of the actual data, the pairwise distance between instances might be provided in the form of a distance (or similarity) matrix. In such cases, techniques that require original data instances are not applicable, e.g., many statistical and classification based techniques. Input data can also be categorized based on the relationship present among data instances [Tan et al. 2005]. Most of the existing anomaly detection techniques deal with record data (or point data), in which no relationship is assumed among the data instances. In general, data instances can be related to each other. Some examples are sequence data, spatial data, and graph data. In sequence data, the data instances are linearly ordered, e.g., time-series data, genome sequences, protein sequences. In spatial data, each data instance is related to its neighboring instances, e.g., vehicular traffic data, ecological data. When the spatial data has a temporal (sequential) component it is referred to as spatio-temporal data, e.g., climate data. In graph data, data instances are represented as vertices in a graph and are connected to other vertices with edges. Later in this section we will discuss situations where such relationship among data instances become relevant for anomaly detection. 2.2 Type of Anomaly An important aspect of an anomaly detection technique is the nature of the desired anomaly. Anomalies can be classified into following three categories: 2.2.1 Point Anomalies. If an individual data instance can be considered as anomalous with respect to the rest of data, then the instance is termed as a point anomaly. This is the simplest type of anomaly and is the focus of majority of research on anomaly detection. For example, in Figure 1, points o1 and o2 as well as points in region O3 lie outside the boundary of the normal regions, and hence are point anomalies since they are different from normal data points. As a real life example, consider credit card fraud detection. Let the data set correspond to an individual’s credit card transactions. For the sake of simplicity, let us assume that the data is defined using only one feature: amount spent. A transaction for which the amount spent is very high compared to the normal range of expenditure for that person will be a point anomaly. 2.2.2 Contextual Anomalies. If a data instance is anomalous in a specific context (but not otherwise), then it is termed as a contextual anomaly (also referred to as conditional anomaly [Song et al. 2007]). The notion of a context is induced by the structure in the data set and has to be specified as a part of the problem formulation. Each data instance is defined using following two sets of attributes: To Appear in ACM Computing Surveys, 09 2009.
8
·
Chandola, Banerjee and Kumar
(1) Contextual attributes. The contextual attributes are used to determine the context (or neighborhood) for that instance. For example, in spatial data sets, the longitude and latitude of a location are the contextual attributes. In timeseries data, time is a contextual attribute which determines the position of an instance on the entire sequence. (2) Behavioral attributes. The behavioral attributes define the non-contextual characteristics of an instance. For example, in a spatial data set describing the average rainfall of the entire world, the amount of rainfall at any location is a behavioral attribute. The anomalous behavior is determined using the values for the behavioral attributes within a specific context. A data instance might be a contextual anomaly in a given context, but an identical data instance (in terms of behavioral attributes) could be considered normal in a different context. This property is key in identifying contextual and behavioral attributes for a contextual anomaly detection technique.
Monthly Temp
t2
t1 Mar
Jun
Sept
Dec
Mar
Jun
Sept
Dec
Mar
Jun
Sept
Dec
Time Fig. 3. Contextual anomaly t2 in a temperature time series. Note that the temperature at time t1 is same as that at time t2 but occurs in a different context and hence is not considered as an anomaly.
Contextual anomalies have been most commonly explored in time-series data [Weigend et al. 1995; Salvador and Chan 2003] and spatial data [Kou et al. 2006; Shekhar et al. 2001]. Figure 3 shows one such example for a temperature time series which shows the monthly temperature of an area over last few years. A temperature of 35F might be normal during the winter (at time t1 ) at that place, but the same value during summer (at time t2 ) would be an anomaly. A similar example can be found in the credit card fraud detection domain. A contextual attribute in credit card domain can be the time of purchase. Suppose an individual usually has a weekly shopping bill of $100 except during the Christmas week, when it reaches $1000. A new purchase of $1000 in a week in July will be considered a contextual anomaly, since it does not conform to the normal behavior of the individual in the context of time (even though the same amount spent during Christmas week will be considered normal). The choice of applying a contextual anomaly detection technique is determined by the meaningfulness of the contextual anomalies in the target application domain. To Appear in ACM Computing Surveys, 09 2009.
Anomaly Detection : A Survey
·
9
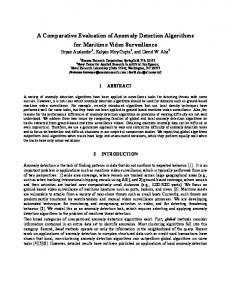
Another key factor is the availability of contextual attributes. In several cases defining a context is straightforward, and hence applying a contextual anomaly detection technique makes sense. In other cases, defining a context is not easy, making it difficult to apply such techniques. 2.2.3 Collective Anomalies. If a collection of related data instances is anomalous with respect to the entire data set, it is termed as a collective anomaly. The individual data instances in a collective anomaly may not be anomalies by themselves, but their occurrence together as a collection is anomalous. Figure 4 illustrates an example which shows a human electrocardiogram output [Goldberger et al. 2000]. The highlighted region denotes an anomaly because the same low value exists for an abnormally long time (corresponding to an Atrial Premature Contraction). Note that that low value by itself is not an anomaly.
−4
−4.5
−5
−5.5
−6
−6.5
−7
−7.5
0
500
1000
1500
2000
2500
3000
Fig. 4. Collective anomaly corresponding to an Atrial Premature Contraction in an human electrocardiogram output.
As an another illustrative example, consider a sequence of actions occurring in a computer as shown below: . . . http-web, buffer-overflow, http-web, http-web, smtp-mail, ftp, http-web, ssh, smtpmail, http-web, ssh, buffer-overflow, ftp, http-web, ftp, smtp-mail,http-web . . .
The highlighted sequence of events (buffer-overflow, ssh, ftp) correspond to a typical web based attack by a remote machine followed by copying of data from the host computer to remote destination via ftp. It should be noted that this collection of events is an anomaly but the individual events are not anomalies when they occur in other locations in the sequence. Collective anomalies have been explored for sequence data [Forrest et al. 1999; Sun et al. 2006], graph data [Noble and Cook 2003], and spatial data [Shekhar et al. 2001]. To Appear in ACM Computing Surveys, 09 2009.
10
·
Chandola, Banerjee and Kumar
It should be noted that while point anomalies can occur in any data set, collective anomalies can occur only in data sets in which data instances are related. In contrast, occurrence of contextual anomalies depends on the availability of context attributes in the data. A point anomaly or a collective anomaly can also be a contextual anomaly if analyzed with respect to a context. Thus a point anomaly detection problem or collective anomaly detection problem can be transformed to a contextual anomaly detection problem by incorporating the context information. 2.3 Data Labels The labels associated with a data instance denote if that instance is normal or anomalous1 . It should be noted that obtaining labeled data which is accurate as well as representative of all types of behaviors, is often prohibitively expensive. Labeling is often done manually by a human expert and hence requires substantial effort to obtain the labeled training data set. Typically, getting a labeled set of anomalous data instances which cover all possible type of anomalous behavior is more difficult than getting labels for normal behavior. Moreover, the anomalous behavior is often dynamic in nature, e.g., new types of anomalies might arise, for which there is no labeled training data. In certain cases, such as air traffic safety, anomalous instances would translate to catastrophic events, and hence will be very rare. Based on the extent to which the labels are available, anomaly detection techniques can operate in one of the following three modes: 2.3.1 Supervised anomaly detection. Techniques trained in supervised mode assume the availability of a training data set which has labeled instances for normal as well as anomaly class. Typical approach in such cases is to build a predictive model for normal vs. anomaly classes. Any unseen data instance is compared against the model to determine which class it belongs to. There are two major issues that arise in supervised anomaly detection. First, the anomalous instances are far fewer compared to the normal instances in the training data. Issues that arise due to imbalanced class distributions have been addressed in the data mining and machine learning literature [Joshi et al. 2001; 2002; Chawla et al. 2004; Phua et al. 2004; Weiss and Hirsh 1998; Vilalta and Ma 2002]. Second, obtaining accurate and representative labels, especially for the anomaly class is usually challenging. A number of techniques have been proposed that inject artificial anomalies in a normal data set to obtain a labeled training data set [Theiler and Cai 2003; Abe et al. 2006; Steinwart et al. 2005]. Other than these two issues, the supervised anomaly detection problem is similar to building predictive models. Hence we will not address this category of techniques in this survey. 2.3.2 Semi-Supervised anomaly detection. Techniques that operate in a semisupervised mode, assume that the training data has labeled instances for only the normal class. Since they do not require labels for the anomaly class, they are more widely applicable than supervised techniques. For example, in space craft fault detection [Fujimaki et al. 2005], an anomaly scenario would signify an accident, which is not easy to model. The typical approach used in such techniques is to 1 Also
referred to as normal and anomalous classes.
To Appear in ACM Computing Surveys, 09 2009.
Anomaly Detection : A Survey
·
11
build a model for the class corresponding to normal behavior, and use the model to identify anomalies in the test data. A limited set of anomaly detection techniques exist that assume availability of only the anomaly instances for training [Dasgupta and Nino 2000; Dasgupta and Majumdar 2002; Forrest et al. 1996]. Such techniques are not commonly used, primarily because it is difficult to obtain a training data set which covers every possible anomalous behavior that can occur in the data. 2.3.3 Unsupervised anomaly detection. Techniques that operate in unsupervised mode do not require training data, and thus are most widely applicable. The techniques in this category make the implicit assumption that normal instances are far more frequent than anomalies in the test data. If this assumption is not true then such techniques suffer from high false alarm rate. Many semi-supervised techniques can be adapted to operate in an unsupervised mode by using a sample of the unlabeled data set as training data. Such adaptation assumes that the test data contains very few anomalies and the model learnt during training is robust to these few anomalies. 2.4 Output of Anomaly Detection An important aspect for any anomaly detection technique is the manner in which the anomalies are reported. Typically, the outputs produced by anomaly detection techniques are one of the following two types: 2.4.1 Scores. Scoring techniques assign an anomaly score to each instance in the test data depending on the degree to which that instance is considered an anomaly. Thus the output of such techniques is a ranked list of anomalies. An analyst may choose to either analyze top few anomalies or use a cut-off threshold to select the anomalies. 2.4.2 Labels. Techniques in this category assign a label (normal or anomalous) to each test instance. Scoring based anomaly detection techniques allow the analyst to use a domainspecific threshold to select the most relevant anomalies. Techniques that provide binary labels to the test instances do not directly allow the analysts to make such a choice, though this can be controlled indirectly through parameter choices within each technique. 3. APPLICATIONS OF ANOMALY DETECTION In this section we discuss several applications of anomaly detection. For each application domain we discuss the following four aspects: —The notion of anomaly. —Nature of the data. —Challenges associated with detecting anomalies. —Existing anomaly detection techniques. To Appear in ACM Computing Surveys, 09 2009.
12
·
Chandola, Banerjee and Kumar
3.1 Intrusion Detection Intrusion detection refers to detection of malicious activity (break-ins, penetrations, and other forms of computer abuse) in a computer related system [Phoha 2002]. These malicious activities or intrusions are interesting from a computer security perspective. An intrusion is different from the normal behavior of the system, and hence anomaly detection techniques are applicable in intrusion detection domain. The key challenge for anomaly detection in this domain is the huge volume of data. The anomaly detection techniques need to be computationally efficient to handle these large sized inputs. Moreover the data typically comes in a streaming fashion, thereby requiring on-line analysis. Another issue which arises because of the large sized input is the false alarm rate. Since the data amounts to millions of data objects, a few percent of false alarms can make analysis overwhelming for an analyst. Labeled data corresponding to normal behavior is usually available, while labels for intrusions are not. Thus, semi-supervised and unsupervised anomaly detection techniques are preferred in this domain. Denning [1987] classifies intrusion detection systems into host based and network based intrusion detection systems. 3.1.1 Host Based Intrusion Detection Systems. Such systems (also referred to as system call intrusion detection systems) deal with operating system call traces. The intrusions are in the form of anomalous subsequences (collective anomalies) of the traces. The anomalous subsequences translate to malicious programs, unauthorized behavior and policy violations. While all traces contain events belonging to the same alphabet, it is the co-occurrence of events which is the key factor in differentiating between normal and anomalous behavior. The data is sequential in nature and the alphabet consists of individual system calls as shown in Figure 5. These calls could be generated by programs [Hofmeyr et al. 1998] or by users [Lane and Brodley 1999]. The alphabet is usually large (183 system calls for SunOS 4.1x Operating System). Different programs execute these system calls in different sequences. The length of the sequence for each program varies. Figure 5 illustrates a sample set of operating system call sequences. A key characteristic of the data in this domain is that the data can be typically profiled at different levels such as program level or user level. Anomaly detection techniques open, open, open, Fig. 5.
read, mmap, close,
mmap, mmap, open,
mmap, read, close,
open, open, open,
read, close mmap,
mmap ... close
... ...
A sample data set comprising of three operating system call traces.
applied for host based intrusion detection are required to to handle the sequential nature of data. Moreover, point anomaly detection techniques are not applicable in this domain. The techniques have to either model the sequence data or compute similarity between sequences. A survey of different techniques used for this problem is presented by Snyder [2001]. A comparative evaluation of anomaly detection for host based intrusion detection presented in Forrest et al. [1996] and Dasgupta and To Appear in ACM Computing Surveys, 09 2009.
Anomaly Detection : A Survey Technique Used Statistical Profiling using Histograms
Section Section 7.2.1
Mixture of Models Neural Networks Support Vector Machines Rule-based Systems
Section 7.1.3 Section 4.1 Section 4.3
Table II.
Section 4.4
·
13
References Forrest et al [1996; 2004; 1996; 1994; 1999],Hofmeyr et al. [1998] Kosoresow and Hofmeyr [1997] Jagadish et al. [1999] Cabrera et al. [2001] Gonzalez and Dasgupta [2003] Dasgupta et al [2000; 2002] Ghosh et al [1999a; 1998; 1999b] Debar et al. [1998] Eskin et al. [2001] Marceau [2000] Endler [1998] Lane et al [1999; 1997b; 1997a] Eskin [2000] Ghosh et al. [1998] Hu et al. [2003] Heller et al. [2003] Lee et al[1997; 1998; 2000]
Examples of anomaly detection techniques used for host based intrusion detection.
Nino [2000]. Some anomaly detection techniques used in this domain are shown in Table II. 3.1.2 Network Intrusion Detection Systems. These systems deal with detecting intrusions in network data. The intrusions typically occur as anomalous patterns (point anomalies) though certain techniques model the data in a sequential fashion and detect anomalous subsequences (collective anomalies) [Gwadera et al. 2005b; 2004]. The primary reason for these anomalies is due to the attacks launched by outside hackers who want to gain unauthorized access to the network for information theft or to disrupt the network. A typical setting is a large network of computers which is connected to the rest of the world via the Internet. The data available for intrusion detection systems can be at different levels of granularity, e.g., packet level traces, CISCO net-flows data, etc. The data has a temporal aspect associated with it but most of the techniques typically do not handle the sequential aspect explicitly. The data is high dimensional typically with a mix of categorical as well as continuous attributes. A challenge faced by anomaly detection techniques in this domain is that the nature of anomalies keeps changing over time as the intruders adapt their network attacks to evade the existing intrusion detection solutions. Some anomaly detection techniques used in this domain are shown in Table III. 3.2 Fraud Detection Fraud detection refers to detection of criminal activities occurring in commercial organizations such as banks, credit card companies, insurance agencies, cell phone companies, stock market, etc. The malicious users might be the actual customers of the organization or might be posing as a customer (also known as identity theft). The fraud occurs when these users consume the resources provided by the organization in an unauthorized way. The organizations are interested in immediate detection of such frauds to prevent economic losses. Fawcett and Provost [1999] introduce the term activity monitoring as a general approach to fraud detection in these domains. The typical approach of anomaly To Appear in ACM Computing Surveys, 09 2009.
14
·
Chandola, Banerjee and Kumar
Technique Used Statistical Profiling using Histograms
Section Section 7.2.1
Parametric Statistical Modeling Non-parametric Statistical Modeling Bayesian Networks
Section 7.1 Section 7.2.2 Section 4.2
Neural Networks
Section 4.1
Support Vector Machines Rule-based Systems
Section 4.3 Section 4.4
Clustering Based
Section 6
Nearest based Spectral
Section 5
Neighbor
Section 9
Information retic Table III.
Theo-
Section 8
Chow and Yeung [2002] Siaterlis and Maglaris [2004], Sebyala et al. [2002], Valdes and Skinner [2000], Bronstein et al. [2001] HIDE [Zhang et al. 2001], NSOM [Labib and Vemuri 2002], Smith et al. [2002], Hawkins et al. [2002], Kruegel et al. [2003], Manikopoulos and Papavassiliou [2002], Ramadas et al. [2003] Eskin et al. [2002] ADAM [Barbara et al. 2001a; Barbara et al. 2003; Barbara et al. 2001b], Fan et al. [2001], Helmer et al. [1998], Qin and Hwang [2004], Salvador and Chan [2003], Otey et al. [2003] ADMIT [Sequeira and Zaki 2002], Eskin et al. [2002], Wu and Zhang [2003], Otey et al. [2003] MINDS [Ertoz et al. 2004; Chandola et al. 2006], Eskin et al. [2002] Shyu et al. [2003], Lakhina et al. [2005], Thottan and Ji [2003],Sun et al. [2007] Lee and Xiang [2001],Noble and Cook [2003]
Examples of anomaly detection techniques used for network intrusion detection.
Technique Used Neural Networks
Section Section 4.1
Rule-based Systems Clustering
Section 4.4 Section 6
Table IV.
References NIDES [Anderson et al. 1994; Anderson et al. 1995; Javitz and Valdes 1991], EMERALD [Porras and Neumann 1997], Yamanishi et al [2001; 2004], Ho et al. [1999], Kruegel at al [2002; 2003], Mahoney et al [2002; 2003; 2003; 2007], Sargor [1998] Gwadera et al [2005b; 2004], Ye and Chen [2001]
References CARDWATCH [Aleskerov et al. 1997], Ghosh and Reilly [1994],Brause et al. [1999],Dorronsoro et al. [1997] Brause et al. [1999] Bolton and Hand [1999]
Examples of anomaly detection techniques used for credit card fraud detection.
detection techniques is to maintain a usage profile for each customer and monitor the profiles to detect any deviations. Some of the specific applications of fraud detection are discussed below. 3.2.1 Credit Card Fraud Detection. In this domain, anomaly detection techniques are applied to detect fraudulent credit card applications or fraudulent credit card usage (associated with credit card thefts). Detecting fraudulent credit card applications is similar to detecting insurance fraud [Ghosh and Reilly 1994]. To Appear in ACM Computing Surveys, 09 2009.
Anomaly Detection : A Survey Technique Used Statistical Profiling using Histograms Parametric Statistical Modeling Neural Networks Rule-based Systems Table V.
Section Section 7.2.1
·
15
References Fawcett and Provost [1999],Cox et al. [1997]
Section 7.1
Agarwal [2005],Scott [2001]
Section 4.1 Section 4.4
Barson et al. [1996],Taniguchi et al. [1998] Phua et al. [2004],Taniguchi et al. [1998]
Examples of anomaly detection techniques used for mobile phone fraud detection.
The data typically comprises of records defined over several dimensions such as the user ID, amount spent, time between consecutive card usage, etc. The frauds are typically reflected in transactional records (point anomalies) and correspond to high payments, purchase of items never purchased by the user before, high rate of purchase, etc. The credit companies have complete data available and also have labeled records. Moreover, the data falls into distinct profiles based on the credit card user. Hence profiling and clustering based techniques are typically used in this domain. The challenge associated with detecting unauthorized credit card usage is that it requires online detection of fraud as soon as the fraudulent transaction takes place. Anomaly detection techniques have been applied in two different ways to address this problem. The first one is known as by-owner in which each credit card user is profiled based on his/her credit card usage history. Any new transaction is compared to the user’s profile and flagged as an anomaly if it does not match the profile. This approach is typically expensive since it requires querying a central data repository, every time a user makes a transaction. Another approach known as by-operation detects anomalies from among transactions taking place at a specific geographic location. Both by-user and by-operation techniques detect contextual anomalies. In the first case the context is a user, while in the second case the context is the geographic location. Some anomaly detection techniques used in this domain are listed in Table IV. 3.2.2 Mobile Phone Fraud Detection. Mobile/cellular fraud detection is a typical activity monitoring problem. The task is to scan a large set of accounts, examining the calling behavior of each, and to issue an alarm when an account appears to have been misused. Calling activity may be represented in various ways, but is usually described with call records. Each call record is a vector of features, both continuous (e.g., CALL-DURATION) and discrete (e.g., CALLING-CITY). However, there is no inherent primitive representation in this domain. Calls can be aggregated by time, for example into call-hours or call-days or user or area depending on the granularity desired. The anomalies correspond to high volume of calls or calls made to unlikely destinations. Some techniques applied to cell phone fraud detection are listed in Table V. 3.2.3 Insurance Claim Fraud Detection. An important problem in the propertycasualty insurance industry is claims fraud, e.g. automobile insurance fraud. Individuals and conspiratorial rings of claimants and providers manipulate the claim To Appear in ACM Computing Surveys, 09 2009.
16
·
Chandola, Banerjee and Kumar
processing system for unauthorized and illegal claims. Detection of such fraud has been very important for the associated companies to avoid financial losses. The available data in this domain are the documents submitted by the claimants. The techniques extract different features (both categorical as well as continuous) from these documents. Typically, claim adjusters and investigators assess these claims for frauds. These manually investigated cases are used as labeled instances by supervised and semi-supervised techniques for insurance fraud detection. Insurance claim fraud detection is quite often handled as a generic activity monitoring problem [Fawcett and Provost 1999]. Neural network based techniques have also been applied to identify anomalous insurance claims [He et al. 2003; Brockett et al. 1998]. 3.2.4 Insider Trading Detection. Another recent application of anomaly detection techniques has been in early detection of Insider Trading. Insider trading is a phenomenon found in stock markets, where people make illegal profits by acting on (or leaking) inside information before the information is made public. The inside information can be of different forms [Donoho 2004]. It could refer to the knowledge of a pending merger/acquisition, a terrorist attack affecting a particular industry, a pending legislation affecting a particular industry or any information which would affect the stock prices in a particular industry. Insider trading can be detected by identifying anomalous trading activities in the market. The available data is from several heterogenous sources such as option trading data, stock trading data, news. The data has temporal associations since the data is collected continuously. The temporal and streaming nature has also been exploited in certain techniques [Aggarwal 2005]. Anomaly detection techniques in this domain are required to detect fraud in an online manner and as early as possible, to prevent people/organizations from making illegal profits. Some anomaly detection techniques used in this domain are listed in Table VI. Technique Used Statistical Profiling using Histograms Information Theoretic
Section Section 7.2.1 Section 8
References Donoho [2004],Aggarwal [2005] Arning et al. [1996]
Table VI. Examples of different anomaly detection techniques used for insider trading detection.
3.3 Medical and Public Health Anomaly Detection Anomaly detection in the medical and public health domains typically work with patient records. The data can have anomalies due to several reasons such as abnormal patient condition or instrumentation errors or recording errors. Several techniques have also focussed on detecting disease outbreaks in a specific area [Wong et al. 2003]. Thus the anomaly detection is a very critical problem in this domain and requires high degree of accuracy. The data typically consists of records which may have several different types of features such as patient age, blood group, weight. The data might also have To Appear in ACM Computing Surveys, 09 2009.
Anomaly Detection : A Survey Technique Used Parametric Statistical Modeling Neural Networks Bayesian Networks Rule-based Systems Nearest Neighbor based Techniques
Section Section 7.1 Section 4.1 Section 4.2 Section 4.4 Section 5
·
17
References Horn et al. [2001],Laurikkala et al. [2000],Solberg and Lahti [2005],Roberts [2002],Suzuki et al. [2003] Campbell and Bennett [2001] Wong et al. [2003] Aggarwal [2005] Lin et al. [2005]
Table VII. Examples of different anomaly detection techniques used in medical and public health domain.
temporal as well as spatial aspect to it. Most of the current anomaly detection techniques in this domain aim at detecting anomalous records (point anomalies). Typically the labeled data belongs to the healthy patients, hence most of the techniques adopt semi-supervised approach. Another form of data handled by anomaly detection techniques in this domain is time series data, such as Electrocardiograms (ECG) (Figure 4) and Electroencephalograms (EEG). Collective anomaly detection techniques have been applied to detect anomalies in such data [Lin et al. 2005]. The most challenging aspect of the anomaly detection problem in this domain is that the cost of classifying an anomaly as normal can be very high. Some anomaly detection techniques used in this domain are listed in Table VII. 3.4 Industrial Damage Detection Industrial units suffer damage due to continuous usage and the normal wear and tear. Such damages need to be detected early to prevent further escalation and losses. The data in this domain is usually referred to as sensor data because it is recorded using different sensors and collected for analysis. Anomaly detection techniques have been extensively applied in this domain to detect such damages. Industrial damage detection can be further classified into two domains, one which deals with defects in mechanical components such as motors, engines, etc., and the other which deals with defects in physical structures. The former domain is also referred to as system health management. 3.4.1 Fault Detection in Mechanical Units. The anomaly detection techniques in this domain monitor the performance of industrial components such as motors, turbines, oil flow in pipelines or other mechanical components and detect defects which might occur due to wear and tear or other unforseen circumstances. The data in this domain has typically a temporal aspect and time-series analysis is also used in some techniques [Keogh et al. 2002; Keogh et al. 2006; Basu and Meckesheimer 2007]. The anomalies occur mostly because of an observation in a specific context (contextual anomalies) or as an anomalous sequence of observations (collective anomalies). Typically, normal data (pertaining to components without defects) is readily available and hence semi-supervised techniques are applicable. Anomalies are required to be detected in an online fashion as preventive measures are required to be taken as soon as an anomaly occurs. Some anomaly detection techniques used in this domain are listed in Table VIII. To Appear in ACM Computing Surveys, 09 2009.
18
·
Chandola, Banerjee and Kumar
Technique Used Parametric Statistical Modeling Non-parametric Statistical Modeling Neural Networks
Spectral Rule Based Systems
Section Section 7.1 Section 7.2.2 Section 4.1
Section 9 Section 4.4
References Guttormsson et al. [1999], Keogh et al [1997; 2002; 2006] Desforges et al. [1998] Bishop [1994], Campbell and Bennett [2001], Diaz and Hollmen [2002], Harris [1993], Jakubek and Strasser [2002], King et al. [2002], Li et al. [2002], Petsche et al. [1996], Streifel et al. [1996], Whitehead and Hoyt [1993] Parra et al. [1996],Fujimaki et al. [2005] Yairi et al. [2001]
Table VIII. Examples of anomaly detection techniques used for fault detection in mechanical units.
Technique Used Statistical Profiling using Histograms Parametric Statistical Modeling Mixture of Models Neural Networks
Table IX.
Section Section 7.2.1 Section 7.1 Section 7.1.3 Section 4.1
References Manson [2002],Manson et al. [2001],Manson et al. [2000] Ruotolo and Surace [1997] Hickinbotham et al [2000a; 2000b],Hollier and Austin [2002] Brotherton et al [1998; 2001], Nairac et al [1999; 1997], Surace et al [1998; 1997], Sohn et al. [2001], Worden [1997]
Examples of anomaly detection techniques used for structural damage detection.
3.4.2 Structural Defect Detection. Structural defect and damage detection techniques detect structural anomalies in structures, e.g., cracks in beams, strains in airframes. The data collected in this domain has a temporal aspect. The anomaly detection techniques are similar to novelty detection or change point detection techniques since they try to detect change in the data collected from a structure. The normal data and hence the models learnt are typically static over time. The data might have spatial correlations. Some anomaly detection techniques used in this domain are listed in Table IX. 3.5 Image Processing Anomaly detection techniques dealing with images are either interested in any changes in an image over time (motion detection) or in regions which appear abnormal on the static image. This domain includes satellite imagery [Augusteijn and Folkert 2002; Byers and Raftery 1998; Moya et al. 1993; Torr and Murray 1993; Theiler and Cai 2003], digit recognition [Cun et al. 1990], spectroscopy [Chen et al. 2005; Davy and Godsill 2002; Hazel 2000; Scarth et al. 1995], mammographic image analysis [Spence et al. 2001; Tarassenko 1995], and video surveillance [Diehl and Hampshire 2002; Singh and Markou 2004; Pokrajac et al. 2007]. The anomalies are caused by motion or insertion of foreign object or instrumentation errors. The data has spatial as well as temporal characteristics. Each data point has a few continuTo Appear in ACM Computing Surveys, 09 2009.
Anomaly Detection : A Survey Technique Used Mixture of Models
Section Section 7.1.3
Regression Bayesian Networks Support Vector Machines Neural Networks
Section 7.1.2 Section 4.2 Section 4.3
Clustering Nearest Neighbor based Techniques
Section 6 Section 5
Table X.
Section 4.1
·
19
References Byers and Raftery [1998],Spence et [2001],Tarassenko [1995] Chen et al. [2005], Torr and Murray [1993] Diehl and Hampshire [2002] Davy and Godsill [2002],Song et al. [2002]
al.
Augusteijn and Folkert [2002],Cun et al. [1990],Hazel [2000],Moya et al. [1993],Singh and Markou [2004] Scarth et al. [1995] Pokrajac et al. [2007],Byers and Raftery [1998]
Examples of anomaly detection techniques used in image processing domain.
Technique Used Mixture of Models Statistical Profiling using Histograms Support Vector Machines Neural Networks Clustering Based
Section Section 7.1.3 Section 7.2.1
References Baker et al. [1999] Fawcett and Provost [1999]
Section 4.3
Manevitz and Yousef [2002]
Section 4.1 Section 6
Manevitz and Yousef [2000] Allan et al. [1998],Srivastava and Zane-Ulman [2005],Srivastava [2006]
Table XI. Examples of anomaly detection techniques used for anomalous topic detection in text data.
ous attributes such as color, lightness, texture, etc. The interesting anomalies are either anomalous points or regions in the images (point and contextual anomalies). One of the key challenges in this domain is the large size of the input. When dealing with video data, online anomaly detection techniques are required. Some anomaly detection techniques used in this domain are listed in Table X. 3.6 Anomaly Detection in Text Data Anomaly detection techniques in this domain primarily detect novel topics or events or news stories in a collection of documents or news articles. The anomalies are caused due to a new interesting event or an anomalous topic. The data in this domain is typically high dimensional and very sparse. The data also has a temporal aspect since the documents are collected over time. A challenge for anomaly detection techniques in this domain is to handle the large variations in documents belonging to one category or topic. Some anomaly detection techniques used in this domain are listed in Table XI. 3.7 Sensor Networks Sensor networks have lately become an important topic of research; more from the data analysis perspective, since the sensor data collected from various wireless sensors has several unique characteristics. Anomalies in data collected from a sensor To Appear in ACM Computing Surveys, 09 2009.
20
·
Chandola, Banerjee and Kumar
Technique Used Bayesian Networks Rule-based Systems Parametric Statistical Modeling Nearest Neighbor based Techniques Spectral
Section Section 4.2 Section 4.4 Section 7.1 Section 5 Section 9
References Janakiram et al. [2006] Branch et al. [2006] Phuong et al. [2006], Du et al. [2006] Subramaniam et al. [2006], Kejia Zhang and Li [2007], Id´e et al. [2007] Chatzigiannakis et al. [2006]
Table XII. Examples of anomaly detection techniques used for anomaly detection in sensor networks.
network can either mean that one or more sensors are faulty, or they are detecting events (such as intrusions) that are interesting for analysts. Thus anomaly detection in sensor networks can capture sensor fault detection or intrusion detection or both. A single sensor network might comprise of sensors that collect different types of data, such as binary, discrete, continuous, audio, video, etc. The data is generated in a streaming mode. Often times the environment in which the various sensors are deployed, as well as the communication channel, induces noise and missing values in the collected data. Anomaly detection in sensor networks poses a set of unique challenges. The anomaly detection techniques are required to operate in an online approach. Due to severe resource constraints, the anomaly detection techniques need to be lightweight. Another challenge is that data is collected in a distributed fashion, and hence a distributed data mining approach is required to analyze the data [Chatzigiannakis et al. 2006]. Moreover, the presence of noise in the data collected from the sensor makes anomaly detection more challenging, since it has to now distinguish between interesting anomalies and unwanted noise/missing values. Table XII lists some anomaly detection techniques used in this domain. 3.8 Other Domains Anomaly detection has also been applied to several other domains such as speech recognition [Albrecht et al. 2000; Emamian et al. 2000], novelty detection in robot behavior [Crook and Hayes 2001; Crook et al. 2002; Marsland et al. 1999; 2000b; 2000a], traffic monitoring [Shekhar et al. 2001], click through protection [Ihler et al. 2006], detecting faults in web applications [Ide and Kashima 2004; Sun et al. 2005], detecting anomalies in biological data [Kadota et al. 2003; Sun et al. 2006; Gwadera et al. 2005a; MacDonald and Ghosh 2007; Tomlins et al. 2005; Tibshirani and Hastie 2007], detecting anomalies in census data [Lu et al. 2003], detecting associations among criminal activities [Lin and Brown 2003], detecting anomalies in Customer Relationship Management (CRM) data [He et al. 2004b], detecting anomalies in astronomical data [Dutta et al. 2007; Escalante 2005; Protopapas et al. 2006] and detecting ecosystem disturbances [Blender et al. 1997; Kou et al. 2006; Sun and Chawla 2004]. 4. CLASSIFICATION BASED ANOMALY DETECTION TECHNIQUES Classification [Tan et al. 2005; Duda et al. 2000] is used to learn a model (classifier) from a set of labeled data instances (training) and then, classify a test instance into To Appear in ACM Computing Surveys, 09 2009.
Anomaly Detection : A Survey
·
21
one of the classes using the learnt model (testing). Classification based anomaly detection techniques operate in a similar two-phase fashion. The training phase learns a classifier using the available labeled training data. The testing phase classifies a test instance as normal or anomalous using the classifier. Classification based anomaly detection techniques operate under the following general assumption: Assumption: A classifier that can distinguish between normal and anomalous classes can be learnt in the given feature space. Based on the labels available for training phase, classification based anomaly detection techniques can be grouped into two broad categories: multi-class and one-class anomaly detection techniques. Multi-class classification based anomaly detection techniques assume that the training data contains labeled instances belonging to multiple normal classes [Stefano et al. 2000; Barbara et al. 2001b]. Such anomaly detection techniques learn a classifier to distinguish between each normal class against the rest of the classes. See Figure 6(a) for illustration. A test instance is considered anomalous if its not classified as normal by any of the classifiers. Some techniques in this sub-category associate a confidence score with the prediction made by the classifier. If none of the classifiers are confident in classifying the test instance as normal, the instance is declared to be anomalous. One-class classification based anomaly detection techniques assume that all training instances have only one class label. Such techniques learn a discriminative boundary around the normal instances using a one-class classification algorithm, e.g., one-class SVMs [Sch¨olkopf et al. 2001], one-class Kernel Fisher Discriminants [Roth 2004; 2006], as shown in Figure 6(b). Any test instance that does not fall within the learnt boundary is declared as anomalous. Normal Class 1
One-class Classifier Normal Instances Multi-class Classifier Anomalies
Anomalies
Normal Class 3 Normal Class 2
(a) Multi-class Anomaly Detection Fig. 6.
(b) One-class Anomaly Detection
Using classification for anomaly detection.
In the following subsections, we discuss a variety of anomaly detection techniques that use different classification algorithms to build classifiers: 4.1 Neural Networks Based Neural networks have been applied to anomaly detection in multi-class as well as one-class setting. To Appear in ACM Computing Surveys, 09 2009.
22
·
Chandola, Banerjee and Kumar Neural Network Used Multi Layered Perceptrons
Neural Trees Auto-associative Networks
Adaptive Resonance Theory Based Radial Basis Function Based
Hopfield Networks Oscillatory Networks
References [Augusteijn and Folkert 2002; Cun et al. 1990; Sykacek 1997; Ghosh et al. 1999a; Ghosh et al. 1998; Barson et al. 1996; He et al. 1997; Nairac et al. 1997; Hickinbotham and Austin 2000b; Vasconcelos et al. 1995; 1994] [Martinez 1998] [Aeyels 1991; Byungho and Sungzoon 1999; Japkowicz et al. 1995; Hawkins et al. 2002; Ko and Jacyna 2000; Manevitz and Yousef 2000; Petsche et al. 1996; Sohn et al. 2001; Song et al. 2001; Streifel et al. 1996; Thompson et al. 2002; Worden 1997; Williams et al. 2002; Diaz and Hollmen 2002] [Moya et al. 1993; Dasgupta and Nino 2000; Caudell and Newman 1993] [Albrecht et al. 2000; Bishop 1994; Brotherton et al. 1998; Brotherton and Johnson 2001; Li et al. 2002; Nairac et al. 1999; Nairac et al. 1997; Ghosh and Reilly 1994; Jakubek and Strasser 2002] [Jagota 1991; Crook and Hayes 2001; Crook et al. 2002; Addison et al. 1999; Murray 2001] [Ho and Rouat 1997; 1998; Kojima and Ito 1999; Borisyuk et al. 2000; Martinelli and Perfetti 1994]
Table XIII. Some examples of classification based anomaly detection techniques using neural networks.
A basic multi-class anomaly detection technique using neural networks operates in two steps. First, a neural network is trained on the normal training data to learn the different normal classes. Second, each test instance is provided as an input to the neural network. If the network accepts the test input, it is normal and if the network rejects a test input, it is an anomaly [Stefano et al. 2000; Odin and Addison 2000]. Several variants of the basic neural network technique have been proposed that use different types of neural networks, as summarized in Table XIII. Replicator Neural Networks have been used for one-class anomaly detection[Hawkins et al. 2002; Williams et al. 2002]. A multi-layer feed forward neural network is constructed that has the same number of input and output neurons (corresponding to the features in the data). The training involves compressing data into three hidden layers. The testing phase involves reconstructing each data instance xi using the learnt network to obtain the reconstructed output oi . The reconstruction error δi for the test instance xi is then computed as: n
δi =
1X (xij − oij )2 n j=1
where n is the number of features over which the data is defined. The reconstruction error δi is directly used as an anomaly score for the test instance. 4.2 Bayesian Networks Based Bayesian networks has been used for anomaly detection in the multi-class setting. A basic technique for a univariate categorical data set using a na¨ıve Bayesian network estimates the posterior probability of observing a class label (from a set To Appear in ACM Computing Surveys, 09 2009.
Anomaly Detection : A Survey
·
23
of normal class labels and the anomaly class label), given a test data instance. The class label with largest posterior is chosen as the predicted class for the given test instance. The likelihood of observing the test instance given a class, and the prior on the class probabilities, are estimated from the training data set. The zero probabilities, especially for the anomaly class, are smoothed using Laplace Smoothing. The basic technique can be generalized to multivariate categorical data set by aggregating the per-attribute posterior probabilities for each test instance and using the aggregated value to assign a class label to the test instance. Several variants of the basic technique has been proposed for network intrusion detection [Barbara et al. 2001b; Sebyala et al. 2002; Valdes and Skinner 2000; Mingming 2000; Bronstein et al. 2001], for novelty detection in video surveillance [Diehl and Hampshire 2002], for anomaly detection in text data [Baker et al. 1999], and for disease outbreak detection [Wong et al. 2002; 2003]. The basic technique described above assumes independence between the different attributes. Several variations of the basic technique have been proposed that capture the conditional dependencies between the different attributes using more complex Bayesian networks [Siaterlis and Maglaris 2004; Janakiram et al. 2006; Das and Schneider 2007]. 4.3 Support Vector Machines Based Support Vector Machines (SVMs) [Vapnik 1995] have been applied to anomaly detection in the one-class setting. Such techniques use one class learning techniques for SVM [Ratsch et al. 2002] and learn a region that contains the training data instances (a boundary). Kernels, such as radial basis function (RBF) kernel, can be used to learn complex regions. For each test instance, the basic technique determines if the test instance falls within the learnt region. If a test instance falls within the learnt region, it is declared as normal, else it is declared as anomalous. Variants of the basic technique have been proposed for anomaly detection in audio signal data [Davy and Godsill 2002], novelty detection in power generation plants [King et al. 2002] and system call intrusion detection [Eskin et al. 2002; Heller et al. 2003; Lazarevic et al. 2003]. The basic technique also been extended to detect anomalies in temporal sequences [Ma and Perkins 2003a; 2003b]. A variant of the basic technique [Tax and Duin 1999a; 1999b; Tax 2001] finds the smallest hyper-sphere in the kernel space, which contains all training instances, and then determines which side of that hyper-sphere does a test instance lie. If a test instance lies outside the hyper-sphere, it is declared to be anomalous. Song et al. [2002] use Robust Support Vector Machines (RSVM) which are robust to the presence of anomalies in the training data. RSVM have been applied to system call intrusion detection [Hu et al. 2003]. 4.4 Rule Based Rule based anomaly detection techniques learn rules that capture the normal behavior of a system. A test instance that is not covered by any such rule is considered as an anomaly. Rule based techniques have been applied in multi-class as well as one-class setting. A basic multi-class rule based technique consists of two steps. First step is to To Appear in ACM Computing Surveys, 09 2009.
24
·
Chandola, Banerjee and Kumar
learn rules from the training data using a rule learning algorithm, such as RIPPER, Decision Trees, etc. Each rule has an associated confidence value which is proportional to ratio between the number of training instances correctly classified by the rule and the total number of training instances covered by the rule. Second step is to find, for each test instance, the rule that best captures the test instance. The inverse of the confidence associated with the best rule is the anomaly score of the test instance. Several minor variants of the basic rule based technique have been proposed [Fan et al. 2001; Helmer et al. 1998; Lee et al. 1997; Salvador and Chan 2003; Teng et al. 1990]. Association rule mining [Agrawal and Srikant 1995] has been used for one-class anomaly detection by generating rules from the data in an unsupervised fashion. Association rules are generated from a categorical data set. To ensure that the rules correspond to strong patterns, a support threshold is used to prune out rules with low support [Tan et al. 2005]. Association rule mining based techniques have been used for network intrusion detection [Mahoney and Chan 2002; 2003; Mahoney et al. 2003; Tandon and Chan 2007; Barbara et al. 2001a; Otey et al. 2003], system call intrusion detection [Lee et al. 2000; Lee and Stolfo 1998; Qin and Hwang 2004], credit card fraud detection [Brause et al. 1999], and fraud detection in spacecraft house keeping data [Yairi et al. 2001]. Frequent itemsets are generated in the intermediate step of association rule mining algorithms. He et al. [2004a] propose an anomaly detection algorithm for categorical data sets in which the anomaly score of a test instance is equal to the number of frequent itemsets it occurs in. Computational Complexity The computational complexity of classification based techniques depends on the classification algorithm being used. For a discussion on the complexity of training classifiers, see Kearns [1990]. Generally, training decision trees tends to be faster while techniques that involve quadratic optimization, such as SVMs, are more expensive, though linear time SVMs [Joachims 2006] have been proposed that have linear training time. The testing phase of classification techniques is usually very fast since the testing phase uses a learnt model for classification. Advantages and Disadvantages of Classification Based Techniques The advantages of classification based techniques are as follows: (1) Classification based techniques, especially the multi-class techniques, can make use of powerful algorithms that can distinguish between instances belonging to different classes. (2) The testing phase of classification based techniques is fast since each test instance needs to be compared against the pre-computed model. The disadvantages of classification based techniques are as follows: (1) Multi-class classification based techniques rely on availability of accurate labels for various normal classes, which is often not possible. (2) Classification based techniques assign a label to each test instance, which can also become a disadvantage when a meaningful anomaly score is desired for the test instances. Some classification techniques that obtain a probabilistic To Appear in ACM Computing Surveys, 09 2009.
Anomaly Detection : A Survey
·
25
prediction score from the output of a classifier, can be used to address this issue [Platt 2000]. 5. NEAREST NEIGHBOR BASED ANOMALY DETECTION TECHNIQUES The concept of nearest neighbor analysis has been used in several anomaly detection techniques. Such techniques are based on the following key assumption: Assumption: Normal data instances occur in dense neighborhoods, while anomalies occur far from their closest neighbors. Nearest neighbor based anomaly detection techniques require a distance or similarity measure defined between two data instances. Distance (or similarity) between two data instances can be computed in different ways. For continuous attributes, Euclidean distance is a popular choice but other measures can be used [Tan et al. 2005, Chapter 2]. For categorical attributes, simple matching coefficient is often used but more complex distance measures can be used [Boriah et al. 2008; Chandola et al. 2008]. For multivariate data instances, distance or similarity is usually computed for each attribute and then combined [Tan et al. 2005, Chapter 2]. Most of the techniques that will be discussed in this section, as well as the clustering based techniques (Section 6) do not require the distance measure to be strictly metric. The measures are typically required to be positive-definite and symmetric, but they are not required to satisfy the triangle inequality. Nearest neighbor based anomaly detection techniques can be broadly grouped into two categories: (1) Techniques that use the distance of a data instance to its k th nearest neighbor as the anomaly score. (2) Techniques that compute the relative density of each data instance to compute its anomaly score. Additionally there are some techniques that use the distance between data instances in a different manner to detect anomalies and will be briefly discussed later. 5.1 Using Distance to k th Nearest Neighbor A basic nearest neighbor anomaly detection technique is based on the following definition – The anomaly score of a data instance is defined as its distance to its k th nearest neighbor in a given data set. This basic technique has been applied to detect land mines from satellite ground images [Byers and Raftery 1998] and to detect shorted turns (anomalies) in the DC field windings of large synchronous turbine-generators [Guttormsson et al. 1999]. In the latter paper the authors use k = 1. Usually, a threshold is then be applied on the anomaly score to determine if a test instance is anomalous or not. Ramaswamy et al. [2000], on the other hand, select n instances with the largest anomaly scores as the anomalies. The basic technique has been extended by researchers in three different ways. The first set of variants modify the above definition to obtain the anomaly score of a data instance. The second set of variants use different distance/similarity measures to handle different data types. The third set of variants focus on improving the efficiency of the basic technique (the complexity of the basic technique is O(N 2 ), where N is the data size) in different ways. To Appear in ACM Computing Surveys, 09 2009.
26
·
Chandola, Banerjee and Kumar
Eskin et al. [2002], Angiulli and Pizzuti [2002] and Zhang and Wang [2006] compute the anomaly score of a data instance as the sum of its distances from its k nearest neighbors. A similar technique has been applied to detect credit card frauds by [Bolton and Hand 1999] called Peer Group Analysis. A different way to compute the anomaly score of a data instance is to count the number of nearest neighbors (n) that are not more than d distance apart from the given data instance [Knorr and Ng 1997; 1998; 1999; Knorr et al. 2000]. This method can also be viewed as estimating the global density for each data instance since it involves counting the number of neighbors in a hyper-sphere of radius d. n For example, in a 2-D data set, the density of a data instance = πd 2 . The inverse of the density is the anomaly score for the data instance. Instead of computing the actual density, several techniques fix the radius d and use n1 as the anomaly score, while several techniques fix n and use d1 as the anomaly score. While most techniques discussed in this category so far have been proposed to handle continuous attributes, several variants have been proposed to handle other data types. A hyper-graph based technique is proposed by [Wei et al. 2003] called HOT where the authors model the categorical values using a hyper-graph, and measure distance between two data instances by analyzing the connectivity of the graph. A distance measure for data containing a mix of categorical and continuous attributes has been proposed for anomaly detection [Otey et al. 2006]. The authors define links between two instances by adding distance for categorical and continuous attributes separately. For categorical attributes, the number of attributes for which the two instances have same values defines the distance between them. For continuous attributes, a covariance matrix is maintained to capture the dependencies between the continuous values. Palshikar [2005] adapts the technique proposed in [Knorr and Ng 1999] to continuous sequences. Kou et al. [2006] extend the technique proposed in [Ramaswamy et al. 2000] to spatial data. Several variants of the basic technique have been proposed to improve the efficiency. Some techniques prune the search space by either ignoring instances that cannot be anomalous or by focussing on instances that are most likely to be anomalous. Bay and Schwabacher [2003] show that for a sufficiently randomized data, a simple pruning step could result in the average complexity of the nearest neighbor search to be nearly linear. After calculating the nearest neighbors for a data instance, the algorithm sets the anomaly threshold for any data instance to the score of the weakest anomaly found so far. Using this pruning procedure, the technique discards instances that are close, and hence not interesting. Ramaswamy et al. [2000] propose a partition based technique, which first clusters the instances and computes lower and upper bounds on distance of a instance from its k th nearest neighbor for instances in each partition. This information is then used to identify the partitions that cannot possibly contain the top k anomalies; such partitions are pruned. Anomalies are then computed from the remaining instances (belonging to unpruned partitions) in a final phase. Similar cluster based pruning has been proposed by Eskin et al. [2002],McCallum et al. [2000], Ghoting et al. [2006], and Tao et al. [2006]. Wu and Jermaine [2006] use sampling to improve the efficiency of the nearest neighbor based technique. The authors compute the nearest neighbor of every To Appear in ACM Computing Surveys, 09 2009.
Anomaly Detection : A Survey
·
27
instance within a smaller sample from the data set. Thus the complexity of the proposed technique is reduced to O(M N ) where M is the sample size chosen. To prune the search space for nearest neighbors, several techniques partition the attribute space into a hyper-grid consisting of hypercubes of fixed sizes. The intuition behind such techniques is that if a hypercube contains many instances, such instances are likely to be normal. Moreover, if for a given instance, the hypercube that contains the instance and its adjoining hypercubes contain very few instances, the given instance is likely to be anomalous. Techniques based on this intuition have been proposed by Knorr and Ng [1998]. Angiulli and Pizzuti [2002] extend by linearizing the search space through the Hilbert space filling curve. The d-dimensional data set is fitted in a hypercube D = [0, 1]d . This hypercube is then mapped to the interval I = [0, 1] using the Hilbert Space Filling Curve and the k-nearest neighbors of a data instance are obtained by examining its successors and predecessors in I. 5.2 Using Relative Density Density based anomaly detection techniques estimate the density of the neighborhood of each data instance. An instance that lies in a neighborhood with low density is declared to be anomalous while an instance that lies in a dense neighborhood is declared to be normal. For a given data instance, the distance to its k th nearest neighbor is equivalent to the radius of a hyper-sphere, centered at the given data instance, which contains k other instances. Thus the distance to the k th nearest neighbor for a given data instance can be viewed as an estimate of the inverse of the density of the instance in the data set and the basic nearest neighbor based technique described in the previous subsection can be considered as a density based anomaly detection technique. Density based techniques perform poorly if the data has regions of varying densities. For example, consider a 2 dimensional data set shown in Figure 7. Due to the low density of the cluster C1 it is apparent that for every instance q inside the cluster C1 , the distance between the instance q and its nearest neighbor is greater than the distance between the instance p2 and the nearest neighbor from the cluster C2 , and the instance p2 will not be considered as anomaly. Hence, the basic technique will fail to distinguish between p2 and instances in C1 . However, the instance p1 may be detected. To handle the issue of varying densities in the data set, a set of techniques have been proposed to compute density of instances relative to the density of their neighbors. Breunig et al [1999; 2000] assign an anomaly score to a given data instance, known as Local Outlier Factor (LOF). For any given data instance, the LOF score is equal to ratio of average local density of the k nearest neighbors of the instance and the local density of the data instance itself. To find the local density for a data instance, the authors first find the radius of the smallest hyper-sphere centered at the data instance, that contains its k nearest neighbors. The local density is then computed by dividing k by the volume of this hyper-sphere. For a normal instance lying in a dense region, its local density will be similar to that of its neighbors, while for an anomalous instance, its local density will be lower than that of its nearest To Appear in ACM Computing Surveys, 09 2009.
28
·
Chandola, Banerjee and Kumar
C1
LOF Neighborhood C2
COF Neighborhood p2
p1
n1 o1
Fig. 7. Advantage of local density based techniques over global density based techniques.
Fig. 8. Difference between the neighborhoods computed by LOF and COF.
neighbors. Hence the anomalous instance will get a higher LOF score. In the example shown in Figure 7, LOF will be able to capture both anomalies (p1 and p2 ) due to the fact that it considers the density around the data instances. Several researchers have proposed variants of LOF technique. Some of these variants estimate the local density of an instance in a different way. Some variants have adapted the original technique to more complex data types. Since the original LOF technique is O(N 2 ) (N is the data size), several techniques have been proposed that improve the efficiency of LOF. Tang et al. [2002] discuss a variation of the LOF, which they call Connectivitybased Outlier Factor (COF). The difference between LOF and COF is the manner in which the k neighborhood for an instance is computed. In COF, the neighborhood for an instance is computed in an incremental mode. To start, the closest instance to the given instance is added to the neighborhood set. The next instance added to the neighborhood set is such that its distance to the existing neighborhood set is minimum among all remaining data instances. The distance between an instance and a set of instances is defined as the minimum distance between the given instance and any instance belonging to the given set. The neighborhood is grown in this manner until it reaches size k. Once the neighborhood is computed, the anomaly score (COF) is computed in the same manner as LOF. COF is able to capture regions such as straight lines, as shown in Figure 8. A simpler version of LOF was proposed by Hautamaki et al. [2004] which calculates a quantity called Outlier Detection using In-degree Number (ODIN) for each data instance. For a given data instance, ODIN is equal to the number of k nearest neighbors of the data instance which have the given data instance in their k nearest neighbor list. The inverse of ODIN is the anomaly score for the data instance. A similar technique was proposed by Brito et al. [1997]. Papadimitriou et al. [2002] propose a measure called Multi-granularity Deviation Factor (MDEF) which is a variation of LOF. MDEF for a given data instance is equal to the standard deviation of the local densities of the nearest neighbors of the given data instance (including the data instance itself). The inverse of the standard deviation is the anomaly score for the data instance. The anomaly detection technique presented in the paper is called LOCI, which not only finds anomalous instances but also anomalous micro-clusters. To Appear in ACM Computing Surveys, 09 2009.
Anomaly Detection : A Survey
·
29
Several variants of LOF have been proposed to handle different data types. A variant of LOF is applied for detecting spatial anomalies in climate data by Sun and Chawla [2004; 2006]. Yu et al. [2006] use a similarity measure instead of distance to handle categorical attributes. Similar technique has been proposed to detect sequential anomalies in protein sequences by Sun et al. [2006]. This technique uses Probabilistic Suffix Trees (PST) to find the nearest neighbors for a given sequence. Pokrajac et al. [2007] extend LOF to work in an incremental fashion to detect anomalies in video sensor data. Some variants of the LOF technique have been proposed to improve its efficiency. Jin et al. [2001] propose a variant, in which only the top n anomalies are found instead of finding LOF score for every data instance. The technique includes finding micro-clusters in the data and then finding upper and lower bound on LOF for each of the micro-clusters. Chiu and chee Fu [2003] proposed three variants of LOF which enhance its performance by making certain assumptions about the problem to prune all those clusters which definitely do not contain instances which will figure in the top n “anomaly list”. For the remaining clusters a detailed analysis is done to find the LOF score for each instance in these clusters. Computational Complexity A drawback of the basic nearest neighbor based technique and the LOF technique, is the O(N 2 ) complexity required. Since these techniques involve finding nearest neighbors for each instance efficient data structures such as k-d trees [Bentley 1975] and R-trees [Roussopoulos et al. 1995] can be used. But such techniques do not scale well as the number of attributes increases. Several techniques have directly optimized the anomaly detection technique under the assumption that only top few anomalies are interesting. If an anomaly score is required for every test instance, such techniques are not applicable. Techniques that partition the attribute space into a hyper-grid, are linear in data size but are exponential in the number of attributes, and hence are not well suited for large number of attributes. Sampling techniques try to address the O(N 2 ) complexity issue by determining the nearest neighbors within a small sample of the data set. But sampling might result in incorrect anomaly scores if the size of the sample is very small. Advantages and Disadvantages of Nearest Neighbor Based Techniques The advantages of nearest neighbor based techniques are as follows: (1) A key advantage of nearest neighbor based techniques is that they are unsupervised in nature and do not make any assumptions regarding the generative distribution for the data. Instead, they are purely data driven. (2) Semi-supervised techniques perform better than unsupervised techniques in terms of missed anomalies, since the likelihood of an anomaly to form a close neighborhood in the training data set is very low. (3) Adapting nearest neighbor based techniques to a different data type is straightforward, and primarily requires defining an appropriate distance measure for the given data. The disadvantages of nearest neighbor based techniques are as follows: (1) For unsupervised techniques, if the data has normal instances that do not To Appear in ACM Computing Surveys, 09 2009.
30
·
Chandola, Banerjee and Kumar
have enough close neighbors or if the data has anomalies that have enough close neighbors, the technique fails to label them correctly, resulting in missed anomalies. (2) For semi-supervised techniques, if the normal instances in test data do not have enough similar normal instances in the training data, the false positive rate for such techniques is high. (3) The computational complexity of the testing phase is also a significant challenge since it involves computing the distance of each test instance with all instances belonging to either the test data itself, or to the training data, to compute the nearest neighbors. (4) Performance of a nearest neighbor based technique greatly relies on a distance measure, defined between a pair of data instances, that can effectively distinguish between normal and anomalous instances. Defining distance measures between instances can be challenging when the data is complex, e.g. graphs, sequences, etc. 6. CLUSTERING BASED ANOMALY DETECTION TECHNIQUES Clustering [Jain and Dubes 1988; Tan et al. 2005] is used to group similar data instances into clusters. Clustering is primarily an unsupervised technique though semi-supervised clustering [Basu et al. 2004] has also been explored lately. Even though clustering and anomaly detection appear to be fundamentally different from each other, several clustering based anomaly detection techniques have been developed. Clustering based anomaly detection techniques can be grouped into three categories. First category of clustering based techniques rely on the following assumption: Assumption: Normal data instances belong to a cluster in the data, while anomalies either do not belong to any cluster. Techniques based on the above assumption apply a known clustering based algorithm to the data set and declare any data instance that does not belong to any cluster as anomalous. Several clustering algorithms that do not force every data instance to belong to a cluster, such as DBSCAN [Ester et al. 1996], ROCK [Guha et al. 2000], and SNN clustering [Ert¨oz et al. 2003] can be used. The FindOut algorithm [Yu et al. 2002] is an extension of the WaveCluster algorithm [Sheikholeslami et al. 1998] in which the detected clusters are removed from the data and the residual instances are declared as anomalies. A disadvantage of such techniques is that they are not optimized to find anomalies, since the main aim of the underlying clustering algorithm is to find clusters. Second category of clustering based techniques rely on the following assumption: Assumption: Normal data instances lie close to their closest cluster centroid, while anomalies are far away from their closest cluster centroid. Techniques based on the above assumption consist of two steps. In the first step, the data is clustered using a clustering algorithm. In the second step, for each data instance, its distance to its closest cluster centroid is calculated as its anomaly score. To Appear in ACM Computing Surveys, 09 2009.
Anomaly Detection : A Survey
·
31
A number of anomaly detection techniques that follow this two step approach have been proposed using different clustering algorithms. Smith et al. [2002] studied Self-Organizing Maps (SOM), K-means Clustering, and Expectation Maximization (EM) to cluster training data and then use the clusters to classify test data. In particular, SOM [Kohonen 1997] has been widely used to detect anomalies in a semi-supervised mode in several applications such as intrusion detection [Labib and Vemuri 2002; Smith et al. 2002; Ramadas et al. 2003], fault detection [Harris 1993; Ypma and Duin 1998; Emamian et al. 2000], and fraud detection [Brockett et al. 1998]. Barbara et al. [2003] propose a technique is robust to anomalies in the training data. The authors first separate normal instances from anomalies in the training data, using frequent item-set mining, and then use the clustering based technique to detect anomalies. Several techniques have also been proposed to handle sequence data [Blender et al. 1997; Bejerano and Yona 2001; Vinueza and Grudic 2004; Budalakoti et al. 2006]. Techniques based on the second assumption can also operate in semi-supervised mode, in which the training data is clustered and instances belonging to the test data are compared against the clusters to obtain an anomaly score for the test data instance [Marchette 1999; Wu and Zhang 2003; Vinueza and Grudic 2004; Allan et al. 1998]. If the training data has instances belonging to multiple classes, semi-supervised clustering can be applied to improve the clusters. He et al. [2002] incorporate the knowledge of labels to improve on their unsupervised clustering based anomaly detection technique [He et al. 2003] by calculating a measure called semantic anomaly factor which is high if the class label of an object in a cluster is different from the majority of the class labels in that cluster. Note that if the anomalies in the data form clusters by themselves, the above discussed techniques will not be able to detect such anomalies. To address this issue a third category of clustering based techniques have been proposed that rely on the following assumption: Assumption: Normal data instances belong to large and dense clusters, while anomalies either belong to small or sparse clusters. Techniques based on the above assumption declare instances belonging to clusters whose size and/or density is below a threshold as anomalous. Several variations of the third category of techniques have been proposed [Pires and Santos-Pereira 2005; Otey et al. 2003; Eskin et al. 2002; Mahoney et al. 2003; Jiang et al. 2001; He et al. 2003]. The technique proposed by [He et al. 2003], called FindCBLOF, assigns an anomaly score known as Cluster-Based Local Outlier Factor (CBLOF) for each data instance. The CBLOF score captures the size of the cluster to which the data instance belongs, as well as the distance of the data instance to its cluster centroid. Several clustering based techniques have been proposed to improve the efficiency of the existing techniques discussed above. Fixed width clustering is a linear time (O(N d)) approximation algorithm used by various anomaly detection techniques [Eskin et al. 2002; Portnoy et al. 2001; Mahoney et al. 2003; He et al. 2003]. An instance is assigned to a cluster whose center is within a pre-specified distance to the given instance. If no such cluster exists then a new cluster with the instance as the To Appear in ACM Computing Surveys, 09 2009.
32
·
Chandola, Banerjee and Kumar
center is created. Then they determine which clusters are anomalies based on their density and distance from other clusters. The width can either be a user-specified parameter [Eskin et al. 2002; Portnoy et al. 2001] or can be derived from the data [Mahoney et al. 2003]. Chaudhary et al. [2002] propose an anomaly detection technique using k-d trees which provide a partitioning of the data in linear time. They apply their technique to detect anomalies in astronomical data sets where computational efficiency is an important requirement. Another technique which addresses this issue is proposed by Sun et al. [2004]. The authors propose an indexing technique called CD-trees to efficiently partition data into clusters. The data instances which belong to sparse clusters are declared as anomalies. 6.1 Distinction between Clustering Based and Nearest Neighbor Based Techniques Several clustering based techniques require distance computation between a pair of instances. Thus, in that respect, they are similar to nearest neighbor based techniques. The choice of the distance measure is critical to the performance of the technique; hence the discussion in the previous section regarding the distance measures hold for clustering based techniques also. The key difference between the two techniques, however, is that clustering based techniques evaluate each instance with respect to the cluster it belongs to, while nearest neighbor based techniques analyze each instance with respect to its local neighborhood. Computational Complexity The computational complexity of training a clustering based anomaly detection technique depends on the clustering algorithm used to generate clusters from the data. Thus such techniques can have quadratic complexity if the clustering technique requires computation of pairwise distances for all data instances, or linear when using heuristic based techniques such as k-means [Hartigan and Wong 1979] or approximate clustering techniques [Eskin et al. 2002]. The test phase of clustering based techniques is fast, since it involves comparing a test instance with a small number of clusters. Advantages and Disadvantages of Clustering Based Techniques The advantages of clustering based techniques are as follows: (1) Clustering based techniques can operate in an unsupervised mode. (2) Such techniques can often be adapted to other complex data types by simply plugging in a clustering algorithm that can handle the particular data type. (3) The testing phase for clustering based techniques is fast since the number of clusters against which every test instance needs to be compared is a small constant. The disadvantages of clustering based techniques are as follows: (1) Performance of clustering based techniques is highly dependent on the effectiveness of clustering algorithm in capturing the cluster structure of normal instances. (2) Many techniques detect anomalies as a by-product of clustering, and hence are not optimized for anomaly detection. To Appear in ACM Computing Surveys, 09 2009.
Anomaly Detection : A Survey
·
33
(3) Several clustering algorithms force every instance to be assigned to some cluster. This might result in anomalies getting assigned to a large cluster, thereby being considered as normal instances by techniques that operate under the assumption that anomalies do not belong to any cluster. (4) Several clustering based techniques are effective only when the anomalies do not form significant clusters among themselves. (5) The computational complexity for clustering the data is often a bottleneck, especially if O(N 2 d) clustering algorithms are used. 7. STATISTICAL ANOMALY DETECTION TECHNIQUES The underlying principle of any statistical anomaly detection technique is: “An anomaly is an observation which is suspected of being partially or wholly irrelevant because it is not generated by the stochastic model assumed” [Anscombe and Guttman 1960]. Statistical anomaly detection techniques are based on the following key assumption: Assumption: Normal data instances occur in high probability regions of a stochastic model, while anomalies occur in the low probability regions of the stochastic model. Statistical techniques fit a statistical model (usually for normal behavior) to the given data and then apply a statistical inference test to determine if an unseen instance belongs to this model or not. Instances that have a low probability to be generated from the learnt model, based on the applied test statistic, are declared as anomalies. Both parametric as well as non-parametric techniques have been applied to fit a statistical model. While parametric techniques assume the knowledge of underlying distribution and estimate the parameters from the given data [Eskin 2000], non-parametric techniques do not generally assume knowledge of underlying distribution [Desforges et al. 1998]. In the next two subsection we will discuss parametric and non-parametric anomaly detection techniques. 7.1 Parametric Techniques As mentioned before, parametric techniques assume that the normal data is generated by a parametric distribution with parameters Θ and probability density function f (x, Θ), where x is an observation. The anomaly score of a test instance (or observation) x is the inverse of the probability density function, f (x, Θ). The parameters Θ are estimated from the given data. Alternatively, a statistical hypothesis test (also referred to as discordancy test in statistical outlier detection literature [Barnett and Lewis 1994]) maybe used. The null hypothesis (H0 ) for such tests is that the data instance x has been generated using the estimated distribution (with parameters Θ). If the statistical test rejects H0 , x is declared to be anomaly. A statistical hypothesis test is associated with a test statistic, which can be used to obtain a probabilistic anomaly score for the data instance x. Based on the type of distribution assumed, parametric techniques can be further categorized as follows: To Appear in ACM Computing Surveys, 09 2009.
34
·
Chandola, Banerjee and Kumar Anomalies Max Q3
Median Q1 Min Anomaly
Fig. 9.
A box plot for a univariate data set.
7.1.1 Gaussian Model Based. Such techniques assume that the data is generated from a Gaussian distribution. The parameters are estimated using Maximum Likelihood Estimates (MLE). The distance of a data instance to the estimated mean is the anomaly score for that instance. A threshold is applied to the anomaly scores to determine the anomalies. Different techniques in this category calculate the distance to the mean and the threshold in different ways. A simple outlier detection technique, often used in process quality control domain [Shewhart 1931], is to declare all data instances that are more than 3σ distance away from the distribution mean µ, where σ is the standard deviation for the distribution. The µ ± 3σ region contains 99.7% of the data instances. More sophisticated statistical tests have also been used to detect anomalies, as discussed in [Barnett and Lewis 1994; Barnett 1976; Beckman and Cook 1983]. We will describe a few tests here. The box plot rule (Figure 9) is the simplest statistical technique that has been applied to detect univariate and multivariate anomalies in medical domain data [Laurikkala et al. 2000; Horn et al. 2001; Solberg and Lahti 2005] and turbine rotors data [Guttormsson et al. 1999]. A box-plot graphically depicts the data using summary attributes such as smallest non-anomaly observation (min), lower quartile (Q1 ), median, upper quartile (Q3 ), and largest non-anomaly observation (max). The quantity Q3 − Q1 is called the Inter Quartile Range (IQR). The box plots also indicates the limits beyond which any observation will be treated as an anomaly. A data instance that lies more than 1.5 ∗ IQR lower than Q1 or 1.5 ∗ IQR higher than Q3 is declared as an anomaly. The region between Q1 − 1.5IQR and Q3 + 1.5IQR contains 99.3% of observations, and hence the choice of 1.5IQR boundary makes the box plot rule equivalent to the 3σ technique for Gaussian data. Grubb’s test (also known as the maximum normed residual test) is used to detect anomalies in a univariate data set [Grubbs 1969; Stefansky 1972; Anscombe and Guttman 1960] under the assumption that the data is generated by a Gaussian distribution. For each test instance x, its z score is computed as follows: z=
¯| |x − x s
(1)
¯ and s are the mean and standard deviation of the data sample, respectively. where x To Appear in ACM Computing Surveys, 09 2009.
Anomaly Detection : A Survey
A test instance is declared to be anomalous if: v u t2α/(2N ),N −2 N − 1u z> √ t N − 2 + t2α/(2N ),N −2 N
·
35
(2)
where N is the data size and tα/(2N ),N −2 is a threshold used to declare an instance to be anomalous or normal. This threshold is the value taken by a t-distribution at α a significance level of 2N . The significance level reflects the confidence associated with the threshold and indirectly controls the number of instances declared as anomalous. A variant of the Grubb’s test for multivariate data was proposed by Laurikkala et al. [2000], which uses the Mahalanobis distance of a test instance x to the sample mean x ¯, to reduce multivariate observations to univariate scalars. y 2 = (x − x ¯)0 S −1 (x − x ¯),
(3)
where S is the sample covariance matrix. The univariate Grubb’s test is applied to y to determine if the instance x is anomalous or not. Several other variants of Grubb’s test have been proposed to handle multivariate data sets [Aggarwal and Yu 2001; 2008; Laurikkala et al. 2000], graph structured data [Shekhar et al. 2001], and Online Analytical Processing (OLAP) data cubes [Sarawagi et al. 1998]. The student’s t-test has also been applied for anomaly detection in [Surace and Worden 1998; Surace et al. 1997] to detect damages in structural beams. A normal sample, N1 is compared with a test sample, N2 using the t-test. If the test shows significant difference between them, it signifies the presence of an anomaly in N2 . The multivariate version of student’s t-test called the Hotelling t2 -test is also used as an anomaly detection test statistic in [Liu and Weng 1991] to detect anomalies in bioavailability/bioequivalence studies. Ye and Chen [2001] use a χ2 statistic to determine anomalies in operating system call data. The training phase assumes that the normal data has a multivariate normal distribution. The value of the χ2 statistic is determined as: 2
χ =
n X (Xi − Ei )2 i=1
Ei
(4)
where Xi is the observed value of the ith variable, Ei is the expected value of the ith variable (obtained from the training data) and n is the number of variables. A large value of X 2 denotes that the observed sample contains anomalies. Several other statistical anomaly detection techniques that assume that the data follows a Gaussian distribution have been proposed that use other statistical tests, such as: Rosner test [Rosner 1983], Dixon test [Gibbons 1994], Slippage Detection test [Hawkins 1980], etc. 7.1.2 Regression Model Based. Anomaly detection using regression has been extensively investigated for time-series data [Abraham and Chuang 1989; Abraham and Box 1979; Fox 1972]. The basic regression model based anomaly detection technique consists of two steps. In the first step, a regression model is fitted on the data. In the second step, for each test instance, the residual for the test instance is used to determine the To Appear in ACM Computing Surveys, 09 2009.
36
·
Chandola, Banerjee and Kumar
anomaly score. The residual is the part of the instance which is not explained by the regression model. The magnitude of the residual can be used as the anomaly score for the test instance, though statistical tests have been proposed to determine anomalies with certain confidence [Anscombe and Guttman 1960; Beckman and Cook 1983; Hawkins 1980; Torr and Murray 1993]. Certain techniques detect the presence of anomalies in a data set by analyzing the Akaike Information Content (AIC) during model fitting [Kitagawa 1979; Kadota et al. 2003]. Presence of anomalies in the training data can influence the regression parameters and hence the regression model might not produce accurate results. A popular technique to handle such anomalies while fitting regression models is called robust regression [Rousseeuw and Leroy 1987] (estimation of regression parameters while accommodating anomalies). The authors argue that the robust regression techniques not only hide the anomalies, but can also detect the anomalies, because the anomalies tend to have larger residuals from the robust fit. A similar robust anomaly detection approach has been applied in Autoregressive Integrated Moving Average (ARIMA) models [Bianco et al. 2001; Chen et al. 2005]. Variants of the basic regression models based technique have been proposed to handle multivariate time-series data. Tsay et al. [2000] discuss the additional complexity in multivariate time-series over the univariate time-series and come up with statistics that can be applied to detect anomalies in multivariate ARIMA models. This is a generalization of statistics proposed earlier by Fox [1972]. Another variant that detect anomalies in multivariate time-series data generated by an Autoregressive Moving Average (ARMA) model, was proposed by Galeano et al. [2004]. In this technique the authors transform the multivariate time-series to univariate time-series by linearly combining the components of the multivariate time-series. The interesting linear combinations (projections in 1-d space) are obtained using a projection pursuit technique [Huber 1985] that maximizes the Kurtosis coefficient (a measure for the degree of peakedness/flatness in the variable distribution) of the time-series data. The anomaly detection in each projection is done by using univariate test statistics as proposed by Fox [1972]. 7.1.3 Mixture of Parametric Distributions Based. Such techniques use a mixture of parametric statistical distributions to model the data. Techniques in this category can be grouped into two sub-categories. The first sub-category of techniques model the normal instances and anomalies as separate parametric distributions, while the second sub-category of techniques model only the normal instances as a mixture of parametric distributions. For the first sub-category of techniques, the testing phase involves determining which distribution—normal or anomalous—the test instance belongs to. Abraham and Box [1979] assume that the normal data is generated from a Gaussian distribution (N(0,σ 2 )) and the anomalies are also generated from a Gaussian distribution with same mean but with larger variance, N(0,k 2 σ 2 ). A test instance is tested using the Grubb’s test on both distributions, and accordingly labeled as normal or anomalous. Similar techniques have been proposed in [Lauer 2001; Eskin 2000; Abraham and Box 1979; Box and Tiao 1968; Agarwal 2005]. Eskin [2000] use Expectation Maximization (EM) algorithm to develop a mixture of models for the two classes, assuming that each data point is an anomaly with apriori probability λ, and To Appear in ACM Computing Surveys, 09 2009.
Anomaly Detection : A Survey
·
37
normal with apriori probability 1 − λ. Thus, if D represents the actual probability distribution of the entire data, and M and A represent the distributions of the normal and anomalous data respectively, then D = λA + (1 − λ)M. M is learnt using any distribution estimation technique, while A is assumed to be uniform. Initially all points are considered to be in M. The anomaly score is assigned to a point based on how much the distributions change if that point is removed from M and added to A. The second sub-category of techniques model the normal instances as a mixture of parametric distributions. A test instance which does not belong to any of the learnt models is declared to be anomaly. Gaussian mixture models have been mostly used for such techniques Agarwal [2006], and have been used to detect strains in airframe data [Hickinbotham and Austin 2000a; Hollier and Austin 2002], to detect anomalies in mammographic image analysis [Spence et al. 2001; Tarassenko 1995] and for network intrusion detection [Yamanishi and ichi Takeuchi 2001; Yamanishi et al. 2004]. Similar techniques have been applied to detecting anomalies in biomedical signal data [Roberts and Tarassenko 1994; Roberts 1999; 2002], where extreme value statistics2 are used to determine if a test point is an anomaly with respect to the learnt mixture of models or not. Byers and Raftery [1998] use a mixture of Poisson distributions to model the normal data and then detect anomalies. 7.2 Non-parametric Techniques The anomaly detection techniques in this category use non-parametric statistical models, such that the model structure is not defined a prioiri, but is instead determined from given data. Such techniques typically make fewer assumptions regarding the data, such as smoothness of density, when compared to parametric techniques. 7.2.1 Histogram Based. The simplest non-parametric statistical technique is to use histograms to maintain a profile of the normal data. Such techniques are also referred to as frequency based or counting based. Histogram based techniques are particularly popular in intrusion detection community [Eskin 2000; Eskin et al. 2001; Denning 1987] and fraud detection [Fawcett and Provost 1999], since the behavior of the data is governed by certain profiles (user or software or system) that can be efficiently captured using the histogram model. A basic histogram based anomaly detection technique for univariate data consists of two steps. The first step involves building a histogram based on the different values taken by that feature in the training data. In the second step, the technique checks if a test instance falls in any one of the bins of the histogram. If it does, the test instance is normal, otherwise it is anomalous. A variant of the basic histogram based technique is to assign an anomaly score to each test instance based on the height (frequency) of the bin in which it falls. 2 Extreme
Value Theory (EVT) [Pickands 1975] is a similar concept as anomaly detection, and deals with extreme deviations of a probability distribution. EVT has been applied to risk management [McNeil 1999] as a method for modeling and measuring extreme risks. The key difference between extreme values and statistical anomalies is that extreme values are known to occur at the extremities of a probability distribution, while anomalies are more general. Anomalies can also be generated from a different distribution altogether. To Appear in ACM Computing Surveys, 09 2009.
38
·
Chandola, Banerjee and Kumar
The size of the bin used when building the histogram is key for anomaly detection. If the bins are small, many normal test instances will fall in empty or rare bins, resulting in a high false alarm rate. If the bins are large, many anomalous test instances will fall in frequent bins, resulting in a high false negative rate. Thus a key challenge for histogram based techniques is to determine an optimal size of the bins to construct the histogram which maintains low false alarm rate and low false negative rate. Histogram based techniques require normal data to build the histograms [Anderson et al. 1994; Javitz and Valdes 1991; Helman and Bhangoo 1997]. Some techniques even construct histograms for the anomalies [Dasgupta and Nino 2000], if labeled anomalous instances are available. For multivariate data, a basic technique is to construct attribute-wise histograms. During testing, for each test instance, the anomaly score for each attribute value of the test instance is calculated as the height of the bin that contains the attribute value. The per-attribute anomaly scores are aggregated to obtain an overall anomaly score for the test instance. The basic histogram based technique for multivariate data has been applied to system call intrusion detection Endler [1998], network intrusion detection [Ho et al. 1999; Yamanishi and ichi Takeuchi 2001; Yamanishi et al. 2004], fraud detection [Fawcett and Provost 1999], damage detection in structures [Manson 2002; Manson et al. 2001; Manson et al. 2000], detecting web-based attacks [Kruegel and Vigna 2003; Kruegel et al. 2002], and anomalous topic detection in text data [Allan et al. 1998]. A variant of the simple technique is used in Packet Header Anomaly Detection (PHAD) and Application Layer Anomaly Detection (ALAD) [Mahoney and Chan 2002], applied to network intrusion detection. The SRI International’s real-time Network Intrusion Detection System (NIDES) [Anderson et al. 1994; Anderson et al. 1995; Porras and Neumann 1997] has a subsystem that maintains long-term statistical profiles to capture the normal behavior of a computer system [Javitz and Valdes 1991]. The authors propose a Q statistic to compare a long-term profile with a short term profile (observation). The statistic is used to determine another measure called S statistic which reflects the extent to which the behavior in a particular feature is anomaly with respect to the historical profile. The feature-wise S statistics are combined to get a single value called IS statistic which determines if a test instance is anomalous or not. A variant has been proposed by Sargor [1998] for anomaly detection in link-state routing protocols. 7.2.2 Kernel Function Based. A non-parametric technique for probability density estimation is parzen windows estimation [Parzen 1962]. This involves using kernel functions to approximate the actual density. Anomaly detection techniques based on kernel functions are similar to parametric methods described earlier. The only difference is the density estimation technique used. Desforges et al. [1998] proposed a semi-supervised statistical technique to detect anomalies which uses kernel functions to estimate the probability distribution function (pdf) for the normal instances. A new instance which lies in the low probability area of this pdf is declared to be anomalous. Similar application of parzen windows is proposed for network intrusion detection [Chow and Yeung 2002], for novelty detection in oil flow data [Bishop 1994], and To Appear in ACM Computing Surveys, 09 2009.
Anomaly Detection : A Survey
·
39
for mammographic image analysis [Tarassenko 1995]. Computational Complexity The computational complexity of statistical anomaly detection techniques depends on the nature of statistical model that is required to be fitted on the data. Fitting single parametric distributions from the exponential family, e.g., Gaussian, Poisson, Multinomial, etc., is typically linear in data size as well as number of attributes. Fitting complex distributions (such as mixture models, HMM, etc.) using iterative estimation techniques such as Expectation Maximization (EM), are also typically linear per iteration, though they might be slow in converging depending on the problem and/or convergence criterion. Kernel based techniques can potentially have quadratic time complexity in terms of the data size. Advantages and Disadvantages of Statistical Techniques The advantages of statistical techniques are: (1) If the assumptions regarding the underlying data distribution hold true, statistical techniques provide a statistically justifiable solution for anomaly detection. (2) The anomaly score provided by a statistical technique is associated with a confidence interval, which can be used as additional information while making a decision regarding any test instance. (3) If the distribution estimation step is robust to anomalies in data, statistical techniques can operate in a unsupervised setting without any need for labeled training data. The disadvantages of statistical techniques are: (1) The key disadvantage of statistical techniques is that they rely on the assumption that the data is generated from a particular distribution. This assumption often does not hold true, especially for high dimensional real data sets. (2) Even when the statistical assumption can be reasonably justified, there are several hypothesis test statistics that can be applied to detect anomalies; choosing the best statistic is often not a straightforward task [Motulsky 1995]. In particular, constructing hypothesis tests for complex distributions that are required to fit high dimensional data sets is nontrivial. (3) Histogram based techniques are relatively simple to implement, but a key shortcoming of such techniques for multivariate data is that they are not able to capture the interactions between different attributes. An anomaly might have attribute values that are individually very frequent, but their combination is very rare, but an attribute-wise histogram based technique would not be able to detect such anomalies. 8. INFORMATION THEORETIC ANOMALY DETECTION TECHNIQUES Information theoretic techniques analyze the information content of a data set using different information theoretic measures such as Kolomogorov Complexity, entropy, relative entropy, etc. Such techniques are based on the following key assumption: Assumption: Anomalies in data induce irregularities in the information content of the data set. To Appear in ACM Computing Surveys, 09 2009.
40
·
Chandola, Banerjee and Kumar
Let C(D) denote the complexity of a given data set, D. A basic information theoretic technique can be described as follows. Given a data set D, find the minimal subset of instances, I, such that C(D)−C(D−I) is maximum. All instances in the subset thus obtained, are deemed as anomalous. The problem addressed by this basic technique is to find a pareto-optimal solution, which does not have a single optima, since there are two different objectives that need to be optimized. In the above described technique, the complexity of a data set (C) can be measured in different ways. Kolomogorov complexity [Li and Vitanyi 1993] has been used by several techniques [Arning et al. 1996; Keogh et al. 2004]. Arning et al. [1996] use the size of the regular expression to measure the Kolomogorov Complexity of data (represented as a string) for anomaly detection. Keogh et al. [2004] use the size of the compressed data file (using any standard compression algorithm), as a measure of the data set’s Kolomogorov Complexity. Other information theoretic measures such as entropy, relative uncertainty, etc., have also been used to measure the complexity of a categorical data set [Lee and Xiang 2001; He et al. 2005; He et al. 2006; Ando 2007]. The basic technique described above, involves dual optimization to minimize the subset size while maximizing the reduction in the complexity of the data set. Thus an exhaustive approach in which every possible subset of the data set is considered would run in exponential time. Several techniques have been proposed that perform approximate search for the most anomalous subset. He et al. [2006] use an approximate algorithm called Local Search Algorithm (LSA) [He et al. 2005] to approximately determine such a subset in a linear fashion, using entropy as the complexity measure. A similar technique that uses an information bottleneck measure was proposed by [Ando 2007]. Information theoretic techniques have also been used in data sets in which data instances are naturally ordered, e.g., sequential data, spatial data. In such cases, the data is broken into substructures (segments for sequences, subgraphs for graphs, etc.), and the anomaly detection technique finds the substructure, I, such that C(D) − C(D − I) is maximum. This technique has been applied to sequences [Lin et al. 2005; Chakrabarti et al. 1998; Arning et al. 1996], graph data [Noble and Cook 2003], and spatial data [Lin and Brown 2003]. A key challenge of such techniques is to find the optimal size of the substructure which would result in detecting anomalies. Computational Complexity As mentioned earlier, the basic information theoretic anomaly detection technique has exponential time complexity, though approximate techniques have been proposed that have linear time complexity. Advantages and Disadvantages of Information Theoretic Techniques The advantages of information theoretic techniques are as follows: (1) They can operate in an unsupervised setting. (2) They do not make any assumptions about the underlying statistical distribution for the data. The disadvantages of information theoretic techniques are as follows: To Appear in ACM Computing Surveys, 09 2009.
Anomaly Detection : A Survey
·
41
(1) The performance of such techniques is highly dependent on the choice of the information theoretic measure. Often, such measures can detect the presence of anomalies only when there are significantly large number of anomalies present in the data. (2) Information theoretic techniques applied to sequences and spatial data sets rely on the size of the substructure, which is often nontrivial to obtain. (3) It is difficult to associate an anomaly score with a test instance using an information theoretic technique. 9. SPECTRAL ANOMALY DETECTION TECHNIQUES Spectral techniques try to find an approximation of the data using a combination of attributes that capture the bulk of variability in the data. Such techniques are based on the following key assumption: Assumption: Data can be embedded into a lower dimensional subspace in which normal instances and anomalies appear significantly different. Thus the general approach adopted by spectral anomaly detection techniques is to determine such subspaces (embeddings, projections, etc.) in which the anomalous instances can be easily identified [Agovic et al. 2007]. Such techniques can work in an unsupervised as well as semi-supervised setting. Several techniques use Principal Component Analysis (PCA) [Jolliffe 2002] for projecting data into a lower dimensional space. One such technique [Parra et al. 1996] analyzes the projection of each data instance along the principal components with low variance. A normal instance that satisfies the correlation structure of the data will have a low value for such projections while an anomalous instances that deviates from the correlation structure will have a large value. Dutta et al. [2007] adopt this approach to detect anomalies in astronomy catalogs. Ide and Kashima [2004] propose a spectral technique to detect anomalies in a time series of graphs. Each graph is represented as an adjacency matrix for a given time. At every time instance, the principle component of the matrix is chosen as the activity vector for the given graph. The time-series of the activity vectors is considered as a matrix and the principal left singular vector is obtained to capture the normal dependencies over time in the data. For a new (test) graph, then angle between its activity vector and the principal left singular vector obtained from the previous graphs is computed and used to determine the anomaly score of the test graph. In a similar approach, Sun et al. [2007] propose an anomaly detection technique on a sequence of graphs by performing Compact Matrix Decomposition (CMD) on the adjacency matrix for each graph and thus obtaining an approximation of the original matrix. For each graph in the sequence, the authors perform CMD and compute the approximation error between the original adjacency matrix and the approximate matrix. The authors construct a time series of the approximation errors and detect anomalies in the time series of errors; the graph corresponding to anomalous approximation error is declared to be anomalous. Shyu et al. [2003] present an anomaly detection technique where the authors perform robust PCA [Huber 1974] to estimate the principal components from the covariance matrix of the normal training data. The testing phase involves comparTo Appear in ACM Computing Surveys, 09 2009.
42
·
Chandola, Banerjee and Kumar
ing each point with the components and assigning an anomaly score based on the point’s distance from the principal components. Thus if the projection of x on the principal components are y1 , y2 , . . ., yp and the corresponding eigen-values are λ1 , λ2 , . . ., λp , then q X y2 i
i=1
λi
=
yq2 y12 y2 + 2 + ... + ,q ≤ p λ1 λ2 λq
(5)
has a chi-square distribution [Hawkins 1974]. Using this result, the authors propose that, for a given significance level α, observation x is an anomaly if q X y2 i
i=1
λi
> χ2q (α)
(6)
It can be shown that the quantity calculated in Equation 5 is equal to the Mahalanobis distance of the instance x from the sample mean (See Equation 3) when q = p [Shyu et al. 2003]. Thus the robust PCA based technique is same as a statistical technique discussed in Section 7.1.1 in a smaller subspace. The robust PCA based technique has been applied to the network intrusion detection domain [Shyu et al. 2003; Lakhina et al. 2005; Thottan and Ji 2003] and for detecting anomalies in space craft components [Fujimaki et al. 2005]. Computational Complexity Standard PCA based techniques are typically linear in data size but often quadratic in the number of dimensions. Non linear techniques can improve the time complexity to be linear in the number of dimensions but polynomial in the number of principal components [Gunter et al. 2007]. Techniques that perform SVD on the data typically quadratic in data size. Advantages and Disadvantages of Spectral Techniques The advantages of spectral anomaly detection techniques are as follows: (1) Spectral techniques automatically perform dimensionality reduction and hence are suitable for handling high dimensional data sets. Moreover, they can also be used as a pre-processing step followed by application of any existing anomaly detection technique in the transformed space. (2) Spectral techniques can be used in an unsupervised setting. The disadvantages of spectral anomaly detection techniques are as follows: (1) Spectral techniques are useful only if the normal and anomalous instances are separable in the lower dimensional embedding of the data. (2) Spectral techniques typically have high computational complexity. 10. HANDLING CONTEXTUAL ANOMALIES The anomaly detection techniques discussed in the previous sections primarily focus on detecting point anomalies. In this section, we will discuss anomaly detection techniques that handle contextual anomalies. As discussed in Section 2.2.2, contextual anomalies require that the data has a set of contextual attributes (to define a context), and a set of behavioral attributes (to To Appear in ACM Computing Surveys, 09 2009.
Anomaly Detection : A Survey
·
43
detect anomalies within a context). Song et al. [2007] use the terms environmental and indicator attributes which are analogous to our terminology. Some of the ways in which contextual attributes can be defined are: (1) Spatial: The data has spatial attributes, which define the location of a data instance and hence a spatial neighborhood. A number of context based anomaly detection techniques [Lu et al. 2003; Shekhar et al. 2001; Kou et al. 2006; Sun and Chawla 2004] have been proposed for data with spatial data. (2) Graphs: The edges that connect nodes (data instances) define neighborhood for each node. Contextual anomaly detection techniques have been applied to graph based data by Sun et al. [2005]. (3) Sequential: The data is sequential, i.e., the contextual attributes of a data instance is its position in the sequence. Time-series data has been extensively explored in the contextual anomaly detection category [Abraham and Chuang 1989; Abraham and Box 1979; Rousseeuw and Leroy 1987; Bianco et al. 2001; Fox 1972; Salvador and Chan 2003; Tsay et al. 2000; Galeano et al. 2004; Zeevi et al. 1997]. Another form of sequential data for which anomaly detection techniques have been developed is event data, in which each event has a timestamp (such as operating system call data or web data [Ilgun et al. 1995; Vilalta and Ma 2002; Weiss and Hirsh 1998; Smyth 1994]). The difference between time-series data and event sequences is that for the latter, the inter-arrival time between consecutive events is uneven. (4) Profile: Often times the data might not have an explicit spatial or sequential structure, but can still be segmented or clustered into components using a set of contextual attributes. These attributes are typically used to profile and group users in activity monitoring systems, such as cell-phone fraud detection [Fawcett and Provost 1999; Teng et al. 1990], CRM databases [He et al. 2004b] and credit-card fraud detection [Bolton and Hand 1999]. The users are then analyzed within their group for anomalies. In comparison to the rich literature on point anomaly detection techniques, the research on contextual anomaly detection has been limited. Broadly, such techniques can be classified in two categories. The first category of techniques reduce a contextual anomaly detection problem to a point anomaly detection problem while the second category of techniques model the structure in the data and use the model to detect anomalies. 10.1 Reduction to Point Anomaly Detection Problem Since contextual anomalies are individual data instances (like point anomalies), but are anomalous only with respect to a context, one approach is to apply a known point anomaly detection technique within a context. A generic reduction based technique consists of two steps. First, identify a context for each test instance using the contextual attributes. Second, compute anomaly score for the test instance within the context using a known point anomaly detection technique. To Appear in ACM Computing Surveys, 09 2009.
44
·
Chandola, Banerjee and Kumar
An example of the generic reduction based technique has been proposed for the scenario where identifying the context is not straightforward [Song et al. 2007]. The authors assume that the attributes are already partitioned into contextual and behavioral attributes. Thus each data instance d can be represented as [x, y]. The contextual data is partitioned using a mixture of Gaussian model, say U . The behavioral data is also partitioned using another mixture of Gaussian model, say V . A mapping function, p(Vj |Ui ) is also learnt. This mapping indicates the probability of the indicator part of a data point y to be generated from a mixture component Vj , when the environmental part x is generated by Ui . Thus for a given test instance d = [x, y], the anomaly score is given by: Anomaly Score =
nU X
p(x ∈ Ui )
i=1
nV X
p(y ∈ Vj )p(Vj |Ui )
j=1
where nU is the number of mixture components in U and NV is the number of mixture components in V . p(x ∈ Ui ) indicates the probability of a sample point x to be generated from the mixture component Ui while p(y ∈ Uj ) indicates the probability of a sample point y to be generated from the mixture component Vj . Another example of the generic technique is applied to cell-phone fraud detection [Fawcett and Provost 1999]. The data in this case consists of cell-phone usage records. One of the attributes in the data is the cell-phone user which is used as the contextual attribute. The activity of each user is then monitored to detect anomalies using other attributes. A similar technique is adopted for computer security [Teng et al. 1990], where the contextual attributes are: user id, time of the day. The remaining attributes are compared with existing rules representing normal behavior to detect anomalies. Peer group analysis [Bolton and Hand 1999] is another similar technique where users are grouped together as peers and analyzed within a group for fraud. He et al. [2004b] propose the concept of class anomaly detection, which is essentially segmenting the data using the class labels, and then applying a known clustering based anomaly detection technique [He et al. 2002] to detect anomalies within this subset. For spatial data, neighborhoods are intuitive and straightforward to detect [Ng and Han 1994] by using the location coordinates. Graph-based anomaly detection [Shekhar et al. 2001; Lu et al. 2003; Kou et al. 2006] use Grubb’s score [Grubbs 1969] or similar statistical point anomaly detection techniques to detect anomalies within a spatial neighborhood. Sun and Chawla [2004] use a distance based measure called SLOM (Spatial Local Outlier Measure [Sun and Chawla 2006]) to detect spatial anomalies within a neighborhood. Another example of the generic technique applied to time-series data is proposed by Basu and Meckesheimer [2007]. For a given instance in a time-series the authors compare the observed value to the median of the neighborhood values. A transformation technique for time-series data has been proposed by using phase spaces [Ma and Perkins 2003b]. This technique converts a time-series into a set of vectors by unfolding the time-series into a phase space using a time-delay embedding process. The temporal relations at any time instance are embedded in the phase vector for that instance. The authors use this technique to transform a time-series into feature space and then use one-class SVMs to detect anomalies. Each anomaly can be To Appear in ACM Computing Surveys, 09 2009.
Anomaly Detection : A Survey
·
45
translated to a value at certain time instance in the original time-series. 10.2 Utilizing the Structure in Data In several scenarios, breaking up data into contexts is not straightforward. This is typically true for time-series data and event sequence data. In such cases, timeseries modeling and sequence modeling techniques are extended to detect contextual anomalies in the data. A generic technique in this category can be described as follows. A model is learnt from the training data which can predict the expected behavior with respect to a given context. If the expected behavior is significantly different from the observed behavior, an anomaly is declared. A simple example of this generic technique is regression in which the contextual attributes can be used to predict the behavioral attribute by fitting a regression line on the data. For time series data, several regression based techniques for time-series modeling such as robust regression [Rousseeuw and Leroy 1987], auto-regressive models [Fox 1972], ARMA models [Abraham and Chuang 1989; Abraham and Box 1979; Galeano et al. 2004; Zeevi et al. 1997], and ARIMA models [Bianco et al. 2001; Tsay et al. 2000], have been developed for contextual anomaly detection. Regression based techniques have been extended to detect contextual anomalies in a set of co-evolving sequences by modeling the regression as well as correlation between the sequences [Yi et al. 2000]. One of the earliest works in time-series anomaly detection was proposed by Fox [1972], where a time-series was modeled as a stationary auto-regressive process. Any observation is tested to be anomaly by comparing it with the covariance matrix of the auto-regressive process. If the observation falls outside the modeled error for the process, it is declared to be an anomaly. An extension to this technique is made by using Support Vector Regression to estimate the regression parameters and then using the learnt model to detect novelties in the data [Ma and Perkins 2003a]. A technique to detect a single anomaly (discord) in a sequence of alphabets was proposed by Keogh et al. [2004]. The technique adopts a divide and conquer approach. The sequence is divided into two parts and the Kolmogorov Complexity is calculated for each. The one with higher complexity contains the anomaly. The sequence is recursively divided until they are left with a single event which is declared to be the anomaly in the sequence. Weiss and Hirsh [1998] propose a technique to detect rare events in sequential data, where they use events occurring before a particular time to predict the event occurring at that time instance. If the prediction does not match the actual event, it is declared to be rare. This idea is extended in other areas, where the authors have used Frequent Itemset Mining [Vilalta and Ma 2002], Finite State Automaton (FSA) [Ilgun et al. 1995; Salvador and Chan 2003] and Markov Models [Smyth 1994] to determine conditional probabilities for events based on the history of events. Marceau [2000] use FSA to predict the next event of a sequence based on the previous n events. They apply this technique to the domain of system call intrusion detection. Hollmen and Tresp [1999] employ HMM for cell phone fraud detection. The authors use a hierarchical regime switching call model to model the cell phone activity of a user. The model predicts the probability of a fraud taking place for a call using the learnt model. The parameter estimation is done using the EM To Appear in ACM Computing Surveys, 09 2009.
46
·
Chandola, Banerjee and Kumar
algorithm. A model to detect intrusions in telephone networks was proposed by Scott [2001] and for modeling web click data by Ihler et al. [2006]. Both papers follow a technique in which they assume that the normal behavior in a time-series is generated by a non-stationary Poisson process while the anomalies are generated by a homogenous Poisson process. The transition between normal and anomalous behavior is modeled using a Markov process. The proposed techniques in each of these papers use Markov Chain Monte Carlo (MCMC) estimation technique to estimate the parameters for these processes. For testing, a time series is modeled using this process and the time instances for which the anomalous behavior was active are considered as anomalies. Bipartite graph structure in P2P networks has been used to first identify a neighborhood for any node in the graph [Sun et al. 2005], and then detecting the relevance of that node within the neighborhood. A node with a low relevance score is treated as an anomaly. The authors also propose an approximate technique where the graph is first partitioned into non-overlapping subgraphs using graph partitioning algorithm such as METIS [Karypis and Kumar 1998]. The neighborhood of a node is then computed within its partition. Computational Complexity The computational complexity of the training phase in reduction based contextual anomaly detection techniques depends on the reduction technique as well as the point anomaly detection technique used within each context. While segmenting/partitioning techniques have a fast reduction step, techniques that use clustering, or mixture of models estimation, are relatively slower. Since the reduction simplifies the anomaly detection problem, fast point anomaly detection techniques can be used to speed up the second step. The testing phase is relatively expensive since for each test instance, its context is determined, and then an anomaly label or score is assigned using a point anomaly detection technique. The computational complexity of training phase in contextual anomaly detection techniques that utilize the structure in the data to build models, is typically higher that of techniques that reduce the problem to point anomaly detection. An advantage for such techniques is the testing phase is relatively fast, since each instance is just compared to the single model and assigned an anomaly score or an anomaly label. Advantages and Disadvantages of Contextual Anomaly Detection Techniques The key advantage of contextual anomaly detection techniques is that they allow a natural definition of an anomaly in many real life applications where data instances tend to be similar within a context. Such techniques are able to detect anomalies that might not be detected by point anomaly detection techniques that take a global view of the data. The disadvantage of contextual anomaly detection techniques is that they are applicable only when a context can be defined. To Appear in ACM Computing Surveys, 09 2009.
Anomaly Detection : A Survey
·
47
11. HANDLING COLLECTIVE ANOMALIES This section discusses the anomaly detection techniques which focus on detecting collective anomalies. As mentioned earlier, collective anomalies are a subset of instances that occur together as a collection and whose occurrence is not normal with respect to a normal behavior. The individual instances belonging to this collection are not necessarily anomalies by themselves, but it is their co-occurrence in a particular form that makes them anomalies. Collective anomaly detection problem is more challenging than point and contextual anomaly detection because it involves exploring structure in the data for anomalous regions. A primary data requirement for collective anomaly detection, is the presence of relationship between data instances. Three types of relations that have been exploited most frequently are sequential, spatial, and graphs: —Sequential Anomaly Detection Techniques: These techniques work with sequential data and find subsequences as anomalies (also referred to as sequential anomalies). Typical data sets include event sequence data, such as system call data [Forrest et al. 1999] or numerical time-series data [Chan and Mahoney 2005]. —Spatial Anomaly Detection Techniques: These techniques work with spatial data and find connected subregions within the data as anomalies (also referred to as spatial anomalies). Anomaly detection techniques have been applied to multispectral imagery data [Hazel 2000]. —Graph Anomaly Detection Techniques: These techniques work with graph data and find connected subgraphs within the data as anomalies (also referred to as graph anomalies). Anomaly detection techniques have been applied to graph data [Noble and Cook 2003]. Substantial research has been done in the field of sequential anomaly detection; this can be attributed to the existence of sequential data in several important application domains. Spatial anomaly detection has been explored primarily in the domain of image processing. The following subsections discuss each of these categories in detail. 11.1 Handling Sequential Anomalies As mentioned earlier, collective anomaly detection in sequence data involves detecting sequences that are anomalous with respect to a definition of normal behavior. Sequence data is very common in a wide range of domains where a natural ordering is imposed on data instances by either time or position. In anomaly detection literature, two types of sequences are dealt with. First type of sequences are symbolic, such as a sequence of operating system calls, or a sequence of biological entities. Second type of sequences are continuous, or time series. Sequences can also be univariate, in which each event in the sequence is a univariate observation, or multivariate, in which each event in the sequence is a multivariate observation. The anomaly detection problem for sequences can be defined in different ways and are discussed below. 11.1.1 Detecting anomalous sequence in a set of sequences. The objective of the techniques in this category is to detect anomalous sequences from a given set of To Appear in ACM Computing Surveys, 09 2009.
48
·
Chandola, Banerjee and Kumar
sequences. Such techniques can either operate in a semi-supervised mode, or an unsupervised mode. Key challenges faced by techniques in this category are: —The sequences might not be of equal length. —The test sequences may not be aligned with each other or with normal sequences. For example, the first event in one sequence might correspond to the third event in another sequence. Comparing such sequences is a fundamental problem with biological sequences [Gusfield 1997] where different sequence alignment and sequence matching techniques are explored. Techniques addressing this problem follow one of the following two approaches: Reduction to Point Anomaly Detection Problem A general approach to solve the above problem would be to transform the sequences to a finite feature space and then use a point anomaly detection technique in the new space to detect anomalies. Certain techniques assume that all sequences are of equal lengths. Thus they treat each sequence as a vector of attributes and employ a point anomaly detection technique to detect anomalies. For example, if a data set contains length 10 sequences, they can be treated as data records with 10 features. A similarity or distance measure can be defined between a pair of sequences and any point anomaly detection technique can be applied to such data sets. This approach has been adopted for time-series data sets [Caudell and Newman 1993; Blender et al. 1997]. In the former paper, the authors apply ART (Adaptive Resonance Theory) neural networks based anomaly detection technique to detect anomalies in a time-series data set, while the latter paper uses a clustering based anomaly detection technique to identify cyclone regimes (anomalies) in weather data. As mentioned earlier, the given sequences may not be of equal length. Certain techniques address this issue by transforming each sequence into a record of equal number of attributes. A transformation technique has been proposed for multiple time-series data [Chan and Mahoney 2005], known as Box Modeling. In a box model, for each time-series, each instance of this time-series is assigned to a box depending on its value. These boxes are then treated as features (the number of boxes is the number of features in the transformed feature space). The authors then apply point anomaly detection techniques — a Euclidean distance based technique and a classification based technique using RIPPER to detect anomalous time series in the data. Several techniques address the issue of unequal length of sequences by using a similarity or distance metric that can compute similarity or distance between two unequal length sequences. For example, [Budalakoti et al. 2006] employ length of longest common subsequence as the similarity measure for symbolic sequences. The authors subsequently apply a clustering based anomaly detection technique, using this similarity measure. 11.1.1.1 Modeling Sequences. The transformations discussed in the previous section are appropriate when all the sequences are properly aligned. Often times the alignment assumption becomes too prohibitive. Research dealing with system call data, biological data, etc., explore other alternatives to detect collective anomalies. To Appear in ACM Computing Surveys, 09 2009.
Anomaly Detection : A Survey
·
49
Such techniques operate in a semi-supervised mode, and hence require a training set of normal sequences. Sequential association modeling has been used to generate sequential rules from sequences [Teng et al. 1990]. The authors use an approach called time-based inductive learning to generate rules from the set of normal sequences. The test sequence is compared to these rules and is declared an anomaly if it contains patterns for which no rules have been generated. Markovian modeling of sequences has been the most popular approach in this category. The modeling techniques used in this category range from Finite State Automatons (FSA) to Markov models. FSA have been used to detect anomalies in network protocol data [Sekar et al. 2002; Sekar et al. 1999]. Anomalies are detected when a given sequence of events does not result in reaching one of the final states. The authors also apply their technique to operating system call intrusion detection [Sekar et al. 2001]. Ye [2004] proposes a simple 1-order markov chain modeling approach to detect if a given sequence S is an anomaly. The author determines the likelihood of S, P (S) using the following equation P (S) = qS1
|S| Y
pSt−1 St
t=2
where qS1 is the probability of observing the symbol S1 in the training set and pSt−1 St is the probability of observing the symbol St after symbol St−1 in the training set. The inverse of P (S) is the anomaly score for S. The drawback of this technique is that single order markov chain cannot model higher order dependencies in the sequences. Forrest et al. [1999] propose a Hidden Markov Model (HMM) based technique to detect anomalous program traces in operating system call data. The authors train an HMM using the training sequences. The authors propose two testing techniques. In the first technique they compute the likelihood of a test sequence S to be generated by the learnt HMM using the Viterbi algorithm. The second technique is to use the underlying Finite State Automaton (FSA) of the HMM. The state transitions and the outputs made by the HMM to produce the test sequence are recorded. The authors count the number of times the HMM had to make an unlikely state transition or output an unlikely symbol (using a user-defined threshold) as mismatches. The total number of mismatches denote the anomaly score for that sequence. A Probabilistic Suffix Trees (PST) is another modeling tool which has been applied to detect collective anomalies in sequential databases. A PST is a compact representation of a variable order markov chain. Yang and Wang [2003] use PST to cluster sequences and detect anomalous sequences as a by-product. Similarly, Smyth [1997] and Cadez et al. [2000] use HMMs to cluster the set of sequences and detect any sequences which do not belong to any cluster as anomalies. Another modeling tool used for sequential anomaly detection is Sparse Markov Trees (SMT), which is similar to a PST with the difference that it allows wild card symbols within a path. This technique has been used by Eskin et al. [2001], who train a mixture of SMT using the training set. Each SMT has a different location of To Appear in ACM Computing Surveys, 09 2009.
50
·
Chandola, Banerjee and Kumar
wildcards. Testing phase involves predicting the probability P (Sn |Sn−1 . . . S1 ) using the best SMT from the mixture. If this probability is below a certain threshold, the test sequence is declared as an anomaly. 11.1.2 Detecting anomalous subsequences in a long sequence. The objective of techniques belonging to this category is to detect a subsequence within a given sequence which is anomalous with respect to the rest of the sequence. Such anomalous subsequences have also been referred as discords [Bu et al. 2007; Fu et al. 2006; Keogh et al. 2005; Yankov et al. 2007]. This problem formulation occurs in event and time-series data sets where the data is in the form of a long sequence and contains regions that are anomalous. The techniques that address this problem, typically work in an unsupervised mode, due to the lack of any training data. The underlying assumption is that the normal behavior of the time-series follows a defined pattern. A subsequence within the long sequence which does not conform to this pattern is an anomaly. Key challenges faced by techniques in this category are: —The length of the anomalous subsequence to be detected is not generally defined. A long sequence could contain anomalous regions of variable lengths. Thus fixed length segmenting of the sequence is often not useful. —Since the input sequence contains anomalous regions, it becomes challenging to create a robust model of normalcy. Chakrabarti et al. [1998] propose a surprise detection technique in market basket transactions. The data is a sequence of itemsets, ordered by time. The authors propose to segment the sequence of itemsets such that the sum of number of bits require to encode each segment (using Shannon’s classical Information Theorem) is minimized. The authors show that an optimal solution exists to find such segmentation. The segments which require highest number of bits for encoding are treated as anomalies. Keogh et al. [2004] propose an algorithm called Window Comparison Anomaly Detection (WCAD), where the authors extract subsequences out of a given sequence of continuous observations using a sliding window. The authors compare each subsequence with the entire sequence using a compression based dissimilarity measure. The anomaly score of each subsequence is its dissimilarity with the entire sequence. Keogh et al [2005; 2006] propose a related technique (HOT SAX) to solve the above problem for continuous time-series. The basic approach followed by the authors is to extract subsequences out of the given sequence using sliding window, and then computing the distance of each subsequence to its closest non-overlapping subsequence within the original sequence. The anomaly score of a subsequence is proportional to its distance from its nearest neighbors. Distance between two sequences is measured using Euclidean measure. Similar approach is also applied to the domain of medical data by Lin et al. [2005]. The same authors propose the use of Haar Wavelet based transformation to make the previous technique more efficient [Fu et al. 2006; Bu et al. 2007]. Maximum Entropy Markov Models (Maxent) [McCallum et al. 2000; Pavlov and Pennock 2002; Pavlov 2003] as well as Conditional Random Fields (CRF) [Lafferty et al. 2001], have been used for segmenting text data. The problem formulation To Appear in ACM Computing Surveys, 09 2009.
Anomaly Detection : A Survey
·
51
there is to predict the most likely state sequence for a given observation sequence. Any anomalous segment within the observation sequence will have a low conditional probability for any state sequence. 11.1.3 Determining if the frequency of a query pattern in a given sequence is anomalous w.r.t its expected frequency. Such formulation of the anomaly detection problem is motivated from the case vs control type of data [Helman and Bhangoo 1997; Gwadera et al. 2005b; 2004]. The idea is to detect patterns whose occurrence in a given test data set (case) is different from its occurrence in a normal data set (control). Keogh et al. [2002] extract substrings from a given string of alphabets using a sliding window. For each of these substrings they determine if this substring is anomalous with respect to a normal database of strings. The authors use suffix trees to estimate the expected frequency of a substring in the normal database of strings. In a similar approach [Gwadera et al. 2005a], the authors use Interpolated Markov Models (IMM) to estimate the expected frequency. 11.2 Handling Spatial Anomalies collective anomaly detection in spatial data involves finding subgraphs or subcomponents in the data that are anomalous. A limited amount of research has been done in this category so we will discuss them individually. Hazel [2000] propose a technique to detect regions in an image that are anomalous with respect to rest of the image. The proposed technique makes use of Multivariate Gaussian Random Markov Fields (MGMRF) to segment a given image. The authors make an assumption that each pixel belonging to an anomalous region of the image is also a contextual anomaly within its segment. These pixels are detected as contextual anomalies with respect to the segments (by estimating the conditional probability of each pixel), and then connected using a spatial structure available, to find the collective anomalies. Anomaly detection for graphs has been explored in application domains where the data can be modeled as graphs. Noble and Cook [2003] address two distinct collective anomaly detection problems for graph data. The first problem involves detecting anomalous subgraphs in a given large graph. The authors use a bottomup subgraph enumeration technique and analyze the frequency of a subgraph in the given graph to determine if it is an anomaly or not. The size of the sub-graph is also taken into account, since a large sub-graph (such as the graph itself) is bound to occur very rarely in the graph while a small sub-graph (such as an individual node) will be more frequent. The second problem involves detecting if a given sub-graph is an anomaly with respect to a large graph. The authors measure the regularity or entropy of the sub-graph in the context of the entire graph to determine its anomaly score. 12. RELATIVE STRENGTHS AND WEAKNESSES OF ANOMALY DETECTION TECHNIQUES Each of the large number of anomaly detection techniques discussed in previous sections have their unique strengths and weaknesses. It is important to know which anomaly detection technique is best suited for a given anomaly detection problem. Given the complexity of the problem space, it is not feasible to provide such an To Appear in ACM Computing Surveys, 09 2009.
52
·
Chandola, Banerjee and Kumar
understanding for every anomaly detection problem. In this section we analyze the relative strengths and weakenesses of different categories of techniques for a few simple problem settings.
(a) Data Set 1
(b) Data Set 2
(c) Data Set 3
Fig. 10. 2-D data sets. Normal instances are shown as circles and anomalies are shown as squares.
For example, let us consider the following anomaly detection problem. The input is 2D continuous data (Figure 10(a)). The normal data instances are generated from a Gaussian distribution and are located in a tight cluster in the 2D space. The anomalies are a very few instances generated from another Gaussian distribution whose mean is very far from the first distribution. A representative training data set that contains instances from the normal data set is also available. Thus the assumptions made by techniques in Sections 4–9 hold for this data set, and hence any anomaly detection techniques belonging to these categories will detect the anomalies in such a scenario. Now let us consider another 2D data set (Figure 10(b)). Let the normal instances be such that they are generated by a large number of different Gaussian distributions with means arranged on a circle and very low variance. Thus the normal data will be a set of tight clusters arranged on a circle. A one-class classification based technique might learn a circular boundary around the entire data set and hence will not be able to detect the anomalies that lie within the circle of clusters. On the other hand if each cluster was labeled as a different class, a multi-class classification based technique might be able to learn boundaries around each cluster, and hence be able to detect the anomalies in the center. A statistical technique that uses a mixture model approach to model the data, may be able to detect the anomalies. Similarly, clustering based and nearest neighbor based techniques will be able to detect the anomalies since they are far from all other instances. In a similar example (Figure 10(c)), if the anomalous instances form a tight cluster of significant size at the center of the circle, both clustering based and nearest neighbor based techniques will treat these instances as normal, thus exhibiting poor performance. For more complex data sets, different types of techniques face different challenges. Nearest neighbor and clustering based techniques suffer when the number of dimensions is high because the distance measures in high number of dimensions are not able to differentiate between normal and anomalous instances. Spectral techniques explicitly address high dimensionality problem by mapping data to a lower dimensional projection. But their performance is highly dependent on the assumption that the normal instances and anomalies are distinguishable in the projected space. Classification based techniques can be a better choice in such scenario. But to be To Appear in ACM Computing Surveys, 09 2009.
Anomaly Detection : A Survey
·
53
most effective, classification based techniques require labels for both normal and anomalous instances, which are not often available. Even if the labels for both normal and anomalous instances are available, the imbalance in the distribution of the two labels often makes learning a classifier quite challenging. Semi-supervised nearest neighbor and clustering techniques, that only use the normal labels, can often be more effective than the classification based techniques. Statistical techniques, though unsupervised, are effective only when the dimensionality of data is low and statistical assumptions hold. Information theoretic techniques require a measure that is sensitive enough to detect the effects of even a single anomaly. Otherwise, such techniques can detect anomalies only when there are significantly enough number of anomalies. Nearest neighbor and clustering based techniques require distance computation between a pair of data instances. Thus, such techniques assume that the distance measure can discriminate between the anomalies and normal instances well enough. In situations where identifying a good distance measure is difficult, classification based or statistical techniques might be a better choice. The computational complexity of an anomaly detection technique is a key aspect, especially when the technique is applied to a real domain. While classification based, clustering based, and statistical techniques have expensive training times, testing is usually fast. Often this is acceptable, since models can be trained in an offline fashion while testing is required to be in real time. In contrast, techniques such as nearest neighbor based, information theoretic, and spectral techniques which do not have a training phase, have expensive testing phase which can be a limitation in a real setting. Anomaly detection techniques typically assume that anomalies in data are rare when compared to normal instances. Though this assumption is generally true, anomalies are not always rare. For example, when dealing with worm detection in computer networks, the anomalous (worm) traffic is actually more frequent than the normal traffic. Unsupervised techniques are not suited for such bulk anomaly detection. Techniques operating in supervised or semi-supervised modes can be applied to detect bulk anomalies [Sun et al. 2007; Soule et al. 2005]. 13. CONCLUDING REMARKS AND FUTURE WORK In this survey we have discussed different ways in which the problem of anomaly detection has been formulated in literature, and have attempted to provide an overview of the huge literature on various techniques. For each category of anomaly detection techniques, we have identified a unique assumption regarding the notion of normal and anomalous data. When applying a given technique to a particular domain, these assumptions can be used as guidelines to assess the effectiveness of the technique in that domain. Ideally, a comprehensive survey on anomaly detection should allow a reader to not only understand the motivation behind using a particular anomaly detection technique, but also provide a comparative analysis of various techniques. But the current research has been done in an unstructured fashion, without relying on a unified notion of anomalies, which makes the job of providing a theoretical understanding of the anomaly detection problem very difficult. A possible future work would be to unify the assumptions made by different techniques regarding the normal and anomalous behavior into a statistical or maTo Appear in ACM Computing Surveys, 09 2009.
54
·
Chandola, Banerjee and Kumar
chine learning framework. A limited attempt in this direction is provided by Knorr and Ng [1997], where the authors show the relation between distance based and statistical anomalies for two-dimensional data sets. There are several promising directions for further research in anomaly detection. Contextual and collective anomaly detection techniques are beginning to find increasing applicability in several domains and there is much scope for development of new techniques in this area. The presence of data across different distributed locations has motivated the need for distributed anomaly detection techniques [Zimmermann and Mohay 2006]. While such techniques process information available at multiple sites, they often have to simultaneously protect the information present in each site, thereby requiring privacy preserving anomaly detection techniques [Vaidya and Clifton 2004]. With the emergence of sensor networks, processing data as it arrives has become a necessity. Many techniques discussed in this survey require the entire test data before detecting anomalies. Recently, techniques have been proposed that can operate in an online fashion [Pokrajac et al. 2007]; such techniques not only assign an anomaly score to a test instance as it arrives, but also incrementally update the model. Another upcoming area where anomaly detection is finding more and more applicability is in complex systems. An example of such system would be an aircraft system with multiple components. Anomaly detection in such systems involves modeling the interaction between various components [Bronstein et al. 2001]. ACKNOWLEDGMENTS
The authors thank Shyam Boriah and Gang Fang for extensive comments on the final draft of the paper. This work was supported by NASA under award NNX08AC36A, NSF grant number CNS-0551551, NSF ITR Grant ACI-0325949, NSF IIS-0713227 and NSF Grant IIS-0308264. Access to computing facilities was provided by the Digital Technology Consortium. REFERENCES Abe, N., Zadrozny, B., and Langford, J. 2006. Outlier detection by active learning. In Proceedings of the 12th ACM SIGKDD International Conference on Knowledge Discovery and Data Mining. ACM Press, New York, NY, USA, 504–509. Abraham, B. and Box, G. E. P. 1979. Bayesian analysis of some outlier problems in time series. Biometrika 66, 2, 229–236. Abraham, B. and Chuang, A. 1989. Outlier detection and time series modeling. Technometrics 31, 2, 241–248. Addison, J., Wermter, S., and MacIntyre, J. 1999. Effectiveness of feature extraction in neural network architectures for novelty detection. In Proceedings of the 9th International Conference on Artificial Neural Networks. Vol. 2. 976–981. Aeyels, D. 1991. On the dynamic behaviour of the novelty detector and the novelty filter. In Analysis of Controlled Dynamical Systems- Progress in Systems and Control Theory, B. Bonnard, B. Bride, J. Gauthier, and I. Kupka, Eds. Vol. 8. Springer, Berlin, 1–10. Agarwal, D. 2005. An empirical bayes approach to detect anomalies in dynamic multidimensional arrays. In Proceedings of the 5th IEEE International Conference on Data Mining. IEEE Computer Society, Washington, DC, USA, 26–33. Agarwal, D. 2006. Detecting anomalies in cross-classified streams: a bayesian approach. Knowledge and Information Systems 11, 1, 29–44. To Appear in ACM Computing Surveys, 09 2009.
Anomaly Detection : A Survey
·
55
Aggarwal, C. 2005. On abnormality detection in spuriously populated data streams. In Proceedings of 5th SIAM Data Mining. 80–91. Aggarwal, C. and Yu, P. 2001. Outlier detection for high dimensional data. In Proceedings of the ACM SIGMOD International Conference on Management of Data. ACM Press, 37–46. Aggarwal, C. C. and Yu, P. S. 2008. Outlier detection with uncertain data. In SDM. 483–493. Agovic, A., Banerjee, A., Ganguly, A. R., and Protopopescu, V. 2007. Anomaly detection in transportation corridors using manifold embedding. In First International Workshop on Knowledge Discovery from Sensor Data. ACM Press. Agrawal, R. and Srikant, R. 1995. Mining sequential patterns. In Proceedings of the 11th International Conference on Data Engineering. IEEE Computer Society, Washington, DC, USA, 3–14. Agyemang, M., Barker, K., and Alhajj, R. 2006. A comprehensive survey of numeric and symbolic outlier mining techniques. Intelligent Data Analysis 10, 6, 521–538. Albrecht, S., Busch, J., Kloppenburg, M., Metze, F., and Tavan, P. 2000. Generalized radial basis function networks for classification and novelty detection: self-organization of optional bayesian decision. Neural Networks 13, 10, 1075–1093. Aleskerov, E., Freisleben, B., and Rao, B. 1997. Cardwatch: A neural network based database mining system for credit card fraud detection. In Proceedings of IEEE Computational Intelligence for Financial Engineering. 220–226. Allan, J., Carbonell, J., Doddington, G., Yamron, J., and Yang, Y. 1998. Topic detection and tracking pilot study. In Proceedings of DARPA Broadcast News Transcription and Understanding Workshop. 194–218. Anderson, Lunt, Javitz, Tamaru, A., and Valdes, A. 1995. Detecting unusual program behavior using the statistical components of NIDES. Tech. Rep. SRI–CSL–95–06, Computer Science Laboratory, SRI International. may. Anderson, D., Frivold, T., Tamaru, A., and Valdes, A. 1994. Next-generation intrusion detection expert system (nides), software users manual, beta-update release. Tech. Rep. SRI– CSL–95–07, Computer Science Laboratory, SRI International. may. Ando, S. 2007. Clustering needles in a haystack: An information theoretic analysis of minority and outlier detection. In Proceedings of 7th International Conference on Data Mining. 13–22. Angiulli, F. and Pizzuti, C. 2002. Fast outlier detection in high dimensional spaces. In Proceedings of the 6th European Conference on Principles of Data Mining and Knowledge Discovery. Springer-Verlag, 15–26. Anscombe, F. J. and Guttman, I. 1960. Rejection of outliers. Technometrics 2, 2, 123–147. Arning, A., Agrawal, R., and Raghavan, P. 1996. A linear method for deviation detection in large databases. In Proceedings of 2nd International Conference of Knowledge Discovery and Data Mining. 164–169. Augusteijn, M. and Folkert, B. 2002. Neural network classification and novelty detection. International Journal on Remote Sensing 23, 14, 2891–2902. Bakar, Z., Mohemad, R., Ahmad, A., and Deris, M. 2006. A comparative study for outlier detection techniques in data mining. Cybernetics and Intelligent Systems, 2006 IEEE Conference on, 1–6. Baker, D., Hofmann, T., McCallum, A., and Yang, Y. 1999. A hierarchical probabilistic model for novelty detection in text. In Proceedings of International Conference on Machine Learning. Barbara, D., Couto, J., Jajodia, S., and Wu, N. 2001a. Adam: a testbed for exploring the use of data mining in intrusion detection. SIGMOD Rec. 30, 4, 15–24. Barbara, D., Couto, J., Jajodia, S., and Wu, N. 2001b. Detecting novel network intrusions using bayes estimators. In Proceedings of the First SIAM International Conference on Data Mining. Barbara, D., Li, Y., Couto, J., Lin, J.-L., and Jajodia, S. 2003. Bootstrapping a data mining intrusion detection system. In Proceedings of the 2003 ACM symposium on Applied computing. ACM Press, 421–425. To Appear in ACM Computing Surveys, 09 2009.
56
·
Chandola, Banerjee and Kumar
Barnett, V. 1976. The ordering of multivariate data (with discussion). Journal of the Royal Statistical Society. Series A 139, 318–354. Barnett, V. and Lewis, T. 1994. Outliers in statistical data. John Wiley and sons. Barson, P., Davey, N., Field, S. D. H., Frank, R. J., and McAskie, G. 1996. The detection of fraud in mobile phone networks. Neural Network World 6, 4. Basu, S., Bilenko, M., and Mooney, R. J. 2004. A probabilistic framework for semi-supervised clustering. In Proceedings of the tenth ACM SIGKDD international conference on Knowledge discovery and data mining. ACM Press, New York, NY, USA, 59–68. Basu, S. and Meckesheimer, M. 2007. Automatic outlier detection for time series: an application to sensor data. Knowledge and Information Systems 11, 2 (February), 137–154. Bay, S. D. and Schwabacher, M. 2003. Mining distance-based outliers in near linear time with randomization and a simple pruning rule. In Proceedings of the ninth ACM SIGKDD international conference on Knowledge discovery and data mining. ACM Press, 29–38. Beckman, R. J. and Cook, R. D. 1983. Outlier...s. Technometrics 25, 2, 119–149. Bejerano, G. and Yona, G. 2001. Variations on probabilistic suffix trees: statistical modeling and prediction of protein families . Bioinformatics 17, 1, 23–43. Bentley, J. L. 1975. Multidimensional binary search trees used for associative searching. Communications of the ACM 18, 9, 509–517. Bianco, A. M., Ben, M. G., Martinez, E. J., and Yohai, V. J. 2001. Outlier detection in regression models with arima errors using robust estimates. Journal of Forecasting 20, 8, 565–579. Bishop, C. 1994. Novelty detection and neural network validation. In Proceedings of IEEE Vision, Image and Signal Processing. Vol. 141. 217–222. Blender, R., Fraedrich, K., and Lunkeit, F. 1997. Identification of cyclone-track regimes in the north atlantic. Quarterly Journal of the Royal Meteorological Society 123, 539, 727–741. Bolton, R. and Hand, D. 1999. Unsupervised profiling methods for fraud detection. In Credit Scoring and Credit Control VII. Boriah, S., Chandola, V., and Kumar, V. 2008. Similarity measures for categorical data: A comparative evaluation. In Proceedings of the eighth SIAM International Conference on Data Mining. 243–254. Borisyuk, R., Denham, M., Hoppensteadt, F., Kazanovich, Y., and Vinogradova, O. 2000. An oscillatory neural network model of sparse distributed memory and novelty detection. Biosystems 58, 265–272. Box, G. E. P. and Tiao, G. C. 1968. Bayesian analysis of some outlier problems. Biometrika 55, 1, 119–129. Branch, J., Szymanski, B., Giannella, C., Wolff, R., and Kargupta, H. 2006. In-network outlier detection in wireless sensor networks. In 26th IEEE International Conference on Distributed Computing Systems. Brause, R., Langsdorf, T., and Hepp, M. 1999. Neural data mining for credit card fraud detection. In Proceedings of IEEE International Conference on Tools with Artificial Intelligence. 103–106. Breunig, M. M., Kriegel, H.-P., Ng, R. T., and Sander, J. 1999. Optics-of: Identifying local outliers. In Proceedings of the Third European Conference on Principles of Data Mining and Knowledge Discovery. Springer-Verlag, 262–270. Breunig, M. M., Kriegel, H.-P., Ng, R. T., and Sander, J. 2000. Lof: identifying density-based local outliers. In Proceedings of 2000 ACM SIGMOD International Conference on Management of Data. ACM Press, 93–104. Brito, M. R., Chavez, E. L., Quiroz, A. J., and Yukich, J. E. 1997. Connectivity of the mutual k-nearest-neighbor graph in clustering and outlier detection. Statistics and Probability Letters 35, 1, 33–42. Brockett, P. L., Xia, X., and Derrig, R. A. 1998. Using kohonen’s self-organizing feature map to uncover automobile bodily injury claims fraud. Journal of Risk and Insurance 65, 2 (June), 245–274. To Appear in ACM Computing Surveys, 09 2009.
Anomaly Detection : A Survey
·
57
Bronstein, A., Das, J., Duro, M., Friedrich, R., Kleyner, G., Mueller, M., Singhal, S., and Cohen, I. 2001. Bayesian networks for detecting anomalies in internet-based services. In International Symposium on Integrated Network Management,. Brotherton, T. and Johnson, T. 2001. Anomaly detection for advance military aircraft using neural networks. In Proceedings of 2001 IEEE Aerospace Conference. Brotherton, T., Johnson, T., and Chadderdon, G. 1998. Classification and novelty detection using linear models and a class dependent– elliptical basis function neural network. In Proceedings of the IJCNN Conference. Anchorage AL. Bu, Y., Leung, T.-W., Fu, A., Keogh, E., Pei, J., and Meshkin, S. 2007. Wat: Finding top-k discords in time series database. In Proceedings of 7th SIAM International Conference on Data Mining. Budalakoti, S., Srivastava, A., Akella, R., and Turkov, E. 2006. Anomaly detection in large sets of high-dimensional symbol sequences. Tech. Rep. NASA TM-2006-214553, NASA Ames Research Center. Byers, S. D. and Raftery, A. E. 1998. Nearest neighbor clutter removal for estimating features in spatial point processes. Journal of the American Statistical Association 93, 577–584. Byungho, H. and Sungzoon, C. 1999. Characteristics of autoassociative mlp as a novelty detector. In Proceedings of IEEE International Joint Conference on Neural Networks. Vol. 5. 3086–3091. Cabrera, J. B. D., Lewis, L., and Mehra, R. K. 2001. Detection and classification of intrusions and faults using sequences of system calls. SIGMOD Records 30, 4, 25–34. Cadez, I., Heckerman, D., Meek, C., Smyth, P., and White, S. 2000. Visualization of navigation patterns on a web site using model-based clustering. In Proceedings of the sixth ACM SIGKDD international conference on Knowledge discovery and data mining. ACM Press, New York, NY, USA, 280–284. Campbell, C. and Bennett, K. 2001. A linear programming approach to novelty detection. In Proceedings of Advances in Neural Information Processing. Vol. 14. Cambridge Press. Caudell, T. and Newman, D. 1993. An adaptive resonance architecture to define normality and detect novelties in time series and databases. In IEEE World Congress on Neural Networks. IEEE, Portland, OR, 166–176. Chakrabarti, S., Sarawagi, S., and Dom, B. 1998. Mining surprising patterns using temporal description length. In Proceedings of the 24rd International Conference on Very Large Data Bases. Morgan Kaufmann Publishers Inc., San Francisco, CA, USA, 606–617. Chan, P. K. and Mahoney, M. V. 2005. Modeling multiple time series for anomaly detection. In Proceedings of the Fifth IEEE International Conference on Data Mining. IEEE Computer Society, Washington, DC, USA, 90–97. Chandola, V., Boriah, S., and Kumar, V. 2008. Understanding categorical similarity measures for outlier detection. Tech. Rep. 08-008, University of Minnesota. Mar. Chandola, V., Eilertson, E., Ertoz, L., Simon, G., and Kumar, V. 2006. Data mining for cyber security. In Data Warehousing and Data Mining Techniques for Computer Security, A. Singhal, Ed. Springer. Chatzigiannakis, V., Papavassiliou, S., Grammatikou, M., and Maglaris, B. 2006. Hierarchical anomaly detection in distributed large-scale sensor networks. In ISCC ’06: Proceedings of the 11th IEEE Symposium on Computers and Communications. IEEE Computer Society, Washington, DC, USA, 761–767. Chaudhary, A., Szalay, A. S., and Moore, A. W. 2002. Very fast outlier detection in large multidimensional data sets. In Proceedings of ACM SIGMOD Workshop in Research Issues in Data Mining and Knowledge Discovery (DMKD). ACM Press. Chawla, N. V., Japkowicz, N., and Kotcz, A. 2004. Editorial: special issue on learning from imbalanced data sets. SIGKDD Explorations 6, 1, 1–6. Chen, D., Shao, X., Hu, B., and Su, Q. 2005. Simultaneous wavelength selection and outlier detection in multivariate regression of near-infrared spectra. Analytical Sciences 21, 2, 161–167. Chiu, A. and chee Fu, A. W. 2003. Enhancements on local outlier detection. In Proceedings of 7th International Database Engineering and Applications Symposium. 298–307. To Appear in ACM Computing Surveys, 09 2009.
58
·
Chandola, Banerjee and Kumar
Chow, C. and Yeung, D.-Y. 2002. Parzen-window network intrusion detectors. In Proceedings of the 16th International Conference on Pattern Recognition. Vol. 4. IEEE Computer Society, Washington, DC, USA, 40385. Cox, K. C., Eick, S. G., Wills, G. J., and Brachman, R. J. 1997. Visual data mining: Recognizing telephone calling fraud. Journal of Data Mining and Knowledge Discovery 1, 2, 225–231. Crook, P. and Hayes, G. 2001. A robot implementation of a biologically inspired method for novelty detection. In Proceedings of Towards Intelligent Mobile Robots Conference. Manchester, UK. Crook, P. A., Marsland, S., Hayes, G., and Nehmzow, U. 2002. A tale of two filters - on-line novelty detection. In Proceedings of International Conference on Robotics and Automation. 3894–3899. Cun, Y. L., Boser, B., Denker, J. S., Howard, R. E., Habbard, W., Jackel, L. D., and Henderson, D. 1990. Handwritten digit recognition with a back-propagation network. Advances in neural information processing systems, 396–404. Das, K. and Schneider, J. 2007. Detecting anomalous records in categorical datasets. In Proceedings of the 13th ACM SIGKDD international conference on Knowledge discovery and data mining. ACM Press. Dasgupta, D. and Majumdar, N. 2002. Anomaly detection in multidimensional data using negative selection algorithm. In Proceedings of the IEEE Conference on Evolutionary Computation. Hawaii, 1039–1044. Dasgupta, D. and Nino, F. 2000. A comparison of negative and positive selection algorithms in novel pattern detection. In Proceedings of the IEEE International Conference on Systems, Man, and Cybernetics. Vol. 1. Nashville, TN, 125–130. Davy, M. and Godsill, S. 2002. Detection of abrupt spectral changes using support vector machines. an application to audio signal segmentation. In Proceedings of IEEE International Conference on Acoustics, Speech, and Signal Processing. Orlando, USA. Debar, H., Dacier, M., Nassehi, M., and Wespi, A. 1998. Fixed vs. variable-length patterns for detecting suspicious process behavior. In Proceedings of the 5th European Symposium on Research in Computer Security. Springer-Verlag, London, UK, 1–15. Denning, D. E. 1987. An intrusion detection model. IEEE Transactions of Software Engineering 13, 2, 222–232. Desforges, M., Jacob, P., and Cooper, J. 1998. Applications of probability density estimation to the detection of abnormal conditions in engineering. In Proceedings of Institute of Mechanical Engineers. Vol. 212. 687–703. Diaz, I. and Hollmen, J. 2002. Residual generation and visualization for understanding novel process conditions. In Proceedings of IEEE International Joint Conference on Neural Networks. IEEE, Honolulu, HI, 2070–2075. Diehl, C. and Hampshire, J. 2002. Real-time object classification and novelty detection for collaborative video surveillance. In Proceedings of IEEE International Joint Conference on Neural Networks. IEEE, Honolulu, HI. Donoho, S. 2004. Early detection of insider trading in option markets. In Proceedings of the tenth ACM SIGKDD international conference on Knowledge discovery and data mining. ACM Press, New York, NY, USA, 420–429. Dorronsoro, J. R., Ginel, F., Sanchez, C., and Cruz, C. S. 1997. Neural fraud detection in credit card operations. IEEE Transactions On Neural Networks 8, 4 (July), 827–834. Du, W., Fang, L., and Peng, N. 2006. Lad: localization anomaly detection for wireless sensor networks. J. Parallel Distrib. Comput. 66, 7, 874–886. Duda, R. O., Hart, P. E., and Stork, D. G. 2000. Pattern Classification (2nd Edition). WileyInterscience. Dutta, H., Giannella, C., Borne, K., and Kargupta, H. 2007. Distributed top-k outlier detection in astronomy catalogs using the demac system. In Proceedings of 7th SIAM International Conference on Data Mining. Edgeworth, F. Y. 1887. On discordant observations. Philosophical Magazine 23, 5, 364–375. To Appear in ACM Computing Surveys, 09 2009.
Anomaly Detection : A Survey
·
59
Emamian, V., Kaveh, M., and Tewfik, A. 2000. Robust clustering of acoustic emission signals using the kohonen network. In Proceedings of the IEEE International Conference of Acoustics, Speech and Signal Processing. IEEE Computer Society. Endler, D. 1998. Intrusion detection: Applying machine learning to solaris audit data. In Proceedings of the 14th Annual Computer Security Applications Conference. IEEE Computer Society, 268. Ertoz, L., Eilertson, E., Lazarevic, A., Tan, P.-N., Kumar, V., Srivastava, J., and Dokas, P. 2004. MINDS - Minnesota Intrusion Detection System. In Data Mining - Next Generation Challenges and Future Directions. MIT Press. ¨ z, L., Steinbach, M., and Kumar, V. 2003. Finding topics in collections of documents: A Erto shared nearest neighbor approach. In Clustering and Information Retrieval. 83–104. Escalante, H. J. 2005. A comparison of outlier detection algorithms for machine learning. In Proceedings of the International Conference on Communications in Computing. Eskin, E. 2000. Anomaly detection over noisy data using learned probability distributions. In Proceedings of the Seventeenth International Conference on Machine Learning. Morgan Kaufmann Publishers Inc., 255–262. Eskin, E., Arnold, A., Prerau, M., Portnoy, L., and Stolfo, S. 2002. A geometric framework for unsupervised anomaly detection. In Proceedings of Applications of Data Mining in Computer Security. Kluwer Academics, 78–100. Eskin, E., Lee, W., and Stolfo, S. 2001. Modeling system call for intrusion detection using dynamic window sizes. In Proceedings of DISCEX. Ester, M., Kriegel, H.-P., Sander, J., and Xu, X. 1996. A density-based algorithm for discovering clusters in large spatial databases with noise. In Proceedings of Second International Conference on Knowledge Discovery and Data Mining, E. Simoudis, J. Han, and U. Fayyad, Eds. AAAI Press, Portland, Oregon, 226–231. Fan, W., Miller, M., Stolfo, S. J., Lee, W., and Chan, P. K. 2001. Using artificial anomalies to detect unknown and known network intrusions. In Proceedings of the 2001 IEEE International Conference on Data Mining. IEEE Computer Society, 123–130. Fawcett, T. and Provost, F. 1999. Activity monitoring: noticing interesting changes in behavior. In Proceedings of the 5th ACM SIGKDD International Conference on Knowledge Discovery and Data Mining. ACM Press, 53–62. Forrest, S., D’haeseleer, P., and Helman, P. 1996. An immunological approach to change detection: Algorithms, analysis and implications. In Proceedings of the 1996 IEEE Symposium on Security and Privacy. IEEE Computer Society, 110. Forrest, S., Esponda, F., and Helman, P. 2004. A formal framework for positive and negative detection schemes. In IEEE Transactions on Systems, Man and Cybernetics, Part B. IEEE, 357–373. Forrest, S., Hofmeyr, S. A., Somayaji, A., and Longstaff, T. A. 1996. A sense of self for unix processes. In Proceedinges of the ISRSP96. 120–128. Forrest, S., Perelson, A. S., Allen, L., and Cherukuri, R. 1994. Self-nonself discrimination in a computer. In Proceedings of the 1994 IEEE Symposium on Security and Privacy. IEEE Computer Society, Washington, DC, USA, 202. Forrest, S., Warrender, C., and Pearlmutter, B. 1999. Detecting intrusions using system calls: Alternate data models. In Proceedings of the 1999 IEEE ISRSP. IEEE Computer Society, Washington, DC, USA, 133–145. Fox, A. J. 1972. Outliers in time series. Journal of the Royal Statistical Society. Series B(Methodological) 34, 3, 350–363. Fu, A. W.-C., Leung, O. T.-W., Keogh, E. J., and Lin, J. 2006. Finding time series discords based on haar transform. In Proceeding of the 2nd International Conference on Advanced Data Mining and Applications. Springer Verlag, 31–41. Fujimaki, R., Yairi, T., and Machida, K. 2005. An approach to spacecraft anomaly detection problem using kernel feature space. In Proceeding of the eleventh ACM SIGKDD international conference on Knowledge discovery in data mining. ACM Press, New York, NY, USA, 401–410. To Appear in ACM Computing Surveys, 09 2009.
60
·
Chandola, Banerjee and Kumar
Galeano, P., Pea, D., and Tsay, R. S. 2004. Outlier detection in multivariate time series via projection pursuit. Statistics and Econometrics Working Papers ws044211, Universidad Carlos III, Departamento de Estad¨ıstica y Econometr¨ıca. Sep. Ghosh, A. K., Schwartzbard, A., and Schatz, M. 1999a. Learning program behavior profiles for intrusion detection. In Proceedings of 1st USENIX Workshop on Intrusion Detection and Network Monitoring. 51–62. Ghosh, A. K., Schwartzbard, A., and Schatz, M. 1999b. Using program behavior profiles for intrusion detection. In Proceedings of SANS Third Conference and Workshop on Intrusion Detection and Response. Ghosh, A. K., Wanken, J., and Charron, F. 1998. Detecting anomalous and unknown intrusions against programs. In Proceedings of the 14th Annual Computer Security Applications Conference. IEEE Computer Society, 259. Ghosh, S. and Reilly, D. L. 1994. Credit card fraud detection with a neural-network. In Proceedings of the 27th Annual Hawaii International Conference on System Science. Vol. 3. Los Alamitos, CA. Ghoting, A., Parthasarathy, S., and Otey, M. 2006. Fast mining of distance-based outliers in high dimensional datasets. In Proceedings of the SIAM International Conference on Data Mining. Gibbons, R. D. 1994. Statistical Methods for Groundwater Monitoring. John Wiley & Sons, Inc. Goldberger, A. L., Amaral, L. A. N., Glass, L., Hausdorff, J. M., Ivanov, P. C., Mark, R. G., Mietus, J. E., Moody, G. B., Peng, C.-K., and Stanley, H. E. 2000. PhysioBank, PhysioToolkit, and PhysioNet: Components of a new research resource for complex physiologic signals. Circulation 101, 23, e215–e220. Circulation Electronic Pages: http://circ.ahajournals.org/cgi/content/full/101/23/e215. Gonzalez, F. A. and Dasgupta, D. 2003. Anomaly detection using real-valued negative selection. Genetic Programming and Evolvable Machines 4, 4, 383–403. Grubbs, F. 1969. Procedures for detecting outlying observations in samples. Technometrics 11, 1, 1–21. Guha, S., Rastogi, R., and Shim, K. 2000. ROCK: A robust clustering algorithm for categorical attributes. Information Systems 25, 5, 345–366. Gunter, S., Schraudolph, N. N., and Vishwanathan, S. V. N. 2007. Fast iterative kernel principal component analysis. J. Mach. Learn. Res. 8, 1893–1918. Gusfield, D. 1997. Algorithms on strings, trees, and sequences: computer science and computational biology. Cambridge University Press, New York, NY, USA. Guttormsson, S., II, R. M., and El-Sharkawi, M. 1999. Elliptical novelty grouping for on-line short-turn detection of excited running rotors. IEEE Transactions on Energy Conversion 14, 1 (March). Gwadera, R., Atallah, M. J., and Szpankowski, W. 2004. Detection of significant sets of episodes in event sequences. In Proceedings of the Fourth IEEE International Conference on Data Mining. IEEE Computer Society, Washington, DC, USA, 3–10. Gwadera, R., Atallah, M. J., and Szpankowski, W. 2005a. Markov models for identification of significant episodes. In Proceedings of 5th SIAM International Conference on Data Mining. Gwadera, R., Atallah, M. J., and Szpankowski, W. 2005b. Reliable detection of episodes in event sequences. Knowledge and Information Systems 7, 4, 415–437. Harris, T. 1993. Neural network in machine health monitoring. Professional Engineering. Hartigan, J. A. and Wong, M. A. 1979. A k-means clustering algorithm. Applied Statistics 28, 100–108. Hautamaki, V., Karkkainen, I., and Franti, P. 2004. Outlier detection using k-nearest neighbour graph. In Proceedings of 17th International Conference on Pattern Recognition. Vol. 3. IEEE Computer Society, Washington, DC, USA, 430–433. Hawkins, D. 1980. Identification of outliers. Monographs on Applied Probability and Statistics. Hawkins, D. M. 1974. The detection of errors in multivariate data using principal components. Journal of the American Statistical Association 69, 346 (june), 340–344. To Appear in ACM Computing Surveys, 09 2009.
Anomaly Detection : A Survey
·
61
Hawkins, S., He, H., Williams, G. J., and Baxter, R. A. 2002. Outlier detection using replicator neural networks. In Proceedings of the 4th International Conference on Data Warehousing and Knowledge Discovery. Springer-Verlag, 170–180. Hazel, G. G. 2000. Multivariate gaussian mrf for multispectral scene segmentation and anomaly detection. GeoRS 38, 3 (May), 1199–1211. He, H., Wang, J., Graco, W., and Hawkins, S. 1997. Application of neural networks to detection of medical fraud. Expert Systems with Applications 13, 4, 329–336. He, Z., Deng, S., and Xu, X. 2002. Outlier detection integrating semantic knowledge. In Proceedings of the Third International Conference on Advances in Web-Age Information Management. Springer-Verlag, London, UK, 126–131. He, Z., Deng, S., Xu, X., and Huang, J. Z. 2006. A fast greedy algorithm for outlier mining. In Proceedings of 10th Pacific-Asia Conference on Knowledge and Data Discovery. 567–576. He, Z., Xu, X., and Deng, S. 2003. Discovering cluster-based local outliers. Pattern Recognition Letters 24, 9-10, 1641–1650. He, Z., Xu, X., and Deng, S. 2005. An optimization model for outlier detection in categorical data. In Proceedings of International Conference on Intelligent Computing. Vol. 3644. Springer. He, Z., Xu, X., Huang, J. Z., and Deng, S. 2004a. A frequent pattern discovery method for outlier detection. 726–732. He, Z., Xu, X., Huang, J. Z., and Deng, S. 2004b. Mining class outliers: Concepts, algorithms and applications. 588–589. Heller, K. A., Svore, K. M., Keromytis, A. D., and Stolfo, S. J. 2003. One class support vector machines for detecting anomalous windows registry accesses. In Proceedings of the Workshop on Data Mining for Computer Security. Helman, P. and Bhangoo, J. 1997. A statistically based system for prioritizing information exploration under uncertainty. In IEEE International Conference on Systems, Man, and Cybernetics. Vol. 27. IEEE, 449–466. Helmer, G., Wong, J., Honavar, V., and Miller, L. 1998. Intelligent agents for intrusion detection. In Proceedings of IEEE Information Technology Conference. 121–124. Hickinbotham, S. J. and Austin, J. 2000a. Novelty detection in airframe strain data. In Proceedings of 15th International Conference on Pattern Recognition. Vol. 2. 536–539. Hickinbotham, S. J. and Austin, J. 2000b. Novelty detection in airframe strain data. In Proceedings of the IEEE-INNS-ENNS International Joint Conference on Neural Networks. Vol. 6. 24–27. Ho, L. L., Macey, C. J., and Hiller, R. 1999. A distributed and reliable platform for adaptive anomaly detection in ip networks. In Proceedings of the 10th IFIP/IEEE International Workshop on Distributed Systems: Operations and Management. Springer-Verlag, London, UK, 33–46. Ho, T. V. and Rouat, J. 1997. A novelty detector using a network of integrate and fire neurons. Lecture Notes in Computer Science 1327, 103–108. Ho, T. V. and Rouat, J. 1998. Novelty detection based on relaxation time of a network of integrate-and-fire neurons. In Proceedings of Second IEEE World Congress on Computational Intelligence. Anchorage, AK, 1524–1529. Hodge, V. and Austin, J. 2004. A survey of outlier detection methodologies. Artificial Intelligence Review 22, 2, 85–126. Hofmeyr, S. A., Forrest, S., and Somayaji, A. 1998. Intrusion detection using sequences of system calls. Journal of Computer Security 6, 3, 151–180. Hollier, G. and Austin, J. 2002. Novelty detection for strain-gauge degradation using maximally correlated components. In Proceedings of the European Symposium on Artificial Neural Networks. 257–262–539. Hollmen, J. and Tresp, V. 1999. Call-based fraud detection in mobile communication networks using a hierarchical regime-switching model. In Proceedings of the 1998 conference on Advances in neural information processing systems II. MIT Press, Cambridge, MA, USA, 889–895. Horn, P. S., Feng, L., Li, Y., and Pesce, A. J. 2001. Effect of outliers and nonhealthy individuals on reference interval estimation. Clinical Chemistry 47, 12, 2137–2145. To Appear in ACM Computing Surveys, 09 2009.
62
·
Chandola, Banerjee and Kumar
Hu, W., Liao, Y., and Vemuri, V. R. 2003. Robust anomaly detection using support vector machines. In Proceedings of the International Conference on Machine Learning. Morgan Kaufmann Publishers Inc., San Francisco, CA, USA, 282–289. Huber, P. 1974. Robust Statistics. Wiley, New York. Huber, P. J. 1985. Projection pursuit (with discussions). The Annals of Statistics 13, 2 (June), 435–475. Ide, T. and Kashima, H. 2004. Eigenspace-based anomaly detection in computer systems. In Proceedings of the 10th ACM SIGKDD international conference on Knowledge discovery and data mining. ACM Press, New York, NY, USA, 440–449. ´, T., Papadimitriou, S., and Vlachos, M. 2007. Computing correlation anomaly scores Ide using stochastic nearest neighbors. In Proceedings of International Conference Data Mining. 523–528. Ihler, A., Hutchins, J., and Smyth, P. 2006. Adaptive event detection with time-varying poisson processes. In Proceedings of the 12th ACM SIGKDD international conference on Knowledge discovery and data mining. ACM Press, New York, NY, USA, 207–216. Ilgun, K., Kemmerer, R. A., and Porras, P. A. 1995. State transition analysis: A rule-based intrusion detection approach. IEEE Transactions on Software Engineering 21, 3, 181–199. Jagadish, H. V., Koudas, N., and Muthukrishnan, S. 1999. Mining deviants in a time series database. In Proceedings of the 25th International Conference on Very Large Data Bases. Morgan Kaufmann Publishers Inc., 102–113. Jagota, A. 1991. Novelty detection on a very large number of memories stored in a hopfield-style network. In Proceedings of the International Joint Conference on Neural Networks. Vol. 2. Seattle, WA, 905. Jain, A. K. and Dubes, R. C. 1988. Algorithms for Clustering Data. Prentice-Hall, Inc. Jakubek, S. and Strasser, T. 2002. Fault-diagnosis using neural networks with ellipsoidal basis functions. In Proceedings of the American Control Conference. Vol. 5. 3846–3851. Janakiram, D., Reddy, V., and Kumar, A. 2006. Outlier detection in wireless sensor networks using bayesian belief networks. In First International Conference on Communication System Software and Middleware. 1–6. Japkowicz, N., Myers, C., and Gluck, M. A. 1995. A novelty detection approach to classification. In Proceedings of International Joint Conference on Artificial Intelligence. 518–523. Javitz, H. S. and Valdes, A. 1991. The sri ides statistical anomaly detector. In Proceedings of the 1991 IEEE Symposium on Research in Security and Privacy. IEEE Computer Society. Jiang, M. F., Tseng, S. S., and Su, C. M. 2001. Two-phase clustering process for outliers detection. Pattern Recognition Letters 22, 6-7, 691–700. Jin, W., Tung, A. K. H., and Han, J. 2001. Mining top-n local outliers in large databases. In Proceedings of the seventh ACM SIGKDD international conference on Knowledge discovery and data mining. ACM Press, 293–298. Joachims, T. 2006. Training linear svms in linear time. In KDD ’06: Proceedings of the 12th ACM SIGKDD international conference on Knowledge discovery and data mining. ACM, New York, NY, USA, 217–226. Jolliffe, I. T. 2002. Principal Component Analysis, 2nd ed. Springer. Joshi, M. V., Agarwal, R. C., and Kumar, V. 2001. Mining needle in a haystack: classifying rare classes via two-phase rule induction. In Proceedings of the 2001 ACM SIGMOD international conference on Management of data. ACM Press, New York, NY, USA, 91–102. Joshi, M. V., Agarwal, R. C., and Kumar, V. 2002. Predicting rare classes: can boosting make any weak learner strong? In Proceedings of the eighth ACM SIGKDD international conference on Knowledge discovery and data mining. ACM, New York, NY, USA, 297–306. Kadota, K., Tominaga, D., Akiyama, Y., and Takahashi, K. 2003. Detecting outlying samples in microarray data: A critical assessment of the effect of outliers on sample classification. ChemBio Informatics 3, 1, 30–45. Karypis, G. and Kumar, V. 1998. Multilevel k-way partitioning scheme for irregular graphs. Journal of Parallel and Distributed Computing 48, 1, 96–129. To Appear in ACM Computing Surveys, 09 2009.
Anomaly Detection : A Survey
·
63
Kearns, M. J. 1990. Computational Complexity of Machine Learning. MIT Press, Cambridge, MA, USA. Kejia Zhang, Shengfei Shi, H. G. and Li, J. 2007. Unsupervised outlier detection in sensor networks using aggregation tree. Advanced Data Mining and Applications 4632, 158–169. Keogh, E., Lin, J., and Fu, A. 2005. Hot sax: Efficiently finding the most unusual time series subsequence. In Proceedings of the Fifth IEEE International Conference on Data Mining. IEEE Computer Society, Washington, DC, USA, 226–233. Keogh, E., Lin, J., Lee, S.-H., and Herle, H. V. 2006. Finding the most unusual time series subsequence: algorithms and applications. Knowledge and Information Systems 11, 1, 1–27. Keogh, E., Lonardi, S., and chi’ Chiu, B. Y. 2002. Finding surprising patterns in a time series database in linear time and space. In Proceedings of the eighth ACM SIGKDD international conference on Knowledge discovery and data mining. ACM Press, New York, NY, USA, 550– 556. Keogh, E., Lonardi, S., and Ratanamahatana, C. A. 2004. Towards parameter-free data mining. In Proceedings of the 10th ACM SIGKDD international conference on Knowledge discovery and data mining. ACM Press, New York, NY, USA, 206–215. Keogh, E. and Smyth, P. 1997. A probabilistic approach to fast pattern matching in time series databases. In Proceedings of Third International Conference on Knowledge Discovery and Data Mining, D. Heckerman, H. Mannila, D. Pregibon, and R. Uthurusamy, Eds. AAAI Press, Menlo Park, California., Newport Beach, CA, USA, 24–30. King, S., King, D., P. Anuzis, K. A., Tarassenko, L., Hayton, P., and Utete, S. 2002. The use of novelty detection techniques for monitoring high-integrity plant. In Proceedings of the 2002 International Conference on Control Applications. Vol. 1. Cancun, Mexico, 221–226. Kitagawa, G. 1979. On the use of aic for the detection of outliers. Technometrics 21, 2 (may), 193–199. Knorr, E. M. and Ng, R. T. 1997. A unified approach for mining outliers. In Proceedings of the 1997 conference of the Centre for Advanced Studies on Collaborative research. IBM Press, 11. Knorr, E. M. and Ng, R. T. 1998. Algorithms for mining distance-based outliers in large datasets. In Proceedings of the 24rd International Conference on Very Large Data Bases. Morgan Kaufmann Publishers Inc., 392–403. Knorr, E. M. and Ng, R. T. 1999. Finding intensional knowledge of distance-based outliers. In The VLDB Journal. 211–222. Knorr, E. M., Ng, R. T., and Tucakov, V. 2000. Distance-based outliers: algorithms and applications. The VLDB Journal 8, 3-4, 237–253. Ko, H. and Jacyna, G. 2000. Dynamical behavior of autoassociative memory performing novelty filtering. In IEEE Transactions on Neural Networks. Vol. 11. 1152–1161. Kohonen, T., Ed. 1997. Self-organizing maps. Springer-Verlag New York, Inc., Secaucus, NJ, USA. Kojima, K. and Ito, K. 1999. Autonomous learning of novel patterns by utilizing chaotic dynamics. In IEEE International Conference on Systems, Man, and Cybernetics. Vol. 1. IEEE, Tokyo, Japan, 284–289. Kosoresow, A. P. and Hofmeyr, S. A. 1997. Intrusion detection via system call traces. IEEE Software 14, 5, 35–42. Kou, Y., Lu, C.-T., and Chen, D. 2006. Spatial weighted outlier detection. In Proceedings of SIAM Conference on Data Mining. Kruegel, C., Mutz, D., Robertson, W., and Valeur, F. 2003. Bayesian event classification for intrusion detection. In Proceedings of the 19th Annual Computer Security Applications Conference. IEEE Computer Society, 14. Kruegel, C., Toth, T., and Kirda, E. 2002. Service specific anomaly detection for network intrusion detection. In Proceedings of the 2002 ACM symposium on Applied computing. ACM Press, 201–208. Kruegel, C. and Vigna, G. 2003. Anomaly detection of web-based attacks. In Proceedings of the 10th ACM conference on Computer and communications security. ACM Press, 251–261. To Appear in ACM Computing Surveys, 09 2009.
64
·
Chandola, Banerjee and Kumar
Kumar, V. 2005. Parallel and distributed computing for cybersecurity. Distributed Systems Online, IEEE 6, 10. Labib, K. and Vemuri, R. 2002. Nsom: A real-time network-based intrusion detection using self-organizing maps. Networks and Security. Lafferty, J. D., McCallum, A., and Pereira, F. C. N. 2001. Conditional random fields: Probabilistic models for segmenting and labeling sequence data. In Proceedings of the Eighteenth International Conference on Machine Learning. Morgan Kaufmann Publishers Inc., San Francisco, CA, USA, 282–289. Lakhina, A., Crovella, M., and Diot, C. 2005. Mining anomalies using traffic feature distributions. In Proceedings of the 2005 conference on Applications, technologies, architectures, and protocols for computer communications. ACM Press, New York, NY, USA, 217–228. Lane, T. and Brodley, C. E. 1997a. An application of machine learning to anomaly detection. In Proceedings of 20th NIST-NCSC National Information Systems Security Conference. 366–380. Lane, T. and Brodley, C. E. 1997b. Sequence matching and learning in anomaly detection for computer security. In Proceedings of AI Approaches to Fraud Detection and Risk Management, Fawcett, Haimowitz, Provost, and Stolfo, Eds. AAAI Press, 43–49. Lane, T. and Brodley, C. E. 1999. Temporal sequence learning and data reduction for anomaly detection. ACM Transactions on Information Systems and Security 2, 3, 295–331. Lauer, M. 2001. A mixture approach to novelty detection using training data with outliers. In Proceedings of the 12th European Conference on Machine Learning. Springer-Verlag, London, UK, 300–311. Laurikkala, J., Juhola1, M., and Kentala., E. 2000. Informal identification of outliers in medical data. In Fifth International Workshop on Intelligent Data Analysis in Medicine and Pharmacology. 20–24. Lazarevic, A., Ertoz, L., Kumar, V., Ozgur, A., and Srivastava, J. 2003. A comparative study of anomaly detection schemes in network intrusion detection. In Proceedings of SIAM International Conference on Data Mining. SIAM. Lee, W. and Stolfo, S. 1998. Data mining approaches for intrusion detection. In Proceedings of the 7th USENIX Security Symposium. San Antonio, TX. Lee, W., Stolfo, S., and Chan, P. 1997. Learning patterns from unix process execution traces for intrusion detection. In Proceedings of the AAAI 97 workshop on AI methods in Fraud and risk management. Lee, W., Stolfo, S. J., and Mok, K. W. 2000. Adaptive intrusion detection: A data mining approach. Artificial Intelligence Review 14, 6, 533–567. Lee, W. and Xiang, D. 2001. Information-theoretic measures for anomaly detection. In Proceedings of the IEEE Symposium on Security and Privacy. IEEE Computer Society, 130. Li, M. and Vitanyi, P. M. B. 1993. An Introduction to Kolmogorov Complexity and Its Applications. Springer-Verlag, Berlin. Li, Y., Pont, M. J., and Jones, N. B. 2002. Improving the performance of radial basis function classifiers in condition monitoring and fault diagnosis applications where unknown faults may occur. Pattern Recognition Letters 23, 5, 569–577. Lin, J., Keogh, E., Fu, A., and Herle, H. V. 2005. Approximations to magic: Finding unusual medical time series. In Proceedings of the 18th IEEE Symposium on Computer-Based Medical Systems. IEEE Computer Society, Washington, DC, USA, 329–334. Lin, S. and Brown, D. E. 2003. An outlier-based data association method for linking criminal incidents. In Proceedings of 3rd SIAM Data Mining Conference. Liu, J. P. and Weng, C. S. 1991. Detection of outlying data in bioavailability/bioequivalence studies. Statistics Medicine 10, 9, 1375–89. Lu, C.-T., Chen, D., and Kou, Y. 2003. Algorithms for spatial outlier detection. In Proceedings of 3rd International Conference on Data Mining. 597–600. Ma, J. and Perkins, S. 2003a. Online novelty detection on temporal sequences. In Proceedings of the 9th ACM SIGKDD international conference on Knowledge discovery and data mining. ACM Press, New York, NY, USA, 613–618. To Appear in ACM Computing Surveys, 09 2009.
Anomaly Detection : A Survey
·
65
Ma, J. and Perkins, S. 2003b. Time-series novelty detection using one-class support vector machines. In Proceedings of the International Joint Conference on Neural Networks. Vol. 3. 1741– 1745. MacDonald, J. W. and Ghosh, D. 2007. Copa–cancer outlier profile analysis. Bioinformatics 22, 23, 2950–2951. Mahoney, M. V. and Chan, P. K. 2002. Learning nonstationary models of normal network traffic for detecting novel attacks. In Proceedings of the 8th ACM SIGKDD international conference on Knowledge discovery and data mining. ACM Press, 376–385. Mahoney, M. V. and Chan, P. K. 2003. Learning rules for anomaly detection of hostile network traffic. In Proceedings of the 3rd IEEE International Conference on Data Mining. IEEE Computer Society, 601. Mahoney, M. V., Chan, P. K., and Arshad, M. H. 2003. A machine learning approach to anomaly detection. Tech. Rep. CS–2003–06, Department of Computer Science, Florida Institute of Technology Melbourne FL 32901. march. Manevitz, L. M. and Yousef, M. 2000. Learning from positive data for document classification using neural networks. In Proceedings of Second Bar-Ilan Workshop on Knowledge Discovery and Learning. Jerusalem. Manevitz, L. M. and Yousef, M. 2002. One-class svms for document classification. Journal of Machine Learning Research 2, 139–154. Manikopoulos, C. and Papavassiliou, S. 2002. Network intrusion and fault detection: a statistical anomaly approach. IEEE Communication Magazine 40. Manson, G. 2002. Identifying damage sensitive, environment insensitive features for damage detection. In Proceedings of the IES Conference. Swansea, UK. Manson, G., Pierce, G., and Worden, K. 2001. On the long-term stability of normal condition for damage detection in a composite panel. In Proceedings of the 4th International Conference on Damage Assessment of Structures. Cardiff, UK. Manson, G., Pierce, S. G., Worden, K., Monnier, T., Guy, P., and Atherton, K. 2000. Long-term stability of normal condition data for novelty detection. In Proceedings of Smart Structures and Integrated Systems. 323–334. Marceau, C. 2000. Characterizing the behavior of a program using multiple-length n-grams. In Proceedings of the 2000 workshop on New Security Paradigms. ACM Press, New York, NY, USA, 101–110. Marchette, D. 1999. A statistical method for profiling network traffic. In Proceedings of 1st USENIX Workshop on Intrusion Detection and Network Monitoring. Santa Clara, CA, 119– 128. Markou, M. and Singh, S. 2003a. Novelty detection: a review-part 1: statistical approaches. Signal Processing 83, 12, 2481–2497. Markou, M. and Singh, S. 2003b. Novelty detection: a review-part 2: neural network based approaches. Signal Processing 83, 12, 2499–2521. Marsland, S., Nehmzow, U., and Shapiro, J. 1999. A model of habituation applied to mobile robots. In Proceedings of Towards Intelligent Mobile Robots. Department of Computer Science, Manchester University, Technical Report Series, ISSN 1361-6161, Report UMCS-99-3-1. Marsland, S., Nehmzow, U., and Shapiro, J. 2000a. Novelty detection for robot neotaxis. In Proceedings of the 2nd International Symposium on Neural Compuatation. 554 – 559. Marsland, S., Nehmzow, U., and Shapiro, J. 2000b. A real-time novelty detector for a mobile robot. In Proceedings of the EUREL Conference on Advanced Robotics Systems. Martinelli, G. and Perfetti, R. 1994. Generalized cellular neural network for novelty detection. IEEE Transactions on Circuits Systems I: Fundamental Theory Application 41, 2, 187–190. Martinez, D. 1998. Neural tree density estimation for novelty detection. IEEE Transactions on Neural Networks 9, 2, 330–338. McCallum, A., Freitag, D., and Pereira, F. C. N. 2000. Maximum entropy markov models for information extraction and segmentation. In Proceedings of the 17th International Conference on Machine Learning. Morgan Kaufmann Publishers Inc., San Francisco, CA, USA, 591–598. To Appear in ACM Computing Surveys, 09 2009.
66
·
Chandola, Banerjee and Kumar
McCallum, A., Nigam, K., and Ungar, L. H. 2000. Efficient clustering of high-dimensional data sets with application to reference matching. In Proceedings of the 6th ACM SIGKDD international conference on Knowledge discovery and data mining. ACM Press, 169–178. McNeil, A. 1999. Extreme value theory for risk managers. Internal Modelling and CAD II , 93–113. Mingming, N. Y. 2000. Probabilistic networks with undirected links for anomaly detection. In Proceedings of IEEE Systems, Man, and Cybernetics Information Assurance and Security Workshop. 175–179. Motulsky, H. 1995. Intuitive Biostatistics: Choosing a statistical test. Oxford University Press, Chapter 37. Moya, M., Koch, M., and Hostetler, L. 1993. One-class classifier networks for target recognition applications. In Proceedings on World Congress on Neural Networks, International Neural Network Society. Portland, OR, 797–801. Murray, A. F. 2001. Novelty detection using products of simple experts - a potential architecture for embedded systems. Neural Networks 14, 9, 1257–1264. Nairac, A., Corbett-Clark, T., Ripley, R., Townsend, N., and Tarassenko, L. 1997. Choosing an appropriate model for novelty detection. In Proceedings of the 5th IEEE International Conference on Artificial Neural Networks. 227–232. Nairac, A., Townsend, N., Carr, R., King, S., Cowley, P., and Tarassenko, L. 1999. A system for the analysis of jet engine vibration data. Integrated Computer-Aided Engineering 6, 1, 53–56. Ng, R. T. and Han, J. 1994. Efficient and effective clustering methods for spatial data mining. In Proceedings of the 20th International Conference on Very Large Data Bases. Morgan Kaufmann Publishers Inc., San Francisco, CA, USA, 144–155. Noble, C. C. and Cook, D. J. 2003. Graph-based anomaly detection. In Proceedings of the 9th ACM SIGKDD international conference on Knowledge discovery and data mining. ACM Press, 631–636. Odin, T. and Addison, D. 2000. Novelty detection using neural network technology. In Proceedings of the COMADEN Conference. Houston, TX. Otey, M., Parthasarathy, S., Ghoting, A., Li, G., Narravula, S., and Panda, D. 2003. Towards nic-based intrusion detection. In Proceedings of the 9th ACM SIGKDD international conference on Knowledge discovery and data mining. ACM Press, New York, NY, USA, 723– 728. Otey, M. E., Ghoting, A., and Parthasarathy, S. 2006. Fast distributed outlier detection in mixed-attribute data sets. Data Mining and Knowledge Discovery 12, 2-3, 203–228. Palshikar, G. K. 2005. Distance-based outliers in sequences. Lecture Notes in Computer Science 3816, 547–552. Papadimitriou, S., Kitagawa, H., Gibbons, P. B., and Faloutsos, C. 2002. Loci: Fast outlier detection using the local correlation integral. Tech. Rep. IRP-TR-02-09, Intel Research Laboratory, Pittsburgh, PA. July. Parra, L., Deco, G., and Miesbach, S. 1996. Statistical independence and novelty detection with information preserving nonlinear maps. Neural Computing 8, 2, 260–269. Parzen, E. 1962. On the estimation of a probability density function and mode. Annals of Mathematical Statistics 33, 1065–1076. Patcha, A. and Park, J.-M. 2007. An overview of anomaly detection techniques: Existing solutions and latest technological trends. Comput. Networks 51, 12, 3448–3470. Pavlov, D. 2003. Sequence modeling with mixtures of conditional maximum entropy distributions. In Proceedings of the Third IEEE International Conference on Data Mining. IEEE Computer Society, Washington, DC, USA, 251. Pavlov, D. and Pennock, D. 2002. A maximum entropy approach to collaborative filtering in dynamic, sparse, high-dimensional domains. In Proceedings of Advances in Neural Information Processing. MIT Press. To Appear in ACM Computing Surveys, 09 2009.
Anomaly Detection : A Survey
·
67
Petsche, T., Marcantonio, A., Darken, C., Hanson, S., Kuhn, G., and Santoso, I. 1996. A neural network autoassociator for induction motor failure prediction. In Proceedings of Advances in Neural Information Processing. Vol. 8. 924–930. Phoha, V. V. 2002. The Springer Internet Security Dictionary. Springer-Verlag. Phua, C., Alahakoon, D., and Lee, V. 2004. Minority report in fraud detection: classification of skewed data. SIGKDD Explorer Newsletter 6, 1, 50–59. Phuong, T. V., Hung, L. X., Cho, S. J., Lee, Y., and Lee, S. 2006. An anomaly detection algorithm for detecting attacks in wireless sensor networks. Intelligence and Security Informatics 3975, 735–736. Pickands, J. 1975. Statistical inference using extreme order statistics. The Annals of Statistics 3, 1 (Jan), 119–131. Pires, A. and Santos-Pereira, C. 2005. Using clustering and robust estimators to detect outliers in multivariate data. In Proceedings of International Conference on Robust Statistics. Finland. Platt, J. 2000. Probabilistic outputs for support vector machines and comparison to regularized likelihood methods. A. Smola, P. Bartlett, B. Schoelkopf, and D. Schuurmans, Eds. 61–74. Pokrajac, D., Lazarevic, A., and Latecki, L. J. 2007. Incremental local outlier detection for data streams. In Proceedings of IEEE Symposium on Computational Intelligence and Data Mining. Porras, P. A. and Neumann, P. G. 1997. EMERALD: Event monitoring enabling responses to anomalous live disturbances. In Proceedings of 20th NIST-NCSC National Information Systems Security Conference. 353–365. Portnoy, L., Eskin, E., and Stolfo, S. 2001. Intrusion detection with unlabeled data using clustering. In Proceedings of ACM Workshop on Data Mining Applied to Security. Protopapas, P., Giammarco, J. M., Faccioli, L., Struble, M. F., Dave, R., and Alcock, C. 2006. Finding outlier light curves in catalogues of periodic variable stars. Monthly Notices of the Royal Astronomical Society 369, 2, 677–696. Qin, M. and Hwang, K. 2004. Frequent episode rules for internet anomaly detection. In Proceedings of the 3rd IEEE International Symposium on Network Computing and Applications. IEEE Computer Society. Ramadas, M., Ostermann, S., and Tjaden, B. C. 2003. Detecting anomalous network traffic with self-organizing maps. In Proceedings of Recent Advances in Intrusion Detection. 36–54. Ramaswamy, S., Rastogi, R., and Shim, K. 2000. Efficient algorithms for mining outliers from large data sets. In Proceedings of the 2000 ACM SIGMOD international conference on Management of data. ACM Press, 427–438. Ratsch, G., Mika, S., Scholkopf, B., and Muller, K.-R. 2002. Constructing boosting algorithms from svms: An application to one-class classification. IEEE Transactions on Pattern Analysis and Machine Intelligence 24, 9, 1184–1199. Roberts, S. 1999. Novelty detection using extreme value statistics. In Proceedings of IEEE Vision, Image and Signal processing. Vol. 146. 124–129. Roberts, S. 2002. Extreme value statistics for novelty detection in biomedical signal processing. In Proceedings of the 1st International Conference on Advances in Medical Signal and Information Processing. 166–172. Roberts, S. and Tarassenko, L. 1994. A probabilistic resource allocating network for novelty detection. Neural Computing 6, 2, 270–284. Rosner, B. 1983. Percentage points for a generalized esd many-outlier procedure. Technometrics 25, 2 (may), 165–172. Roth, V. 2004. Outlier detection with one-class kernel fisher discriminants. In NIPS. Roth, V. 2006. Kernel fisher discriminants for outlier detection. Neural Computation 18, 4, 942–960. Rousseeuw, P. J. and Leroy, A. M. 1987. Robust regression and outlier detection. John Wiley & Sons, Inc., New York, NY, USA. Roussopoulos, N., Kelley, S., and Vincent, F. 1995. Nearest neighbor queries. In Proceedings of ACM-SIGMOD International Conference on Management of Data. To Appear in ACM Computing Surveys, 09 2009.
68
·
Chandola, Banerjee and Kumar
Ruotolo, R. and Surace, C. 1997. A statistical approach to damage detection through vibration monitoring. In Proceedings of the 5th Pan American Congress of Applied Mechanics. Puerto Rico. Salvador, S. and Chan, P. 2003. Learning states and rules for time-series anomaly detection. Tech. Rep. CS–2003–05, Department of Computer Science, Florida Institute of Technology Melbourne FL 32901. march. Sarawagi, S., Agrawal, R., and Megiddo, N. 1998. Discovery-driven exploration of olap data cubes. In Proceedings of the 6th International Conference on Extending Database Technology. Springer-Verlag, London, UK, 168–182. Sargor, C. 1998. Statistical anomaly detection for link-state routing protocols. In Proceedings of the Sixth International Conference on Network Protocols. IEEE Computer Society, Washington, DC, USA, 62. Saunders, R. and Gero, J. 2000. The importance of being emergent. In Proceedings of Artificial Intelligence in Design. Scarth, G., McIntyre, M., Wowk, B., and Somorjai, R. 1995. Detection of novelty in functional images using fuzzy clustering. In Proceedings of the 3rd Meeting of International Society for Magnetic Resonance in Medicine. Nice, France, 238. ¨ lkopf, B., Platt, J. C., Shawe-Taylor, J. C., Smola, A. J., and Williamson, R. C. 2001. Scho Estimating the support of a high-dimensional distribution. Neural Comput. 13, 7, 1443–1471. Scott, S. L. 2001. Detecting network intrusion using a markov modulated nonhomogeneous poisson process. Submitted to the Journal of the American Statistical Association. Sebyala, A. A., Olukemi, T., and Sacks, L. 2002. Active platform security through intrusion detection using naive bayesian network for anomaly detection. In Proceedings of the 2002 London Communications Symposium. Sekar, R., Bendre, M., Dhurjati, D., and Bollineni, P. 2001. A fast automaton-based method for detecting anomalous program behaviors. In Proceedings of the IEEE Symposium on Security and Privacy. IEEE Computer Society, 144. Sekar, R., Guang, Y., Verma, S., and Shanbhag, T. 1999. A high-performance network intrusion detection system. In Proceedings of the 6th ACM conference on Computer and communications security. ACM Press, 8–17. Sekar, R., Gupta, A., Frullo, J., Shanbhag, T., Tiwari, A., Yang, H., and Zhou, S. 2002. Specification-based anomaly detection: a new approach for detecting network intrusions. In Proceedings of the 9th ACM conference on Computer and communications security. ACM Press, 265–274. Sequeira, K. and Zaki, M. 2002. Admit: anomaly-based data mining for intrusions. In Proceedings of the 8th ACM SIGKDD international conference on Knowledge discovery and data mining. ACM Press, 386–395. Sheikholeslami, G., Chatterjee, S., and Zhang, A. 1998. Wavecluster: A multi-resolution clustering approach for very large spatial databases. In Proceedings of the 24rd International Conference on Very Large Data Bases. Morgan Kaufmann Publishers Inc., San Francisco, CA, USA, 428–439. Shekhar, S., Lu, C.-T., and Zhang, P. 2001. Detecting graph-based spatial outliers: algorithms and applications (a summary of results). In Proceedings of the 7th ACM SIGKDD international conference on Knowledge discovery and data mining. ACM Press, New York, NY, USA, 371– 376. Shewhart, W. A. 1931. Economic Control of Quality of Manufactured Product. D. Van Nostrand Company, New York NY. Shyu, M.-L., Chen, S.-C., Sarinnapakorn, K., and Chang, L. 2003. A novel anomaly detection scheme based on principal component classifier. In Proceedings of 3rd IEEE International Conference on Data Mining. 353–365. Siaterlis, C. and Maglaris, B. 2004. Towards multisensor data fusion for dos detection. In Proceedings of the 2004 ACM symposium on Applied computing. ACM Press, 439–446. Singh, S. and Markou, M. 2004. An approach to novelty detection applied to the classification of image regions. IEEE Transactions on Knowledge and Data Engineering 16, 4, 396–407. To Appear in ACM Computing Surveys, 09 2009.
Anomaly Detection : A Survey
·
69
Smith, R., Bivens, A., Embrechts, M., Palagiri, C., and Szymanski, B. 2002. Clustering approaches for anomaly based intrusion detection. In Proceedings of Intelligent Engineering Systems through Artificial Neural Networks. ASME Press, 579–584. Smyth, P. 1994. Markov monitoring with unknown states. IEEE Journal on Selected Areas in Communications, Special Issue on Intelligent Signal Processing for Communications 12, 9 (december), 1600–1612. Smyth, P. 1997. Clustering sequences with hidden markov models. In Advances in Neural Information Processing. Vol. 9. MIT Press. Snyder, D. 2001. Online intrusion detection using sequences of system calls. M.S. thesis, Department of Computer Science, Florida State University. Sohn, H., Worden, K., and Farrar, C. 2001. Novelty detection under changing environmental conditions. In Proceedings of Eighth Annual SPIE International Symposium on Smart Structures and Materials. Newport Beach, CA. Solberg, H. E. and Lahti, A. 2005. Detection of outliers in reference distributions: Performance of horn’s algorithm. Clinical Chemistry 51, 12, 2326–2332. Song, Q., Hu, W., and Xie, W. 2002. Robust support vector machine with bullet hole image classification. IEEE Transactions on Systems, Man, and Cybernetics – Part C:Applications and Reviews 32, 4. Song, S., Shin, D., and Yoon, E. 2001. Analysis of novelty detection properties of autoassociators. In Proceedings of Condition Monitoring and Diagnostic Engineering Management. 577–584. Song, X., Wu, M., Jermaine, C., and Ranka, S. 2007. Conditional anomaly detection. IEEE Transactions on Knowledge and Data Engineering 19, 5, 631–645. Soule, A., Salamatian, K., and Taft, N. 2005. Combining filtering and statistical methods for anomaly detection. In IMC ’05: Proceedings of the 5th ACM SIGCOMM conference on Internet measurement. ACM, New York, NY, USA, 1–14. Spence, C., Parra, L., and Sajda, P. 2001. Detection, synthesis and compression in mammographic image analysis with a hierarchical image probability model. In Proceedings of the IEEE Workshop on Mathematical Methods in Biomedical Image Analysis. IEEE Computer Society, Washington, DC, USA, 3. Srivastava, A. 2006. Enabling the discovery of recurring anomalies in aerospace problem reports using high-dimensional clustering techniques. Aerospace Conference, 2006 IEEE , 17–34. Srivastava, A. and Zane-Ulman, B. 2005. Discovering recurring anomalies in text reports regarding complex space systems. Aerospace Conference, 2005 IEEE , 3853–3862. Stefano, C., Sansone, C., and Vento, M. 2000. To reject or not to reject: that is the question– an answer in case of neural classifiers. IEEE Transactions on Systems, Management and Cybernetics 30, 1, 84–94. Stefansky, W. 1972. Rejecting outliers in factorial designs. Technometrics 14, 2, 469–479. Steinwart, I., Hush, D., and Scovel, C. 2005. A classification framework for anomaly detection. Journal of Machine Learning Research 6, 211–232. Streifel, R., Maks, R., and El-Sharkawi, M. 1996. Detection of shorted-turns in the field of turbine-generator rotors using novelty detectors–development and field tests. IEEE Transactions on Energy Conversations 11, 2, 312–317. Subramaniam, S., Palpanas, T., Papadopoulos, D., Kalogeraki, V., and Gunopulos, D. 2006. Online outlier detection in sensor data using non-parametric models. In VLDB ’06: Proceedings of the 32nd international conference on Very large data bases. VLDB Endowment, 187–198. Sun, H., Bao, Y., Zhao, F., Yu, G., and Wang, D. 2004. Cd-trees: An efficient index structure for outlier detection. 600–609. Sun, J., Qu, H., Chakrabarti, D., and Faloutsos, C. 2005. Neighborhood formation and anomaly detection in bipartite graphs. In Proceedings of the 5th IEEE International Conference on Data Mining. IEEE Computer Society, Washington, DC, USA, 418–425. To Appear in ACM Computing Surveys, 09 2009.
70
·
Chandola, Banerjee and Kumar
Sun, J., Xie, Y., Zhang, H., and Faloutsos, C. 2007. Less is more: Compact matrix representation of large sparse graphs. In Proceedings of 7th SIAM International Conference on Data Mining. Sun, P. and Chawla, S. 2004. On local spatial outliers. In Proceedings of 4th IEEE International Conference on Data Mining. 209–216. Sun, P. and Chawla, S. 2006. Slom: a new measure for local spatial outliers. Knowledge and Information Systems 9, 4, 412–429. Sun, P., Chawla, S., and Arunasalam, B. 2006. Mining for outliers in sequential databases. In In SIAM International Conference on Data Mining. Surace, C. and Worden, K. 1998. A novelty detection method to diagnose damage in structures: an application to an offshore platform. In Proceedings of Eighth International Conference of Off-shore and Polar Engineering. Vol. 4. Colorado, USA, 64–70. Surace, C., Worden, K., and Tomlinson, G. 1997. A novelty detection approach to diagnose damage in a cracked beam. In Proceedings of SPIE. Vol. 3089. 947–953. Suzuki, E., Watanabe, T., Yokoi, H., and Takabayashi, K. 2003. Detecting interesting exceptions from medical test data with visual summarization. In Proceedings of the 3rd IEEE International Conference on Data Mining. 315–322. Sykacek, P. 1997. Equivalent error bars for neural network classifiers trained by bayesian inference. In Proceedings of the European Symposium on Artificial Neural Networks. 121–126. Tan, P.-N., Steinbach, M., and Kumar, V. 2005. Introduction to Data Mining. Addison-Wesley. Tandon, G. and Chan, P. 2007. Weighting versus pruning in rule validation for detecting network and host anomalies. In Proceedings of the 13th ACM SIGKDD international conference on Knowledge discovery and data mining. ACM Press. Tang, J., Chen, Z., chee Fu, A. W., and W.Cheung, D. 2002. Enhancing effectiveness of outlier detections for low density patterns. In Proceedings of the Pacific-Asia Conference on Knowledge Discovery and Data Mining. 535–548. Taniguchi, M., Haft, M., Hollmn, J., and Tresp, V. 1998. Fraud detection in communications networks using neural and probabilistic methods. In Proceedings of IEEE International Conference in Acoustics, Speech and Signal Processing. Vol. 2. IEEE Computer Society, 1241–1244. Tao, Y., Xiao, X., and Zhou, S. 2006. Mining distance-based outliers from large databases in any metric space. In Proceedings of the 12th ACM SIGKDD international conference on Knowledge discovery and data mining. ACM Press, New York, NY, USA, 394–403. Tarassenko, L. 1995. Novelty detection for the identification of masses in mammograms. In Proceedings of the 4th IEEE International Conference on Artificial Neural Networks. Vol. 4. Cambridge, UK, 442–447. Tax, D. and Duin, R. 1999a. Data domain description using support vectors. In Proceedings of the European Symposium on Artificial Neural Networks, M. Verleysen, Ed. Brussels, 251–256. Tax, D. and Duin, R. 1999b. Support vector data description. Pattern Recognition Letters 20, 1113, 1191–1199. Tax, D. M. J. 2001. One-class classification; concept-learning in the absence of counter-examples. Ph.D. thesis, Delft University of Technology. Teng, H., Chen, K., and Lu, S. 1990. Adaptive real-time anomaly detection using inductively generated sequential patterns. In Proceedings of IEEE Computer Society Symposium on Research in Security and Privacy. IEEE Computer Society Press, 278–284. Theiler, J. and Cai, D. M. 2003. Resampling approach for anomaly detection in multispectral images. In Proceedings of SPIE 5093, 230-240, Ed. Thompson, B., II, R. M., Choi, J., El-Sharkawi, M., Huang, M., and Bunje, C. 2002. Implicit learning in auto-encoder novelty assessment. In Proceedings of International Joint Conference on Neural Networks. Honolulu, 2878–2883. Thottan, M. and Ji, C. 2003. Anomaly detection in ip networks. IEEE Transactions on Signal Processing 51, 8, 2191–2204. Tibshirani, R. and Hastie, T. 2007. Outlier sums for differential gene expression analysis. Biostatistics 8, 1, 2–8. To Appear in ACM Computing Surveys, 09 2009.
Anomaly Detection : A Survey
·
71
Tomlins, S. A., Rhodes, D. R., Perner, S., Dhanasekaran, S. M., Mehra, R., Sun, X. W., Varambally, S., Cao, X., Tchinda, J., Kuefer, R., Lee, C., Montie, J. E., Shah, R., Pienta, K. J., Rubin, M., and Chinnaiyan, A. M. 2005. Recurrent fusion of tmprss2 and ets transcription factor genes in prostate cancer. Science 310, 5748, 603–611. Torr, P. and Murray, D. 1993. Outlier detection and motion segmentation. In Proceedings of SPIE, Sensor Fusion VI, Paul S. Schenker; Ed. Vol. 2059. 432–443. Tsay, R. S., Pea, D., and Pankratz, A. E. 2000. Outliers in multivariate time series. Biometrika 87, 4, 789–804. Vaidya, J. and Clifton, C. 2004. Privacy-preserving outlier detection. In Proceedings of the 4th IEEE International Conference on Data Mining. 233–240. Valdes, A. and Skinner, K. 2000. Adaptive, model-based monitoring for cyber attack detection. In Proceedings of the 3rd International Workshop on Recent Advances in Intrusion Detection. Springer-Verlag, 80–92. Vapnik, V. N. 1995. The nature of statistical learning theory. Springer-Verlag New York, Inc., New York, NY, USA. Vasconcelos, G., Fairhurst, M., and Bisset, D. 1994. Recognizing novelty in classification tasks. In Proceedings of Neural Information Processing Systems Workshop on Novelty Detection and Adaptive Systems monitoring. Denver, CO. Vasconcelos, G. C., Fairhurst, M. C., and Bisset, D. L. 1995. Investigating feedforward neural networks with respect to the rejection of spurious patterns. Pattern Recognition Letters 16, 2, 207–212. Vilalta, R. and Ma, S. 2002. Predicting rare events in temporal domains. In Proceedings of the 2002 IEEE International Conference on Data Mining. IEEE Computer Society, Washington, DC, USA, 474. Vinueza, A. and Grudic, G. 2004. Unsupervised outlier detection and semi-supervised learning. Tech. Rep. CU-CS-976-04, Univ. of Colorado at Boulder. May. Wei, L., Qian, W., Zhou, A., and Jin, W. 2003. Hot: Hypergraph-based outlier test for categorical data. In Proceedings of the 7th Pacific-Asia Conference on Knowledge and Data Discovery. 399–410. Weigend, A. S., Mangeas, M., and Srivastava, A. N. 1995. Nonlinear gated experts for time-series - discovering regimes and avoiding overfitting. International Journal of Neural Systems 6, 4, 373–399. Weiss, G. M. and Hirsh, H. 1998. Learning to predict rare events in event sequences. In Proceedings of 4th International Conference on Knowledge Discovery and Data Mining, R. Agrawal, P. Stolorz, and G. Piatetsky-Shapiro, Eds. AAAI Press, Menlo Park, CA, New York, NY, 359–363. Whitehead, B. and Hoyt, W. 1993. A function approximation approach to anomaly detection in propulsion system test data. In In Proceedings of 29th AIAA/SAE/ASME/ASEE Joint Propulsion Conference. IEEE Computer Society, Monterey, CA, USA. Williams, G., Baxter, R., He, H., Hawkins, S., and Gu, L. 2002. A comparative study of rnn for outlier detection in data mining. In Proceedings of the 2002 IEEE International Conference on Data Mining. IEEE Computer Society, Washington, DC, USA, 709. Wong, W.-K., Moore, A., Cooper, G., and Wagner, M. 2002. Rule-based anomaly pattern detection for detecting disease outbreaks. In Proceedings of the 18th National Conference on Artificial Intelligence. MIT Press. Also available online from http://www.cs.cmu.edu/simawm/antiterror. Wong, W.-K., Moore, A., Cooper, G., and Wagner, M. 2003. Bayesian network anomaly pattern detection for disease outbreaks. In Proceedings of the 20th International Conference on Machine Learning. AAAI Press, Menlo Park, California, 808–815. Worden, K. 1997. Structural fault detection using a novelty measure. Journal of Sound Vibration 201, 1, 85–101. Wu, M. and Jermaine, C. 2006. Outlier detection by sampling with accuracy guarantees. In Proceedings of the 12th ACM SIGKDD international conference on Knowledge discovery and data mining. ACM, New York, NY, USA, 767–772. To Appear in ACM Computing Surveys, 09 2009.
72
·
Chandola, Banerjee and Kumar
Wu, N. and Zhang, J. 2003. Factor analysis based anomaly detection. In Proceedings of IEEE Workshop on Information Assurance. United States Military Academy, West Point, NY, USA. Yairi, T., Kato, Y., and Hori, K. 2001. Fault detection by mining association rules from housekeeping data. In In Proceedings of International Symposium on Artificial Intelligence, Robotics and Automation in Space. Yamanishi, K. and ichi Takeuchi, J. 2001. Discovering outlier filtering rules from unlabeled data: combining a supervised learner with an unsupervised learner. In Proceedings of the 7th ACM SIGKDD international conference on Knowledge discovery and data mining. ACM Press, 389–394. Yamanishi, K., Takeuchi, J.-I., Williams, G., and Milne, P. 2004. On-line unsupervised outlier detection using finite mixtures with discounting learning algorithms. Data Mining and Knowledge Discovery 8, 275–300. Yang, J. and Wang, W. 2003. Cluseq: Efficient and effective sequence clustering. In Proceddings of International Conference on Data Engineering. 101–112. Yankov, D., Keogh, E. J., and Rebbapragada, U. 2007. Disk aware discord discovery: Finding unusual time series in terabyte sized datasets. In Proceedings of International Conference on Data Mining. 381–390. Ye, N. 2004. A markov chain model of temporal behavior for anomaly detection. In Proceedings of the 5th Annual IEEE Information Assurance Workshop. IEEE. Ye, N. and Chen, Q. 2001. An anomaly detection technique based on a chi-square statistic for detecting intrusions into information systems. Quality and Reliability Engineering International 17, 105–112. Yi, B.-K., Sidiropoulos, N., Johnson, T., Jagadish, H. V., Faloutsos, C., and Biliris, A. 2000. Online data mining for co-evolving time sequences. In Proceedings of the 16th International Conference on Data Engineering. IEEE Computer Society, Washington, DC, USA, 13. Ypma, A. and Duin, R. 1998. Novelty detection using self-organizing maps. In Progress in Connectionist Based Information Systems. Vol. 2. Springer, 1322–1325. Yu, D., Sheikholeslami, G., and Zhang, A. 2002. Findout: finding outliers in very large datasets. Knowledge And Information Systems 4, 4, 387–412. Yu, J. X., Qian, W., Lu, H., and Zhou, A. 2006. Finding centric local outliers in categorical/numerical spaces. Knowledge and Information Systems 9, 3, 309–338. Zeevi, A. J., Meir, R., and Adler, R. 1997. Time series prediction using mixtures of experts. In Advances in Neural Information Processing. Vol. 9. MIT Press. Zhang, J. and Wang, H. 2006. Detecting outlying subspaces for high-dimensional data: the new task, algorithms, and performance. Knowledge and Information Systems 10, 3, 333–355. Zhang, Z., Li, J., Manikopoulos, C., Jorgenson, J., and Ucles, J. 2001. Hide: a hierarchical network intrusion detection system using statistical preprocessing and neural network classification. In Proceedings of IEEE Workshop on Information Assurance and Security. West Point, 85–90. Zimmermann, J. and Mohay, G. 2006. Distributed intrusion detection in clusters based on non-interference. In ACSW Frontiers ’06: Proceedings of the 2006 Australasian workshops on Grid computing and e-research. Australian Computer Society, Inc., Darlinghurst, Australia, Australia, 89–95.
To Appear in ACM Computing Surveys, 09 2009.