adaptive bit-rate video streams knowingly out of scope. Experi- mental results indicate not surprisingly that state of the art ob- jective quality metrics overlook the ...
Applicability of Existing Objective Metrics of Perceptual Quality for Adaptive Video Streaming ¨ f ,g , and Manzoor Razaak h Jacob Søgaard a , Luka´ sˇ Krasula b,c , Muhammad Shahid d , Dogancan Temel e , Kjell Brunnstrom a Technical University of Denmark, Department of Photonics, Ørsteds Plads 343, 2800 Kgs. Lyngby, Denmark b Czech Technical University in Prague, Technicka ´ 2, 166 27 Prague 6, Czech Republic c LUNAM University - IRCCyN CNRS UMR 6597, 44306, Nantes, France d Blekinge Institute of Technology, 37179, Karlskrona, Sweden e Georgia Institute of Technology, Atlanta, GA, 30332-0250 USA f Acreo Swedish ICT AB, Isafjordsgatan 22, 164 40 Kista, Sweden g Mid Sweden University, Holmgatan 10, 851 70 Sundsvall, Sweden h Kingston University, Penrhyn Road, Kingston upon Thames, Surrey KT1 2EE, UK
Abstract Objective video quality metrics are designed to estimate the quality of experience of the end user. However, these objective metrics are usually validated with video streams degraded under common distortion types. In the presented work, we analyze the performance of published and known full-reference and noreference quality metrics in estimating the perceived quality of adaptive bit-rate video streams knowingly out of scope. Experimental results indicate not surprisingly that state of the art objective quality metrics overlook the perceived degradations in the adaptive video streams and perform poorly in estimating the subjective quality results.
Introduction The legitimate judges of visual quality are humans as end users, the opinions of whom can to some extent be obtained by subjective experiments. However, automatic methods of visual quality estimation are required due to infeasibility of conducting the subjective experiments in many scenarios. Automatic evaluation of perceptual quality through objective assessment has considerably progressed in the recent years. The purpose of such objective quality methods is to automatically predict with high accuracy the users’ perceived quality, which in most cases are represented by a subjective assessment score. For instance, a set of quality-related parameters of an image or video are pooled together to establish an objective quality method which can be mapped to predict subjective opinion. Depending on the degree of information that is available e.g. from the original video in the quality assessment, the objective methods are further divided into Full Reference (FR), Reduced Reference (RR), and No-Reference (NR) as follows [1]: • FR methods: Following this approach, the entire original image/video or a high quality version of it is made available as a reference. Accordingly, FR methods are based on comparing distorted image/video with the original image/video. • RR methods: In this case, it is not required to provide direct access to the reference, but only to provide representative features about texture or other suitable characteristics of the reference. The comparison of the reduced information from
the original image/video with the corresponding information from the distorted image/video provides the input for RR methods. • NR methods: This class of objective quality methods does not require access to the reference, but searches for perceptual artifacts solely in the distorted image/video. NR methods are either based on analysis of the decoded pixels, utilize information embedded in the bitstream of the related image/video format, or performs quality assessment as a hybrid of pixel-based and bitstream-based approaches. A major drawback with most of the existing metrics is their generalizability from their scope of applicability. One of the underlying reasons of the limitation of the scope of a metric is related to design-requirements taken into consideration at the time of development [2], [3]. This limitation is very often not clear or not known for subsequent users of the metrics. Continued advancements in the development of objective metrics are required with the advent of new technologies in video services. HTTP adaptive streaming (HAS) of videos has become quite popular recently and a reasonable number of studies have been conducted to study its characteristic of perceptual quality. A comprehensive review of the state-of-the art of this topic can be found in Chapter 4 of [4]. The authors in [5, 6, 7] analyze the quality of experience of the HAS-based video broadcast model where HAS can adapt to bandwidth and display requirements with a trade-off in video quality. In [8], visual impairments are introduced in HAS videos to asses the subjective quality. These subjective test results can be used to design objective quality metrics. The authors in [9] assess the video quality at the transmission receivers and on the network using packet loss ratio and bit-rate. In [10], the authors propose a two stage model using network level packet characteristics and impact of streaming events where subjective tests are needed to train the model. The authors in [11] propose a full-reference video quality assessment for multi-bit rate video encoding in adaptive streaming applications. In this paper we investigate the following existing objective quality models for their out-of-scope applicability to adaptive video streaming: PSNR, SSIM [12], MS-SSIM [13], VQM [14], VQM-VFD [15], PEVQ [16], and V-BLIINDS [17]. Most
of these methods are of the FR category. The rest of this paper is organized as follows. First, the objective quality models are introduced. This is followed by the details on the test stimuli used to validate the aforementioned methods and details on the benchmark metrics used to compare the performance of various quality assessment methods. Thereafter, a description of the obtained results is provided followed by a discussion on the results and conclusion remarks.
Objective Quality Models The objective quality models that are tested for their out-ofscope applicability to adaptive video streaming is outlined in this Section. The methods are of FR category except when mentioned otherwise in their description.
PSNR The classic and well-known Peak Signal to Noise Ratio (PSNR) is defined as: � PSNR
=
10 · log N
MSE
=
MAX 2 MSE
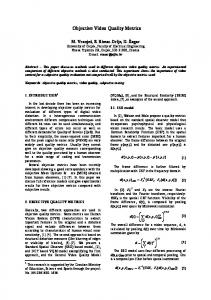
The general Video Quality Model (VQM) is a standardized method of objectively measuring video quality [14]. VQM belongs to the RR category of quality assessment. VQM is based on the following seven parameters. The parameters are presented along with a brief description of the kind of distortion they measure: • si loss: Blurring. • hv loss: A shift of edges from horizontal/vertical orientation to diagonal orientation. • hv gain: Tiling or blocking. • chroma spread: Changes in the distribution of color samples. • si gain: Edge sharpening. • ct ati gain: Moving edge noise. • chroma extreme: Severe local color impairments. The VQM output for a video is a linear combination of these parameters defined as:
� (1)
V QM
�2 1 ∑ ∑ Yi, j − Xi, j NM i=1 j=1
(2)
−0.21 · si loss +0.25 · hv gain +0.02 · chroma spread
SSIM and MS-SSIM The Structural SIMilarity index (SSIM) and the Multi-Scale variant (MS-SSIM) are based on the comparison of luminance1 , contrast and structure similarity [12, 13]. In our experiment, we used the default parameters for both SSIM and MS-SSIM. The SSIM index is defined as: (2µX µY + c1 ) (2σXY + c2 ) � (µX + µY + c1 ) σX2 + σY2 + c2
=
+0.60 · hv loss
M
where MAX is the maximum value a pixel can take (e.g. 255 for 8-bit images) and the MSE is the average of the squared differences between the Luma values of corresponding pixels X and Y , indexed by {i, j}, in the original frame and the test frame, respectively.
SSIM =
VQM and VQM-VFD
(3)
where µ and σ denote the average and the standard deviation of the original image X and the test image Y . σXY is the covariance of X and Y . The two variables c1 and c2 are constants that prevent numerical instabilities. The SSIM index is usually calculated in local Gaussian filtered windows of the images and the overall SSIM index for the test image is then the mean over these windows. In MS-SSIM the images are low-pass filtered and downscaled by a factor of two iteratively up to a highest scale s. The contrast and structure components that are part of the basis for (3) are calculated on each of these scales, while the luminance component, which is the last part of the basis for (3) is calculated only on scale s. The final MS-SSIM value is then calculated as an weighted multiplication of these components. 1 Strictly speaking the luminance are seldom directly represented in an image or video. More commonly used are the Luma values as found in the YUV format.
(4)
−2.34 · si gain +0.04 · ct ati gain +0.01 · chroma extreme After the calculation in (4), the VQM value is clipped at a lower threshold of 0, which represents perfect quality. Finally, a crushing function that allows a maximum 50% overshoot is applied to VQM values over 1 that represents very bad quality. For videos with extreme distortion the VQM output can be higher than 1. The improved version of VQM also accounts for Variable Frame Delays (VQM-VFD) [15], but unlike VQM it does not include color parameters and it belongs to the FR category of quality assessment. The VQM-VFD model is otherwise partly based on parameters similar to those of VQM, including si loss, hv loss, hv gain, and si gain, and partly based on new parameters. The parameters are again presented along with a brief description of the kind of distortion they measure: • • • •
ti gain: Transient distortions. RMSE gain: Root MSE (RMSE) in space-time blocks. V FD Par1: Frame freezing. V FD Par1 · PSNR V FD: The product of temporal and spatial distortions.
In VQM-VFD a neural network is used to map the values of the eight parameters to an overall measure of distortion.
PEVQ and PEVQ-S The Perceptual Evaluation of Video Quality (PEVQ) which is part of the ITU-T. J.247 [16]. It is a FR metric and provides an estimation of Mean Opinion Score (MOS) for the quality of a video. The underlying processing can be broken down into four steps that start with preprocessing to properly align the reference and text videos in spatial and temporal dimensions. Afterwards,
the difference between the reference and test video is perceptually weighted in order to mimic the behavior of a human observer. Subsequently, based on the indicators computed as a result of the previous steps are employed to estimate various degradations. Finally, all the related indicators according to the detected degradations are aggregated to compute the MOS. PEVQ-S, which is part of ITU-T J.343 [18], is a hybrid/bitstream model but can be run without the bitstream and that is what has been done here. The performance is most likely reduced in this case compared to using the full model.
V-BLIINDS Video BLIINDS (V-BLIINDS) is based on a NR and nondistortion specific spatio-temporal model of natural video scenes using natural scene statistics and motion coherency [17]. It is based on the following features, where each entry might cover more than a single value: • • • • •
Motion coherency measure. Global motion measure. Spatio-Temporal Statistical DCT spectral ratios. Absolute temporal derivative of mean DC coefficients. Naturalness Image Quality Evaluator (NIQE) features [19].
The mapping from the feature space to a quality score is performed by using the machine learning method known as support vector regression.
Performance Validation In the proposed work, we use the adaptive bit-rate streaming database introduced in [4, 5, 20]. There are seven source videos in different content types that include smooth to sudden motions, smooth to fast scene changes and various camera configurations. Chunk size is set to both 2 and 10 seconds to analyze the effect of chunk size selection on perception of adaptation scenarios. Three main degradation strategies in the database are increasing, decreasing and constant quality. In total, there are 132 processed video sequences (PVS). After the presentation of each PVS, subjects were asked to select overall quality levels as excellent, good, fair, poor and bad. The PVSs have been extensively tested with different subjective experimental methods, for more details see [4, 5, 20]. The subjective opinions for each PVS are reported as Mean Opinion Scores (MOS) on an integer scale from 5 (excellent) to 1 (bad).
Performance Metrics We follow the reporting guidelines of quality measurements recommended by ITU-T Rec. P.1401 [21] to measure the performance of the metrics. Before the performance evaluation, the scores from all the metrics are mapped to the subjective scores using monotonic regression with 3rd order polynomial function. The used performance measures are briefly described below. Note that the procedures for statistical significance verification, as described in the above mentioned recommendation, were also employed.
Person Linear Correlation Coefficient Pearson Linear Correlation Coefficient (PLCC) is used to measure the linearity of the predicted scores. It is defined as ∑N (MOSi − MOS) × (MOSpi − MOSp) q PLCC = q i=1 , (5) ∑i (MOSi − MOS)2 × ∑i (MOSpi − MOSp)2 where MOS are the Mean Opinion Scores obtained from the observers, MOSp represent the scores predicted by the particular metric (after the monotonic regression), N is the number of stimuli in the dataset, and {.} stands for the averaging operator.
Spearman Rank Order Coefficient A good way to check the monotonicity of the metrics’ behavior is Spearman Rank Order Correlation Coefficient (SROCC) which can be computed as SROCC = 1 −
2 6 ∑N i=1 di , 2 N(N − 1)
(6)
where di represents the difference between the rank of the i-th stimulus in MOS and MOSp, respectively.
Outlier Ratio The consistency of the predictions was verified using Outlier Ratio (OR). The outlier is defined as an estimate where the difference between real and predicted value is higher than its 95% confidence interval, i.e. it has to be true that z × σi |MOSi − MOSpi | > q , Nsubj
(7)
with σi being the standard deviation corresponding to the i-th stimulus, Nsubj is the number of subjects who evaluated this stimulus, and z is 1.96 for Nsubj > 30, otherwise its value is equal to the 95th percentile of the student distribution with Nsubj − 1 degrees of freedom. The final OR value is then n (8) OR = outlier , N where noutlier is the number of outliers in the dataset.
Absolute Prediction Error To measure the accuracy of the objective quality estimates with respect to subjective results, Root Mean-Squared Error (RMSE) is used. It is calculated as v u u 1 N RMSE = t (9) ∑ MOSi − MOSpi . N − 1 i=1
Resolving Power The last employed measure was Resolving Power (RP), described in [22]. It analyses the significance of the metric differences providing the threshold value above which the conditional subjective-score distributions have mean values that are statistically different from each other at a given confidence level. So when two video sequences’ scores differ by more than the resolving power, we have 95% confidence that quality of the video sequences are significantly different.
Table 1: Measures of performance.
PSNR SSIM MS-SSIM VQM VQM-VFD PEVQ PEVQ-S videoBLIINDS
Table 2: Test of significant differences for SROCC.
PLCC SROCC
OR
RMSE RP
0.46 0.55 0.64 0.56 0.69 0.33 0.70 0.02
0.49 0.44 0.39 0.39 0.30 0.51 0.30 0.53
0.53 0.49 0.45 0.49 0.43 0.56 0.42 0.59
0.39 0.54 0.64 0.54 0.67 0.19 0.72 0.02
(1)
0.31 0.25 0.28 0.26 0.23 0.23 0.24 1.00
PSNR (1) SSIM (2) MS-SSIM (3) VQM (4) VQM-VFD (5) PEVQ (6) PEVQ-S (7) V-BLIINDS (8)
(3)
(4)
(5)
(6)
-
(7) -
+ + + +
+ -
-
-
-
+
+ + + + -
+ -
-
-
(8)
-
+ -
Table 3: Test of significant differences for RMSE.
5
(1) 4.5
PSNR (1) SSIM (2) MS-SSIM (3) VQM (4) VQM-VFD (5) PEVQ (6) PEVQ-S (7) V-BLIINDS (8)
4 MOS
(2)
3.5
3
(2)
(3)
(4)
(5)
(6)
(7)
(8)
+ + -
+ -
+ -
-
+ -
2.5
2 2
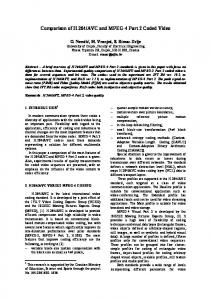
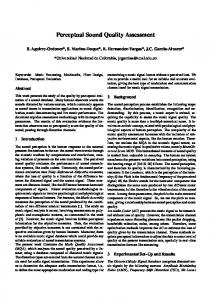
Figure 1.
2.5
3 3.5 4 Fitted VQM_VFD outputs
4.5
5
Scatter plot of VQM-VFD outputs after monotonic regression
versus subjective MOS.
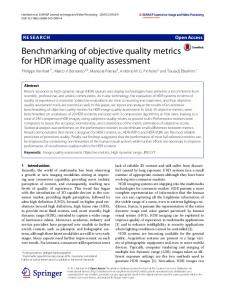
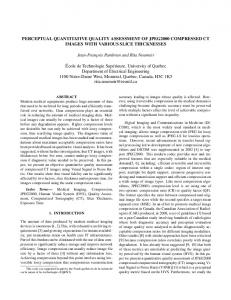
Results The results of the performance metrics are shown in Table 1. The performance of most the quality assessment methods are very poor. With regards to most performance metrics, the best performing method is PEVQ-S and VQM-VFD. It is surprising to see that some of the image-based methods perform better than several of the Video Quality Assessment (VQA) methods. The only NR method in test, V-BLIINDS, seems to perform worst of all. A scatter plot for the best performing method, VQM-VFD, after monotonic regression is shown in Fig. 1 and scatter plots of the predicted quality for all methods before monotonic regression is shown in Fig. 2. It is worth noting the scale of both the subjective study and the objective models. In the subjective study the minimum MOS obtained was around 2, probably partly due to the relatively high minimum bitrate in the experiment. This is reflected in most of the model scores as well, since for most models mostly the portion of the scale corresponding to good quality is used. The trend is somewhat extreme for MS-SSIM, which theoretically can output values between 0 and 1, but for this dataset has no value below 0.9. The exception to this is V-BLIINDS, which even has model outputs outside the original integer range of [0, 100]. Statistical tests to investigate whether the difference in performance is significant or not has been carried out for every performance metric. To safeguard against Type-I errors i.e. false
positives and have an overall 95% significance level, we use the Bonferroni correction method. That is the overall significance level is divided with the number of comparisons performed. In our case we have (72 − 7)/2 = 21 comparisons. The results for the SROCC metric is shown in Table 2 where the + symbol indicates that the row method is significantly better than the column method, while the - symbol indicates the reverse. If no symbol is indicated, there is no statistical significant difference between the column and row method. All other methods except PSNR have significantly better SROCC performance than V-BLIINDS and PEVQ. PSNR is only significantly better than V-BLIINDS. Furthermore, PEVQ-S and VQM-VFD have significantly better SROCC performance than PSNR. A similar table for the RMSE metric is shown in Table 3 and it is evident from the table that there is less statistical differences between the methods with respect to RMSE performance. In this case, PEVQ-S, MS-SSIM, and VQM-VFD significantly outperforms V-BLIINDS, but only PEVQ-S and VQM-VFD significantly outperforms PEVQ.
Discussion Our results show that one cannot directly apply existing quality assessment methods to new problems (in this case ABR videos) and expect good performance. The pitfall here is to apply methods on scenarios outside their original scope. PSNR is inhenerntly designed for pixel-wise fidelity and commonly used in video coding applications because of its simplicity rather then its superiority. SSIM and MSSSIM are originaly introduced for structural similarity in the spatial domain and commonly prefered because of the observation that human visual system is more sensitive to structures rather than pixels. Therefore, it is expected for structural metrics to perform better than
MOS
5
5
5
3
3
3
MOS
1
28
52
1
0.84
0.92 SSIM
1
1
5
5
5
3
3
3
1 0.04
MOS
40 PSNR
0.35 VQM
0.66
1
5
5
3
3
1
2.4
3.9 5.4 PEVQ−S
0.08 0.25 0.42 VQM−VFD
1 −42
1
0.92 0.96 MS−SSIM
2.3
3.65 PEVQ
1
5
45 132 V−BLIINDS
Figure 2. Scatter plots of predictions versus MOS. Solid red line indicates the monotonous regression function. The black dotted line is a straight line from the minimum of the subjective scale and objective scores to the maximum of those values. The values on the horizontal axis denotes the minimum and maximum values of the respective objective metric and the mean hereof (rounded to significant digits).
the pixel-wise fidelity metrics which is the case according to the result in Table 1. However, even the structural simialrity metrics increase the Spearman correaltion by 0.18, the performance enahcement is not statistically significant as given in Table 2. The performance of piexel-wise fidelity and structural metrics are still better than some of the video quality metrics since they are originally trained for different type of distortions. Therefore, we can claim that generalazabilty and domain adaptation is an imporant issue in training-based methods that has to be considered carefully. Some methods, which are more general, are more robust to this (such as PSNR, SSIM, MS-SSIM, VQM, PEVQ-S, and VQM-VFD), while other methods are much more tailored to specific problems. Especially, the NR VQA method V-BLIINDS has very low performance, which might be due to the hard problem of NR VQA and the fact that it has been trained with machine learning on a dataset where the duration of all videos are 10 seconds, without any ABR videos, and subjective opinions reported with Difference Mean Opinion Scores (DMOS). Even
though VQM-VFD also use machine learning, it has been trained on a much larger dataset and might therefore be more robust. The videos in our dataset is of varying length (up to 40 seconds) which is also somewhat unusual, making the quality estimation even more challenging for most of the methods. VQM-VFD achieves the most promising results and it might be worth taking this model as the starting point for a VQA method that is also robust in the context of ABR streaming. We have also reached out to the creators of PEVQ and VBLIINDS to ask for their comments. The creators of PEVQ stated that the dataset used is definitely out of scope for PEVQ that has been trained to predict databases with much more severe transmission errors. In PEVQ-S, although used in a sub-optimal way shows a significant improvement over its predecessor (PEVQ). It is quite likely that method using also the bitstream would show even better performance. The first author of V-BLIINDS has confirmed some of the reasons for low performance as observed above and noted that better performance might be achieved using
a 10s sliding window or retraining the model on this dataset. Both are considered to be out of the scope of this paper. The ranking of the quality metrics in terms of linearity, monotonic behavior, accuracy and outlier behavior are similar to each other wheras the ranking of metrics in terms of resolving power differ significantly. The best performing metrics in all performance measures are PEVQ-S and VQM-VFD but other metrics do not follow a similar order. In this work, we only investigate the applicability of existing objective quality metrics for adaptive video streaming. However, while desinging a metric, we should consider the tradeoff between different performance criterias because it may not be possible to enahnce the performance in all categories and we may need to focus on the criterias that are critical for the target application.
[6]
[7]
[8]
Conclusion Adaptive video streaming has gained profound popularity recently but we lack in possessing suitable objective methods of its perceptual quality assessment. Upon experimenting with existing objective methods for their applicability on such videos, we observed that these methods, which are known to perform well otherwise, severally fall short in accuracy in this case. This necessitates further explorations into the development of new objective approaches specialized for quality assessment of adaptive video streaming. This work can be extended in several directions. Based on the reported finding of our work, more experiments can be performed to learn on how to optimize the functionality of existing objective quality metrics. Moreover, future works should also pay attention to consider test stimuli encoded with the new video coding standard HEVC for which different approaches of objective quality estimation have already started to be published [23].
Acknowledgment The economic support for Acreo’s work from VINNOVA (Swedens innovation agency) and EIT Digital are hereby gratefully acknowledged.
[9]
[10]
[11]
[12]
[13]
[14]
[15]
References [1] M. Shahid, A. Rossholm, B. L¨ovstr¨om, and H.-J. Zepernick, “No-reference image and video quality assessment: a classification and review of recent approaches,” EURASIP Journal on Image and Video Process., vol. 2014, no. 1, pp. 1–32, 2014. [2] M. Barkowsky, I. Sedano, K. Brunnstr¨om, M. Leszczuk, and N. Staelens, “Hybrid video quality prediction: Re-viewing video quality measurement for widening application scope,” Multimedia Tools and Applications, 2014. [3] I. Sedano, K. Brunnstr¨om, M. Kihl, and A. Aurelius, “Fullreference video quality metric assisted development of noreference video quality metrics for real time network monitoring,” EURASIP Journal on Image and Video Process., 2014. [4] S. Tavakoli, “Subjective QoE analysis of HTTP adaptive streaming applications,” Ph.D. dissertation, Universidad Politecnica de Madrid, 2015. [5] S. Tavakoli, K. Brunnstr¨om, K. Wang, B. Andr´en, M. Shahid, and N. Garcia, “Subjective quality assessment
[16]
[17]
[18]
[19]
[20]
[21]
[22]
of an adaptive video streaming model,” in IS&T/SPIE Electronic Imaging, 2014. M. Shahid, J. Søgaard, J. Pokhrel, K. Brunnstr¨om, K. Wang, S. Tavakoli, and N. Garc´ıa, “Crowdsourcing based subjective quality assessment of adaptive video streaming,” in Proc. Int’l Workshop on Quality of Multimedia Experience (QoMEX), 2014. S. Tavakoli, S. Egger, M. Seufert, R. Schatz, K. Brunnstr¨om, and N. Garcia, “Perceptual quality of HTTP adaptive streaming strategies: Cross-experimental analysis of multilaboratory and crowdsourced subjective studies,” IEEE Journal on Selected Areas in Comm. (JSAC), in press (2016). D. C. Robinson, Y. Jutras, and V. Craciun, “Subjective video quality assessment of HTTP adaptive streaming technologies,” Bell Labs Technical Journal, vol. 16, no. 4, pp. 5–23, March 2012. W. Leister, S. Boudko, and T. H. Røssvoll, “Adaptive video streaming through estimation of subjective video quality,” Int’l Journal on Advances in Systems and Measurements, vol. 4, no. 1 & 2, 2011. J. Xue, D.-Q. Zhang, H. Yu, and C. W. Chen, “Assessing quality of experience for adaptive HTTP video streaming,” ICME Workshop, 2014. P. I. Hosur and P. Costa, “Objective video quality assessment for multi bit rate adaptive streaming,” in IEEE Int. Symp. on Consum. Electron, 2012. Z. Wang, A. C. Bovik, H. R. Sheikh, and E. P. Simoncelli, “Image quality assessment: From error visibility to structural similarity,” vol. 13, no. 4, pp. 600–612, 2004. Z. Wang, E. P. Simoncelli, and A. C. Bovik, “Multi-scale structural similarity for image quality assessment,” in IEEE Asilomar Conf. on Signals, Systems and Computers, 2003. M. H. Pinson and S. Wolf, “A new standardized method for objectively measuring video quality,” IEEE Trans. on Broadcasting, vol. 50, no. 3, pp. 312–322, 2004. M. H. Pinson, L. K. Choi, and A. Bovik, “Temporal video quality model accounting for variable frame delay distortions,” IEEE Trans. on Broadcasting, vol. 60, no. 4, pp. 637– 649, Dec 2014. Int’l Telecom. Union, “Objective perceptual multimedia video quality measurement in the presence of a full reference,” in ITU-T Rec. J.247, 2008. M. A. Saad, A. C. Bovik, and C. Charrier, “Blind prediction of natural video quality,” IEEE Trans. on Image Process., vol. 23, no. 3, pp. 1352–1365, 2014. Int’l Telecom. Union, “Hybrid perceptual bitstream models for objective video quality measurements,” in ITU-T Rec. J.343, 2014. A. Mittal, R. Soundararajan, and A. C. Bovik, “Making a completely blind image quality analyzer,” IEEE Signal Proc. Letters, vol. 20, no. 3, pp. 209–212, 2013. S. Tavakoli, K. Brunnstr¨om, and N. Garcia, “About subjective evaluation of adaptive video streaming,” in Proc. Human Vision and Electronic Imaging, 2015. Int’l Telecom. Union, “Statistical analysis, evaluation and reporting guidelines of quality measurements,” in ITU-T Rec. P.1401, 2012. Int’l Telecom. Union, “Method for specifying accuracy and
cross-calibration of video quality metrics (VQM),” in ITU-T Rec. J.149, 2004. [23] M. Shahid, J. Panasiuk, G. V. Wallendael, M. Barkowsky, and B. Lovstrom, “Predicting full-reference video quality measures using HEVC bitstream-based no-reference features,” in IEEE Int’l Workshop on Quality of Multimedia Experience (QoMEX), 2015.
Author Biography Jacob Søgaard received the B.S. degree in engineering, in 2010, and the M.S. degree in engineering, in 2012, from the Technical University of Denmark, Lyngby, where he is currently pursuing his Ph.D. degree with the Coding and Visual Communication group at the Department of Photonics. His research interests include image and video coding, image and video quality assessment, visual communication, and machine learning in the context of Quality of Experience. Luk´asˇ Krasula graduated at Czech Technical University in Prague in 2013. Currently he is a double degree Ph.D. student at Czech Technical University in Prague and University of Nantes. His research interests are oriented to image and video post-processing, compression, and quality assessment for security and multimedia applied imaging systems. Muhammad Shahid received his PhD in Applied Signal Processing and MSc in Electrical Engineering from Blekinge Institute of Technology, Sweden in 2014 and in 2010 respectively. His research interests include video processing, video quality assessment, and objective and subjective methods of video quality assessment. Dogancan Temel received the M.S. degree in Electrical and Computer Engineering with a minor in Management from Georgia Institute of Technology, U.S.A. in 2013 where he is currently pursuing the PhD degree with a minor in Computer Science. His research interests include image and video quality assessment and enhancement, computational aesthetics and color processing through feature design and learning-based approaches. Kjell Brunnstr¨om, Ph.D., is a Senior Scientist at Acreo Swedish ICT AB and Adjunct Professor at Mid Sweden University. He is an expert in image processing, computer vision, image and video quality assessment having worked in the area for more than 25 years. Currently, he is leading standardisation activities for video quality measurements as Co-chair of the Video Quality Experts Group (VQEG). His current research interests are in Quality of Experience for visual media in particular video quality assessment both for 2D and 3D, as well as display quality related to the TCO requirements. Manzoor Razaak is currently pursuing his Ph.D. at Kingston University.