Application-Level Optimizations on NUMA Multicore Architectures: the Apache Case Study Fabien Gaud
Renaud Lachaize
Baptiste Lepers
INRIA
[email protected]
Grenoble University
[email protected]
CNRS
[email protected]
Gilles Muller
Vivien Quéma
INRIA
[email protected]
CNRS
[email protected]
Abstract Multicore machines with Non-Uniform Memory Accesses (NUMA) are becoming commonplace. It is thus becoming crucial to understand how the resources they provide can be efficiently exploited. Most current research works are tackling the problem at the Operating System (OS) level. They focus on improving existing OS primitives, or on proposing novel OS designs with the aim of reducing OS bottlenecks and improving the scalability of applications running on such machines. In this paper, we adopt a complementary perspective: we examine how to optimize the scalability of a parallel application running on top of an unmodified, currently available operating system. The chosen application is the popular Apache-PHP stack. We highlight three performance issues at different levels of the system due to: (i) excessive remote memory accesses, (ii) inefficient load dispatching among cores, and (iii) contention on kernel data structures. We propose and implement solutions at the application-level for each issue. Our optimized Apache-PHP software stack achieves a 33% higher throughput than the base configuration on a 16-core setup. We conclude the paper with lessons learned on optimizing server applications for multicore computers.
1.
Introduction
Multicore machines with Non-Uniform Memory Accesses (NUMA) are becoming commodity platforms and efficiently exploiting their resources remains an open research problem. As a central concern over the last years, this question has mainly been tackled at the Operating System (OS) level. Novel runtime [Saha 2007, Zeldovich 2003, Zhuravlev 2010] and kernel [Baumann 2009, Boyd-Wickizer 2008] designs are being proposed and refined for this specific issue, and recent works on the adaptation of traditional kernel ar-
chitectures also shows encouraging signs [Boyd-Wickizer 2010]. This paper adopts a complementary perspective. Namely, we examine what can be done at the level of a parallel application in order to optimize its scalability on top of a currently available operating system. The approach is motivated by several reasons. First, it can provide application users with means to overcome OS scaling problems, while waiting for their long-term fixes. Second, it is not clear yet that all OS scalability issues can be ultimately addressed without requiring hints and efforts from application programmers. In any case, a thorough understanding of application scalability heuristics is a prerequisite for the development of improved OS mechanisms and policies. Last, even if OS designs successfully overcome the overheads of multicore hardware management, many performance issues will remain within applications. Therefore, it is very important to provide developers with simple ways to identify bottlenecks in application-level code. As a concrete example, we focus on a Web server application. An efficient exploitation of multicore hardware is of utmost importance in this context. Indeed, absorbing more client requests per machine should allow reducing the number of nodes in a datacenter, thus minimizing infrastructure, administration and energy-related costs. More precisely, we study the performance of the Apache-PHP [Apache, PHP] software stack, on a 16-core (4-die) NUMA machine with the realistic SPECweb2005 [SPEC a] benchmark. We choose these software components because they are widely deployed1 , feature-rich (and thus complex) and known for their good performance results. One could expect this stack to scale nicely, given its inherent parallelism and the readonly profile of the workload. However, we notice a 26% performance drop when increasing the number of dies from 1 1 According to a recent survey, Apache accounts for 57% of the Web servers
on the Internet [Netcraft 2010].
to 4. We identify several causes of inefficiencies and we provide a set of optimizations to address them. Our solutions encompass several dimensions: deployment configuration, load balancing strategy and circumvention of kernel bottlenecks. As a result, we achieve a 33% performance increase over the initial configuration of the server, only 5% short from the ideal scalability with respect to the 1-die setup. This paper makes the following contributions: (i) it provides insights on the scalability bottlenecks of a popular software stack on recent NUMA multicore hardware with a realistic workload, (ii) it describes application-level strategies to overcome these performance limitations, (iii) it describes the methodology that allowed us to pinpoint these non-trivial issues and derives several lessons from our experience. The rest of the paper is organized as follows. Section 2 discusses related work. Section 3 provides background information on the hardware and software context. Section 4 describes our testbed. In Sections 5, 6, 7, we describe the analysis of three performance issues, as well as their solutions. Section 8 summarizes our key methodological lessons. Finally, Section 9 concludes the paper.
2.
Related work
Several research projects have focused on making operating systems more scalable on multicore architectures. The central idea consists in minimizing contention on software and hardware resources by avoiding unnecessary sharing between cores. New kernels have been proposed with respect to this concern. K42 [Krieger 2006] features internal data structures optimized for scalability. Corey [Boyd-Wickizer 2008] provides application programmers with flexible constructs to express sharing requirements and placement of kernel services. The multikernel model [Baumann 2009], implemented by the Barrelfish OS, pushes this approach further, advocating to design a multicore kernel like a distributed system. Over the last decade, many scalability improvements have also been introduced into more traditional kernels like Linux (e.g. [Bryant 2004, Kleen 2009]). In a very recent analysis [Boyd-Wickizer 2010], researchers from MIT study the scalability of Linux on a manycore platform using a set of representative system applications. They identify and fix a set of bottlenecks, and conclude that, on the current generation of hardware, traditional OS architectures do not exhibit major obstacles to scalability. Some papers have provided general advice for scaling systems software (e.g. [Cantrill 2008, McDougall 2005]). They discuss a set of guidelines such as the careful choice and usage of synchronization primitives, basic hints to understand scaling issues, architectural patterns to avoid resource contention (e.g., deploying many small-scale, independent instances of a given application) and optimized memory allocators. Our work leverages some of this knowledge and focuses on a concrete case study, with advanced details on profiling and some specific bottlenecks.
A substantial body of work has strived to study and improve the performance of network servers (e.g. [Nahum 2002, Pariag 2007]) but only a small fraction of them has considered multicore setups (e.g. [Jinmei 2006]). A few papers have brought contributions to the specific domain of multicore Web servers. Choi et al. [Choi 2005] compare the performance of several server designs on parallel hardware. Their study considers several real-world traces but is only performed on a simulator using a simple hardware and application model. Besides, they focus on workloads with static content and large ratios of disk I/Os. In contrast, we consider a real platform with an in-memory data set and we take dynamic content generation into account. Our work has strong connections with the study by Veal and Foong [Veal 2007], which considers the scalability of the Linux-ApachePHP stack on an 8-core Intel architecture with a centralized memory controller. They conclude that their address bus is the primary obstacle to performance scaling and masks software bottlenecks. However, our hardware setup is significantly different, with twice as many cores, a NUMA design and a substantially increased network capacity. These changes have a huge impact on the behavior of the system. Thus, our profiling methodology considers more parameters and most of our observations are different. Moreover, we propose solutions to address the discovered bottlenecks. Finally, note that the authors of Corey and Barrelfish have used simple, home-made Web servers among their test applications. Besides, Apache is one of the applications that is benchmarked in [Boyd-Wickizer 2010] and was also used in a case study of DProf [Pesterev 2010]. In all four cases, the Web server was benchmarked with a simple workload, as the goal of the experiment was mostly to stress the kernel I/O subsystems. Our study provides another perspective, focusing on the combined impact of (i) the interactions with a complex component such as PHP, and (ii) a different, more realistic workload.
3.
Background
In this section, we present the hardware architecture on which we performed our study. We then describe the architecture of the Apache Web server and precisely explain the mapping of request flow processing on the benchmarked hardware. 3.1
Hardware architecture
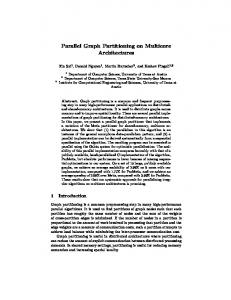
The measurements were performed on a Dell PowerEdge R905 machine. The overall architecture of the system is summarized in Figure 12 . This machine has four AMD Opteron 8380 processors with four cores in each, leading to a total of sixteen cores (in the remainder of this paper, we use the terms processor and die interchangeably). Each core is clocked at 2.5 GHz, has private L1 and L2 caches 2 Note
that, for the sake of readability, MCT, crossbar and caches are only represented on one die, but are present in all dies.
DRAM
DRAM I/O 24 Gb/s
C0
C8
C12
L1 L1
L1
L1
L2
L2
L2
L2
C4
61 Gb/s
L3
24 Gb/s
Die 0
C10
C14
C11
Crossbar
C15
MCT
Die 1
24 Gb/s Die 3
Die 2
C6
C7
24 Gb/s
24 Gb/s
C2
C3
24 Gb/s
DRAM
C1
I/O C5
C9
C13
24 Gb/s
DRAM
Figure 1. Internal architecture of the benchmarked server. (of 64 and 512 KB, respectively) and shares a 6 MB L3 cache with the three other cores of the same die. The machine has 32 GB of DDR2 RAM at 667 MHz, organized in four NUMA memory nodes (one node per socket, 8 GB per node). Using a microbenchmark, we measured a peak throughput of 61 Gb/s between a memory controller and a local memory bank. Dies communicate (for I/O, memory and cache coherence requests) using HyperTransport (HT) 1.0 links, with a measured peak throughput of 24 Gb/s. The messages are routed statically across sockets (e.g., messages sent from die 0 to die 3 always transit through die 1) through the processors crossbars. Memory accesses are performed by the memory controller (MCT). The memory controller is also responsible for the cache coherence protocol. Finally, the machine has 20 Gigabit Ethernet ports (Intel Pro/1000 PT cards). NICs are connected to either die 0 or die 3. Our architecture is not fully symmetric in terms of memory connections. Dies 0 and 3 are closer to I/O devices but have a less efficient connectivity to some memory banks. More precisely, two dies (1 and 2) have access to all memory banks with a maximum of 1 hop (fast dies) and the other two (0 and 3) with a maximum of two hops (slow dies). This comes from the fact that there is an HT link connecting dies 1 and 2, but there is no HT link connecting dies 0 and 3. 3.2
Apache/PHP architecture
Apache can use three different execution modes: Worker, Prefork and Event. In our experiments, we use Apache in its most deployed mode: Worker. This design uses a combination of processes and threads. All processes behave in the same way, except for the first spawned process (called master). Each process dedicates one thread to accept new connections and maintains a pool of worker threads to process incoming requests. The master process is responsible for the creation and destruction of other processes according to the current load of the server. More precisely, when the number of idle threads is below a configurable threshold (25 in our configuration), the master forks. The child process in-
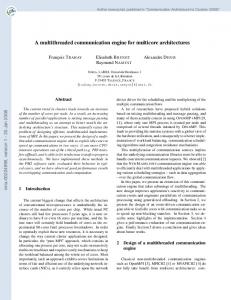
herits the main process’ sockets and starts accepting new incoming connections, concurrently with previously spawned processes. The child process keeps the master updated on its number of idle worker threads via a shared data structure (scoreboard) in memory. When the server has too many idle threads (250 in our configuration), the master sends a message in a pipe that is shared between processes. The process that first receives the message finishes processing its ongoing requests and exits gracefully. Worker threads handle static and dynamic requests in different ways. Static requests are handled using the sendfile system call. sendfile transmits files directly over the network from the buffer cache in a zero-copy manner. Dynamic requests are handled by a fixed number of PHP processes3 spawned at the creation of the server. PHP processes interact with Apache using the FastCGI protocol. More precisely, all PHP processes concurrently wait for incoming FastCGI requests on the same Unix socket. Each FastCGI request is received by exactly one PHP process that handles the request and sends the resulting page to Apache. The performance of the above-described request processing flows for static and dynamic content are impacted by the underlying hardware architecture. The main points of interaction between these two levels are depicted in Figures 2.a and 2.b for static and dynamic requests, respectively. Note that Figure 2 assumes that all the files are present in memory (which is the case in the benchmarked configuration), therefore no disk I/O is represented. For both static and dynamic requests, the incoming TCP packet may travel across one or more HT links from a NIC to a kernel buffer (step 1). Once processed by the kernel, the HTTP packet is handled by an Apache process running on a possibly different die (step 2). Dynamic requests need an extra step to interact with a PHP process which may be located on a remote die (step 2’). This step induces data copies in the Unix socket. Steps 3 and 4 correspond to the sendfile or write system calls for static and dynamic requests, respectively4 . In both cases, a DMA read request is initiated (step 3), which is then performed by the NIC (step 4). Static files sent via the sendfile system call may be located on any memory bank. Consequently, the memory accesses performed by the NIC may target a die different from the one that initiated the transfer in step 3. In contrast, on our NUMA kernel, buffers allocated by the write system call for dynamic requests are always local to the Apache process which initialized the transfer in step 3. This is why we observe on Figure 2.b that step 4 involves die 0, which is the die that initiated the transfer in step 3.
3 We
observed that the PHP process manager decreases the performance of the Web server. We do thus use a static configuration for PHP. 4 For simplicity, we omit to describe the emission of the HTTP reply header which consists in a write system call. The steps needed to perform this operation are similar to steps 3 and 4 of dynamic requests.
C0
C0
4
Die 3
Die 2
Die 1
Die 0
Die 1
2
C5
2'
3
Die 0
DRAM
DRAM
DRAM
DRAM
1
3
2 Reply
4
Die 3
Die 2 1
NIC
C10
Reply
NIC
C10
DRAM
DRAM
DRAM
Request
(a)
DRAM
Request
(b)
Figure 2. Steps needed to process (a) static requests and (b) dynamic requests.
4.
Testbed and performance baseline
In this section, we present the SPECweb2005 workload. We then present our experimental testbed and explain how we tuned the Linux-Apache-PHP stack to achieve the best possible performance. Finally, we evaluate the scalability of this setup on SPECweb2005 and conclude that the LinuxApache-PHP stack is 26% less efficient in the 4-die setup than in the 1-die setup. 4.1
Workload
Our performance evaluation is based on the well-established SPECweb2005 benchmark, which provides a closed-loop client injection module, as well as server-side scripts and data files modeling a realistic Web workload. SPECweb2005 includes three workloads: Support, E-commerce and Banking. We choose to focus on the Support workload for several reasons. First, it spends more time than the other workloads in the Web server (in contrast to other workloads that spend time, e.g., in cryptographic libraries). It is therefore more likely to expose bottlenecks in the Web server. Moreover, this workload induces less CPU-intensive processing in the Web server. Consequently, it may be harder for the Web server to fully leverage hardware parallelism under this load. Finally, this workload stresses several OS functions, as it generates the most intensive networking load. For practical reasons, we slightly modify the default settings5 : the dirscaling option is set to 0.0625, leading to a total data set of 12 GB. Consequently, all the files fit in the buffer cache, which allows avoiding disk I/Os. This choice is in line with current trends in data center design [Ousterhout 2010]. This modification was also employed by Veal and Foong in their study [Veal 2007]. We use the performance metric defined by SPECweb2005. This metric considers the number of 5 As
a consequence, our results cannot be compared to vendor published, formally accepted SPEC results.
clients that can be handled per second, while ensuring a minimum quality of service (QoS) level. This level is defined as follows: 95% of the requested pages must be sent back to the client in a good time (below 3 seconds), 99% in a tolerable time (below 5 seconds), and less than 0.5% of the requests can fail (e.g. raise errors like “connection refused”). In addition, the average download bitrate for static files must be greater than 99 KB/s and 95 KB/s for good and tolerable requests, respectively. For each benchmarked configuration, we use a binary search in order to determine the maximum number of clients that can be handled by the server, while still ensuring the minimum QoS level. The minimal step used in the binary search is 25 clients per core (i.e. 100 clients per die). Finally, note that each SPECweb2005 result reported in this paper is the average of 5 runs and that the observed deviation between them was always smaller than 0.5%.
4.2
Testbed
We run the Apache Web server on the Dell PowerEdge R905 machine described in Section 3. Note that for setups using less than 16 cores, we disable unused cores. We perform load injection using a set of 22 dual core machines equipped with 2 GB of main memory and a 1 Gb/s network card. These machines are interconnected with a non blocking, 48port Gigabit Ethernet switch. Each machine is executing two instances of the SPECweb2005 module, which allows running up to 2000 SPECweb2005 clients per machine. Each machine can send HTTP requests to all the network interfaces of the server. Interfaces are actually chosen in a roundrobin manner. SPECweb2005 uses a pseudo backend server (BeSim) to simulate the database tier. Like [Veal 2007], we deploy one BeSim instance on each client machine. For each experiment, we systematically check that the BeSim tier is not a bottleneck.
4.3
Linux configuration
We use the Linux kernel version 2.6.34 with NUMA support and Glibc version 2.7. We carefully tune networking parameters to ensure that the network is never the bottleneck in our experiments. More precisely, we configure IRQs so that each die handles 5 network cards and we carefully configure various TCP parameters as described in [Veal 2007]. Finally, we increase the maximum pid value (kernel.pid_max) in order to ensure that Apache can create enough threads to handle all requests. 4.4
Apache/PHP configuration
We use Apache 2.2.14 and PHP 5.2.12. As previously mentioned, all the benchmark files are preloaded in main memory. To avoid overloading some dies, we equally balance files among the four available memory banks. We also disable the access log in order to avoid disk I/Os6 . We carefully tune Apache and PHP to make sure that the server achieves the best possible performance. Table 1 presents the performance impact of the main configuration parameters defined in Apache/PHP. The first line corresponds to our best configuration. Other lines correspond to Apache configurations in which all but one parameters are similar to the best configuration. The modified parameter is indicated in the first column. The benchmark is performed using 6600 SPECweb2005 clients per die, which is the maximum number of clients that can be handled by our best configuration. Apache allows configuring the maximum number of connections that can be concurrently served. Our best configuration does not set such a limit. Indeed, we observe a performance degradation when doing so (see Table 1, Line 2). This is not surprising as this induces an increase in the latency perceived by some clients, and does thus decrease the number of clients that are served in a good or tolerable time7 . Apache also allows configuring the number of threads per process. We set this number to 64, which is the highest possible value. Decreasing this value degrades performance (see Table 1, Line 3). We explain this degradation by the fact that decreasing the number of threads per process induces an increase in the number of Apache processes, which in turn induces a higher number of address space switches. Moreover, we configure Apache to use the sendfile system call. This system call prevents costly buffer copies between the user and kernel spaces. We observe (see Table 1, Line 4) that disabling the usage of sendfile drastically decreases the performance of Apache: the percentage of good requests drops to 27.9%. 6 Note
that in a recent benchmark [SPEC b], authors are getting around I/O limitations by using a very large number of disks (55 disks in RAID0, 7 of which dedicated to logging). We did not have a similar hardware setup at our disposal, hence our choice to load all files in memory. 7 Note that in a production environment, the maximum number of clients that can be concurrently served is typically configured using the results of benchmarks such as SPECweb2005.
Regarding PHP, we set the number of PHP processes to 500 in all our experiments. Indeed, we observe that decreasing or increasing this value had a negative impact on the performance (see Table 1, Lines 5 and 6). Finally, we configure the server to use eAccelerator, a byte-code cache that allows compiling PHP scripts only once. Disabling eAccelerator heavily hurts performance (see Table 1, Line 7). Configuration 1 2 3 4 5 6 7
Best Max concurrent connections = 0.9x(Max SPECweb connections) Nb of threads per process = 32 Sendfile disabled Nb of PHP processes = 150 Nb of PHP processes = 750 eAccelerator disabled
Good (%) 97.5
Tolerable (%) 99.9
93.6 94.1 27.9 91.3 94.3 11.2
95 99.8 94.8 97.6 98.1 11.3
Table 1. SPECweb results at 4 dies with 6600 clients per die. To be valid, a run must have more than 95% of its requests served in good time and 99% in tolerable time. 4.5
Performance baseline
We evaluate the performance of the Linux-Apache-PHP software stack configured using the parameters described in the previous sections. This configuration is called stock Apache in the remainder of the paper. As scalability unit, we choose to consider the die rather than the core. The reason is that, as noted in [Boyd-Wickizer 2010], using a single-core configuration as the baseline might be misleading regarding the scalability potential of the system. Indeed, cores located on the same die compete for shared cache space, which prevents the system from achieving a perfect scalability (for instance, we observe on the SPECweb2005 workload that the L3 miss ratio grows from 8% to 14% when increasing the number of cores from 1 to 4). The performance results for the stock Apache configuration are presented in the first line of Table 2. Note that since dies are not symmetrical, when less than 4 dies are used in experiments, we present averaged results of runs executed on the various die combinations. For instance, the performance reported for the stock Apache configuration on 1 die (8900 clients) is the average of the performance achieved when Apache runs on a slow die (8600 clients) and of the performance achieved when Apache runs on a fast die (9200 clients). Table 2 shows that with 4 dies, the number of clients per die that can be processed (6600 clients) is 26% lower than the number of clients that can be served when only one die is used (8900 clients). In the following three sections, we pinpoint three performance problems and provide solutions for them. We first consider a decrease in the efficiency of memory accesses and mitigate it by co-localizing cooperative processes and guiding decisions of the scheduler (Section 5). Next, we ad-
1 2 3 4
Configuration Stock Apache Apache with optim. 1 Apache with optim. 1+2 Apache with optim. 1+2+3
Nb clients 8900 8900 8900 9300
1 die Gain/Stock (%) N/A 0 0 4.5
Nb clients 7900 7700 8100 8800
2 dies Gain/Stock (%) N/A -2.5 2.5 11.4
Nb clients 6600 7200 8000 8800
4 dies Gain/Stock (%) N/A 9.1 21.2 33.3
Table 2. All Apache configurations: SPECweb2005 results and improvement of the various optimizations over the stock Apache configuration at 1, 2, and 4 dies. dress load balancing issues by taking the hardware asymmetry into account (Section 6). Finally, we identify and circumvent contention issues in the OS layer (Section 7).
5.
First optimization: reducing remote memory accesses
In this section, we present our first optimization to improve the performance of Apache on NUMA multicore platforms. We explain how we diagnosed a first source of inefficiency: a large number of remote memory accesses. We then introduce a solution to the problem: modifying the application architecture so that Apache processes only interact with PHP processes and network processing stacks located on the same die. Finally, we show that this first optimization yields a 9% performance improvement in the 4-die setup. 5.1
Problem diagnosis
The scalability issue observed in the previous section does not come from an injection problem: the server CPUs are fully loaded, network links are not saturated and injectors are not overloaded. The first metric we use to understand the performance drop observed at 4 dies is the number of instructions issued per core cycle (IPC). The IPC metric is related to the performance of memory accesses. Indeed, cores might get stalled when waiting for data, thus reducing the number of instructions that can be issued per cycle. We measure the IPC under the maximum SPECweb2005 client load that can be handled while guaranteeing the minimum QoS level defined by the benchmark. We report the average IPC on all active cores in Table 3. This table shows that the average IPC is significantly lower (-21%) at 4 dies than at 1 die. Note that, similarly to what we do for SPECweb2005 results, when less than 4 dies are used in experiments, we present averaged results of runs executed on the various combinations of dies. Configuration 1 die 4 dies
Average IPC 0.38 0.30
Table 3. Stock Apache: average IPC. The observed IPC drop is due to an increase in memory access latencies. This phenomenon has three main possible causes: (i) a decreased efficiency of the processor caches (i.e.
a poorer cache hit ratio) due to true or false sharing between dies, (ii) a higher number of remote memory accesses per transmitted byte (i.e. accesses performed by a core to a memory bank located on another die), and (iii) a higher pressure on the HT links and/or on local memory buses. We now study each of the above-described causes in turn. Cache efficiency. We measure the number of L1, L2, and L3 cache misses per transmitted byte as well as their miss ratio8 . We do not observe any reduction in cache efficiency: the numbers of L1, L2, and L3 cache misses per byte remain constant between 1 and 4 dies. Moreover, the L1, L2 and L3 cache miss ratios remain stable at 2%, 19% and 14%. Consequently, the IPC drop cannot be attributed to a decrease in cache efficiency. Remote memory accesses. We measure the percentage of remote accesses and the number of remote accesses per transmitted kilobyte9 . Results are presented in Table 4. We observe that the number of remote accesses per kilobyte drastically increases (+250%). This means that every single request induces a very large number of remote memory accesses with respect to the single-die configuration. Moreover, the number of remote memory accesses exceeds the number of local accesses when using 4 dies (67% of the accesses are remote). We conclude that the increase of remote memory accesses is a possible cause of the IPC drop observed in the 4-die setup. Configuration 1 die 4 dies
Remote accesses (%) 21 67
Remote accesses/kB 4 14
Max HT usage (%) 25 75
Table 4. Stock Apache: ratio of remote memory accesses, number of remote memory accesses per transmitted kB, and maximum HT link usage. Utilization of HT links and memory buses. We monitor the HyperTransport (HT) link utilization. During a benchmark run, we measure the usage of all HT links and report 8 The
profiled hardware events are, for example, “L3 cache misses” and “Read Request to L3 Cache”. 9 The profiled hardware event is “CPU to DRAM Requests to Target Node”.
the value of the link that exhibits the highest average usage10 . Maximum HT link usages are reported in Table 4. We observe that no bus is saturated, but that HT link usage drastically increases (+200%), growing from 25% at 1 die to 75% at 4 dies. This could explain the IPC drop observed in the 4-die setup. To better understand the origin of the HT link traffic, we measure the percentage of this traffic that is caused by NICs’ DMA transfers11 . This profiling reveals that at most 27% of the HT traffic is due to DMA transfers. The major share of this traffic can thus be attributed to the memory accesses (and the corresponding cache coherence traffic) performed by the cores. Unfortunately, we cannot present numbers for the usage of local memory buses (i.e. buses connecting the MCT to the DRAM). The reason is that our machine does not provide hardware events to determine this metric. However, we believe that these buses are not a main cause of the IPC drop observed in the 4-die setup. Indeed, these buses have a much higher capacity (2.5x) than the HT links and the majority of memory transfers also transits through HT links (67% of memory accesses are remote memory accesses). 5.2
Solution
In section 5.1, we identified two correlated reasons for the IPC drop observed in the 4-die setup: a drastic increase of both remote memory accesses and maximum HT link utilization. Remote accesses have three main origins. First, they result from shared memory interactions between Apache processes (e.g. Apache scoreboard written by all threads). Second, they stem from communications between the different components of the Web server (detailed in Section 3 and represented in Figure 2). Third, they arise from interactions between the application and the kernel services (especially the networking stack). A first way to limit the number of remote accesses and the pressure on HT links is to force an Apache thread to only cooperate with a PHP instance running on the same die. Unfortunately, this approach only addresses one of the three problem causes: it ensures that communications between the different components of the Web server will be local. Moreover, note that these communications only account for 35.6% of all remote accesses. Therefore, we choose another solution. This solution consists in deploying one Apache instance per die, rather than a single instance for the whole server. For each Apache instance, the child processes, threads and their associated PHP processes are pinned on the same die. This can be achieved using Linux taskset without modifying the Apache Web server. Each Apache instance handles a 10 The
profiled hardware events are “HyperTransport Link X Transmit Bandwidth”, where X ranges between 0 and 2 since each die has exactly 3 HT links (see Figure 1). The HT link usage is computed as explained in [AMD 2010]. 11 The profiled hardware events are “CPU to DRAM Requests to Target Node” and “IO to DRAM Requests to Target Node”.
DRAM
DRAM
2
Die 0
Die 1
Die 2
Die 3
2' C2
C6
4 1
C10
DRAM
3
Reply
NIC
DRAM
Request
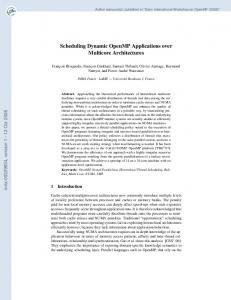
Figure 3. Steps needed to process a dynamic request with our first optimization. fixed set of NICs, in order to co-localize the processing performed by both the network processing stack and the application. Figure 3 illustrates the processing of a dynamic request with the above-described configuration. It shows that steps 2 and 2’ are now localized on the same die. In this way, most remote memory interactions are avoided. The only remaining remote data accesses are the communications with I/O links and DMA transfers (steps 1, 3 and 4). 5.3
Evaluation
We evaluate the gain brought by the optimization described in the previous section. Results are reported in Table 2 (second line). The optimization yields a 9% performance improvement for the server with 4 dies compared to stock Apache. As expected, this optimization has no visible effect when only 1 die is used. More surprisingly, we observe a slight performance decrease (-2.5%) for the 2-die configuration compared to stock Apache. This behavior is explained in Section 6. We check the impact of the optimization on the metrics studied in Section 5.1. We first assess the average IPC. Results are reported in Table 5. As expected, we observe that the IPC of the 1-die setup is not modified. In the 4-die setup, we observe an increase (+19%) with respect to the stock Apache configuration. The average IPC in the 4-die setup is now only 5% lower than in the 1-die setup. Configuration 1 die 4 dies
Average IPC 0.38 0.36
Table 5. Apache with the first optimization: average IPC. We also assess the number of remote memory accesses per transmitted kilobyte to SPECweb2005 clients and the maximum HT link usage. Results are reported in Table 6. As expected, we observe that the proposed optimization drastically reduces the number of remote memory accesses per transmitted kilobyte (-64%) and that most memory accesses are now local (73% compared to 33% on the stock Apache
setup). Regarding the maximum HT link usage, the improvement is much smaller (-13%). The reason is that the HT link traffic does not only stem from remote software memory accesses. It also stems from DMA transfers and the cache coherence protocol that are not influenced by the optimization. Configuration 1 die 4 dies
Remote accesses (%) 21 27
Remote accesses/kB 4 5
Max HT usage (%) 25 65
Table 6. Apache with the first optimization: ratio of remote memory accesses, number of remote memory accesses per transmitted kB, and maximum HT link usage.
6.
Second optimization: adequately dispatching load on dies
In this section, we present our second optimization to improve the performance of Apache. This section starts by diagnosing a problem: load is not adequately dispatched on dies, which causes fast dies to be idle 15% of the time. We then propose to solve this problem using an external load balancer responsible for properly dispatching incoming requests on the dies. Finally, we show that Apache running with the first two optimizations is 21.2% more efficient than the stock Apache configuration in the 4-die setup. 6.1
Problem diagnosis
Results reported in Table 2 show that Apache running with the first optimization is 19% less efficient at 4 dies than at 1 die. As done in Section 5, we first check that CPUs are fully loaded, network links are not saturated and injectors are not overloaded. We actually observe that CPUs are not fully loaded. More precisely, dies 0 and 3 are fully used (CPU usage is at 100% during the whole benchmark duration), but dies 1 and 2 are idle 15 % of the time. In contrast, remember that we observed in Section 5.1 that with the stock Apache configuration, all CPU were used at 100%. To understand the causes of the idleness observed on certain dies, let us remember that the first optimization forces all processes handling a request to be located on the same die. This is illustrated in Figure 3: the processing of the request is entirely located on die 2. There is some traffic going to the NIC connected to die 3, but this traffic does not induce any processing on die 3. As a result, some dies may become idle. This is in contrast with the stock Apache configuration, in which dies that do not receive requests can participate in the processing of requests received by other dies. This is illustrated in Figure 2.b: the request is received on die 2, but it also involves processing on dies 0 and 1. In addition, in the stock Apache configuration, the Linux scheduler can freely dispatch processes handling the requests on the various dies. This is not the case when the first optimization is used because all processes handling a request are forced to be local-
ized on the die that manages the NIC12 on which the request was received. Forcing requests to be processed by a single die leads to CPU underutilization if load is not adequately dispatched on dies. As explained in Section 4, in the case of SPECweb2005, the load is injected by a set of clients issuing requests in a closed-loop manner. An important point is that clients target a different server NIC for each connection they issue. The NICs are chosen in a round-robin manner, which works well only when dies process requests at the same speed. If one die is slower than the others, then load injection will be constrained by the speed of the slowest die13 . To check whether we face this case or not, we separately compute the performance achieved by the different dies. We observe that, performance-wise, dies can be classified into two groups: slow dies (i.e. dies 0 and 3) and fast dies (i.e. dies 1 and 2). SPECweb2005 results and average CPU usage are reported in Table 7. Results show that with 6800 clients, slow and fast dies achieve identical results in terms of the ratio of good and tolerable requests observed by clients. When increasing the number of clients, the ratio of good and tolerable requests achieved by slow dies drops. This comes from the fact that slow dies are overloaded and requests spend time in server queues, which increases the latency perceived by clients. In contrast, the performance achieved by fast dies remains constant. This is explained by the fact that load is injected at a constant rate, which is constrained by the speed of slow dies. Note that the gray line represents the maximum number of clients that can be served, while ensuring SPECweb2005’s minimum QoS level.
Nb Good clients (%) 6800 99.9 7200 99.6 8000 15.4 8800 8.7
slow dies Tol. (%) 100 100 90 8.5
CPU (%) 95 100 100 100
Good (%) 99.9 99.9 99.9 99.9
fast dies Tol. CPU (%) (%) 100 82 100 85 100 85 100 85
Table 7. Apache with the first optimization: SPECweb2005 results and CPU usage with round-robin injection on slow and fast dies (4-die setup). A first and simple approach to solving the abovedescribed problem is to replace the round-robin selection of NICs by a fixed assignment of NICs to clients. Results obtained with this approach are reported in Table 8. We observe that the maximum number of clients that can be served is still equal to 7200 (gray line). More interestingly, we observe that the injected load is no longer constrained by the speed of slow dies: the load on fast dies increases when the number 12 Recall
that NICs are physically connected to dies 0 and 3, but that each die manages a fixed set of NICs. 13 This is a consequence of the fact that load is injected in a closed-loop manner: clients wait to receive a reply before issuing a new request.
of clients increases. This solution is nevertheless not satisfying because load is homogeneously dispatched on slow and fast dies, regardless of their capability.
Nb Good clients (%) 6800 100 7200 99.9 8000 69.6 8800 24.4
slow dies Tol. (%) 100 100 99 85.2
CPU (%) 92 99 100 100
Good (%) 100 100 99.7 53.4
fast dies Tol. (%) 100 100 100 97.8
CPU (%) 85 95 100 100
Table 8. Apache with the first optimization: SPECweb2005 results and CPU usage with fixed injection on slow and fast dies (4-die setup).
6.2
Solution
Real-world Web infrastructures usually rely on one or more Web switches to dispatch load between multiple Web servers [Cardellini 2002]. We decided to extend this existing facility to efficiently dispatch load among dies. Since each Apache instance is responsible for its own set of NICs, the load balancer considers each set of interfaces as a different machine. It does thus balance the load in the same way as is done with distinct physical machines. Note that since we did not have another machine able to handle a 20 Gb/s network traffic, we implemented the load balancing mechanism at the client-side. The implementation is similar to a classical layer 4 two-way request routing mechanism [Cardellini 2002]: the choice of the target die is entirely performed in a content-blind manner, and only depends on the estimated current load of the dies. This load is evaluated using the number of pending requests on each die. Note that this mechanism could be integrated with no extra cost in a cluster-scale load-balancing solution. 6.3
Evaluation
We have evaluated the load dispatching optimization. We report in Table 9 the SPECweb2005 results at 4 dies, as well as the CPU consumption. The maximum number of clients that can be served is now equal to 8000 (gray line). Moreover, slow and fast dies exhibit the same CPU usage. This proves that the load dispatching strategy is efficient. Results at 1, 2 and 4 dies, as well as improvement over the stock Apache configuration, are reported in Table 2 (third line). We observe that, at 4 dies, this optimization improves performance by 11% compared to Apache running with the first optimization, and by 21% compared to the stock Apache configuration. Finally, let us remark that the load dispatching problem identified in this section was the source of the very small performance hit (-2.5%) observed at 2 dies when Apache only runs the first optimization (Table 2, second line).
Nb Good clients (%) 6800 99.9 7200 99.9 8000 97.8 8800 25.4
slow dies Tol. (%) 100 100 100 97.8
CPU (%) 90 98 100 100
Good (%) 100 100 98.9 54
fast dies Tol. CPU (%) (%) 100 90 100 98 100 100 98 100
Table 9. Apache with the first and second optimizations: SPECweb2005 results and CPU usage on slow and fast dies (4-die setup).
7.
Third optimization: removing software bottlenecks
The first two optimizations presented in this paper consists in avoiding inefficient utilization of hardware resources. In this section, we focus on software bottlenecks. We start by explaining how we profiled the Linux-Apache-PHP software stack to find bottlenecks. More precisely, we present a simple metric and show how we used it to discover a bottleneck: a function located in the Apache core that induces contention within the Linux Virtual File System (VFS) layer by frequently accessing file metadata. We then present a solution, which consists in implementing a cache for file metadata. Finally, we evaluate the proposed mechanism and show that Apache running with the three optimizations is 33.3% more efficient than the stock Apache configuration in the 4die setup. 7.1
Problem diagnosis
Software bottlenecks are caused by functions exhibiting a performance drop from a 1-die to a 4-die setup. The performance of a function can be measured using the number of cycles spent in the function per byte transmitted to the clients. A function is more efficient at 1 die if it spends less cycles per transmitted byte than at 4 die. Let N CP Bf1_die (resp. N CP Bf4_dies ) be the number of cycles spent in a function f per transmitted byte at 1 die (resp. 4 dies). Moreover, let P Cf4_dies be the percentage of cycles that are spent in function f at 4 dies. We define the potential performance gain of function f , noted P P Gf , as the improvement that would be observed if function f was as efficient at 4 dies as at 1 die. The potential performance gain of function f is expressed in percentage of cycles and is defined as:
P P Gf =
N CP Bf4_dies − N CP Bf1_die N CP Bf4_dies
× P Cf4_dies
To illustrate this metric, let us consider the case of a function f which requires 2 cycles per transmitted byte at 1 die and 10 cycles per transmitted byte at 4 dies. Function f is 5 times less efficient at 4 dies than at 1 die. If the percentage of cycles spent in function f at 4 dies is 20%, then the potential performance gain of function f is
P Gf = 10−2 10 × 20% = 16%. This means that if function f was as efficient at 4 dies as at 1 die, the performance of the overall system at 4 dies would be 16% better. It is important to note that the potential performance gain of a function f only accounts for the cycles spent executing instructions defined within function f : it does not take into account the cycles spent in functions called by f . The potential gain metric has been defined in such a way on purpose. Otherwise, this is always the “root” function that would have the highest potential performance gain. This information would not help finding bottlenecks. We have computed the potential performance gain of all functions used in the Linux-Apache-PHP stack. Functions with the highest potential performance gains are depicted in Table 10. We observe that all the listed functions belong to the OS kernel and libraries. Recall that our goal is to resolve problems at the application level (i.e. Apache or PHP). In order to detect such bottlenecks, we look for the applicationlevel functions that are responsible for the higher number of calls to functions listed in Table 10. To perform this task, we created a profiler based on sampling, which registers complete function call chains. We found out that a function belonging to the core of Apache accounts for 45% of the calls to the functions of the VFS layer referenced in Table 10. This function is called ap_directory_walk. In the next section, we explain how we modified the Apache Web server to reduce the number of calls to that function. Function Potential performance gain (%) __d_lookup 2.49% _atomic_dec_and_lock 2.32% lookup_mnt 1.41% copy_user_generic_string 0.83% memcpy 0.76%
Table 10. Apache with the first and second optimizations: highest potential performance gains in the LinuxApache-PHP stack. 7.2
Solution
In order to improve the efficiency of Apache, the first step is to understand the behavior of the ap_directory_walk function. This function is about 730 lines long and it took us less than 2 days to grasp its principle. This function performs the following tasks: it retrieves information about the requested file (size and last modification time) and checks that the server has the right to process the current request. This consists in checking that the requested file exists, and in walking through the file’s directory hierarchy to look for configuration files and to check the directories’ access rights. We can remark that two calls to ap_directory_walk with the same request as argument will return the same result as long as configuration files and directories are not modified. Consequently, a way to improve the performance of Apache is to cache the results of calls to ap_directory_walk. Be-
fore calling the function, Apache checks whether a similar request has already been processed. If this is the case (i.e. the result is found in the cache), then Apache allows the request to be processed without executing the function. We use the inotify kernel subsystem to monitor changes in the file system and invalidate cache entries that are no longer valid. Note that files served by SPECweb are read-mostly and directory permissions never change. Caching the results of the ap_directory_walk is thus very efficient. We believe that this is also the case in most production servers, in which a majority of files remain in a steady state and most mutable data are stored in databases. 7.3
Evaluation
We evaluated the performance gain brought by this third optimization. Results are reported in Table 2 (fourth line). At 4 dies, this optimization improves performance by 10% compared to Apache with the first two optimizations, leading to an overall 33% improvement compared to the stock Apache configuration. Note that, when used in the 1-die setup, the cache also allows skipping calls to ap_directory_walk. This explains why this optimization (contrarily to the other ones) also slightly improves the performance at 1 die (+4.5%).
8.
Lessons learned
As pointed out by other researchers [Hardesty 2010, Pesterev 2010], the major difficulty of multicore performance troubleshooting is often to clearly identify the root cause of a problem rather than to come up with an effective solution. In the course of our study, we faced a number of practical and methodological difficulties in this regard. This section provides a summary of the main lessons derived from our experience. Obtaining accurate profiling results is difficult. We ran into a number of problems when trying to profile the system with Oprofile [OProfile]. First, calibrating the accuracy of the tool was not trivial. On the one hand, Oprofile was not able to support high sampling frequencies (it frequently reported that samples were lost, which was confirmed by highly-variable results). On the other hand, it was tedious to determine a sampling rate that was both achievable and insightful. Second, under high load, it was difficult to start and stop sampling at precise points in time. This resulted in inaccurate results, because samples could accidentally be collected during warm-up and ramp-down phases of the benchmark. Increasing the priority of Oprofile (using Linux scheduling groups) did not solve this problem. In order to avoid these issues, we developed lightProf, a lightweight profiler that periodically dumps the values of some hardware events associated with timestamps. This profiler is not based on frequency sampling: it reads and dumps exact values of hardware events (e.g. absolute number of L3 misses since the beginning of the profiling) and does not re-
quire any calibration. Since timestamps are associated with the dumped values, warm-up and ramp-down phases of the benchmark can also be easily wiped off when analyzing results. Exhaustive profiling is not possible. Hardware-related issues are especially hard to find due to the amount of possible bottlenecks. Our machine has 123 configurable hardware events to detect such issues and most of them can be further specialized with unit masks. Moreover, it is only possible to monitor 4 hardware events per core at the same time. Besides, multiplexing these counters in order to improve the number of events is not a panacea since, from our experience, it greatly reduces the accuracy of the results. Consequently, testing and analyzing results for all these events is not a viable option, especially when each experiment runs for a long time (tens of minutes in our case). We started with a global performance metric, the IPC, to convince ourselves of potential hardware-related issues. It then took us some time to determine a set of essential hardware events for every part of the machine (caches, HT links, etc.) and for the main interactions between these parts (e.g. remote memory accesses due to software and I/O). We ended up with a pool of 37 specialized hardware events which gives a global overview of the machine. These data allowed us to compute all the metrics used in this paper (HT link usage, cache misses, memory accesses, etc.) in order to spot inefficient usage of hardware resources. Pinpointing issues requires multiple viewpoints. The previous step provides a summarized view of possible hardware symptoms and considers software as a black box. This step may not always be sufficient to track down a performance bottleneck, either because the pathological usage of hardware resources cannot be easily explained or because it is a purely software problem. In such a situation, it is necessary to precisely determine the most relevant portions of code to be considered and improved. From our experience, this search cannot always be easily achieved by only considering the evolution of the time spent in particular functions. Two other indicators are of a crucial help in this process: the potential performance gain (as defined in Section 7.1) and the call chains, used to find which functions are calling poorly scalable functions. We implemented a custom profiler, based on the Performance Analysis Utility available in the kernel tree, to easily compute the potential performance gain metric and the complete function call chains.
9.
Concluding remarks and discussion
In this paper, we have illustrated the importance of application-level optimizations on NUMA multicore machines. We have described the methodology employed to diagnose three performance bottlenecks on the Apache Web server and we have proposed solutions that are simple to implement by application developers. Our optimized stack
yields a 33% performance gain and almost reaches perfect scalability from 1 to 4 dies. We believe that the remaining 5.4% performance difference is due to the slight decrease of IPC between 1 and 4 dies and to minor software bottlenecks. Below, we discuss some additional points concerning related and future work. Applicability of our results. We believe that the conditions leading to the memory problems we observed are not specific to our machine, but rather present in many other current and upcoming hardware architectures. Indeed, most multiprocessor architectures released nowadays are not perfectly symmetric. As an example, Baumann et al. [Baumann 2009] describe a 32-core machine where some dies need 4 hops to access memory while others only need a maximum of 2 hops. Moreover, emerging architectures such as Intel’s SCC [Intel] introduce even more asymmetry between cores: some of them have no 0-hop access to memory. Furthermore, we intend to evaluate the server behavior with other workloads and, in particular, under open and partially-open loop injections models [Schroeder 2006]. We expect the hardware asymmetry to still have a noticeable impact in such contexts. Partitioned design. Our strategy using multiple Web server instances in order to improve parallel performance has been employed in the past. Previous works [Boyd-Wickizer 2010, Pesterev 2010] have described setups where each core runs a pinned Apache instance. In the present paper, we highlight an additional benefit of this approach on NUMA systems: mitigating the negative effects of heterogeneous memory access performance. We also show that it requires careful dispatching of the load on the different dies. Besides, we note that such a partitioned application deployment is a natural fit for new architectures like SCC, which do not feature hardware-managed cache coherence. OS-level considerations. Very recent research by Boyd et al. [Boyd-Wickizer 2010] also pinpointed bottlenecks in the VFS layer and proposed kernel-level reengineering to limit contention on the directory cache. Unfortunately, the kernel patches described in the above-mentioned paper are not publicly available yet. It would be interesting, as future work, to study how this patched kernel and our simple applicationlevel optimizations respectively impact the server performance. Moreover, inspired by previous work on hardware performance counters [Tam 2007, Zhuravlev 2010], we also plan to investigate how some of our profiling guidelines could be integrated within the logic of an operating system, so as to facilitate performance diagnosis and improve resource management.
References [AMD 2010] AMD. BIOS and Kernel Developer’s Guide For AMD Family 10h Processors (rev 3.48), 2010.
[Apache ] Apache. The Apache HTTP Server Project. http: //httpd.apache.org. [Baumann 2009] Andrew Baumann, Paul Barham, Pierre-Evariste Dagand, Tim Harris, Rebecca Isaacs, Simon Peter, Timothy Roscoe, Adrian Schuepbach, and Akhilesh Singhania. The multikernel: a new OS architecture for scalable multicore systems. In Proceedings of the 22nd ACM symposium on Operating systems principles (SOSP), October 2009. [Boyd-Wickizer 2008] Silas Boyd-Wickizer, Haibo Chen, Rong Chen, Yandong Mao, Frans Kaashoek, Robert Morris, Aleksey Pesterev, Lex Stein, Ming Wu, Yuehua Dai, Yang Zhang, and Zheng Zhang. Corey: An Operating System for Many Cores. In Proceedings of the Symposium on Operating Systems Design and Implementation (OSDI), December 2008. [Boyd-Wickizer 2010] Silas Boyd-Wickizer, Austin Clements, Yandong Mao, Aleksey Pesterev, M. Frans Kaashoek, Robert Morris, and Nickolai Zeldovich. An Analysis of Linux Scalability to Many Cores. In Proceedings of the Symposium on Operating Systems Design and Implementation (OSDI), October 2010. [Bryant 2004] Ray Bryant, John Hawkes, Jack Steiner, Jesse Barnes, and Jeremy Higdon. Scaling Linux to the Extreme: From 64 to 512 Processors. In Proceeding of the Linux Symposium, July 2004. [Cantrill 2008] Bryan Cantrill and Jeff Bonwick. Real-world concurrency. Queue, 6(5):16–25, 2008. [Cardellini 2002] Valeria Cardellini, Emiliano Casalicchio, Michele Colajanni, and Philip S. Yu. The State of the Art in Locally Distributed Web-Server Systems. ACM Computing Surveys, 34(2):263–311, 2002. [Choi 2005] Gyu Sang Choi, Jin-Ha Kim, Deniz Ersoz, and Chita R. Das. A Multi-Threaded PIPELINED Web Server Architecture for SMP/SoC Machines. In Proceedings of the 14th International Conference on World Wide Web (WWW), 2005. [Hardesty 2010] L. Hardesty. Linux and Many-Core Scalability? No Problem, Say Researchers., 2010. http://www.drdobbs. com/open-source/227501025. [Intel ] Intel. Single-chip Cloud Computer http: //techresearch.intel.com/articles/Tera-Scale/ 1826.htm. [Jinmei 2006] Tatuya Jinmei and Paul Vixie. Implementation and evaluation of moderate parallelism in the BIND9 DNS server. In Proceedings of the USENIX Annual Technical Conference, 2006. [Kleen 2009] Andi Kleen. Linux Multi-core Scalability. In Proceedings of the Linux Kongress, October 2009. [Krieger 2006] Orran Krieger, Marc A. Auslander, Bryan S. Rosenburg, Robert W. Wisniewski, Jimi Xenidis, Dilma Da Silva, Michal Ostrowski, Jonathan Appavoo, Maria A. Butrico, Mark F. Mergen, Amos Waterland, and Volkmar Uhlig. K42: building a complete operating system. In Proceedings of the ACM European Conference on Computer Systems (EuroSys), 2006. [McDougall 2005] Richard McDougall. Extreme software scaling. Queue, 3(7):36–46, 2005. ISSN 1542-7730. [Nahum 2002] Erich Nahum, Tsipora Barzilai, and Dilip D. Kandlur. Performance issues in www servers. IEEE/ACM Transaction
on Networking, 10(1), 2002. [Netcraft 2010] Netcraft. Web Server Survey, 2010. http://news.netcraft.com/archives/2010/09/17/ september-2010-web-server-survey.html. [OProfile ] OProfile. A System Profiler for Linux http:// oprofile.sourceforge.net. [Ousterhout 2010] John Ousterhout, Parag Agrawal, David Erickson, Christos Kozyrakis, Jacob Leverich, David Mazières, Subhasish Mitra, Aravind Narayanan, Guru Parulkar, Mendel Rosenblum, Stephen M. Rumble, Eric Stratmann, and Ryan Stutsman. The case for RAMClouds: Scalable HighPerformance Storage Entirely in DRAM. SIGOPS Operating Systems Review, 43(4):92–105, 2010. [Pariag 2007] David Pariag, Tim Brecht, Ashif Harji, Peter Buhr, and Amol Shukla. Comparing the Performance of Web Server Architectures. In Proceedings of the ACM European Conference on Computer Systems (EuroSys), June 2007. [Pesterev 2010] Aleksey Pesterev, Nickolai Zeldovich, and Robert T. Morris. Locating Cache Performance Bottlenecks Using Data Profiling. In Proceedings of the European conference on Computer systems (EuroSys), 2010. [PHP ] PHP. Hypertext Preprocessor. http://www.php.net/. [Saha 2007] Bratin Saha, Ali-Reza Adl-Tabatabai, Anwar Ghuloum, Mohan Rajagopalan, Richard L. Hudson, Leaf Petersen, Vijay Menon, Brian Murphy, Tatiana Shpeisman, Eric Sprangle, Anwar Rohillah, Doug Carmean, and Jesse Fang. Enabling Scalability and Performance in a Large Scale CMP Environment. In Proceedings of the ACM European Conference on Computer Systems (EuroSys), June 2007. [Schroeder 2006] Bianca Schroeder, Adam Wierman, and Mor Harchol-Balter. Open Versus Closed: a Cautionary Tale. In Proceedings of the 3rd conference on Networked Systems Design & Implementation (NSDI), May 2006. [SPEC a] SPEC. (Standard Performance Evaluation Corporation). SPECweb2005. http://www.spec.org/web2005/. [SPEC b] SPEC. (Standard Performance Evaluation Corporation). SPECWeb2005 Results. http://www.spec.org/web2005/ results/res2010q1/web2005-20100310-00146.html. [Tam 2007] David Tam, Reza Azimi, and Michael Stumm. Thread clustering: sharing-aware scheduling on smp-cmp-smt multiprocessors. In Proceedings of the ACM European Conference on Computer Systems (EuroSys), 2007. [Veal 2007] Bryan Veal and Annie Foong. Performance Scalability of a Multi-Core Web Server. In Proceedings of Architectures for Networking and Communications Systems (ANCS), December 2007. [Zeldovich 2003] Nickolai Zeldovich, Alexander Yip, Frank Dabek, Robert Morris, David Mazières, and M. Frans Kaashoek. Multiprocessor Support for Event-Driven Programs. In Proceedings of the USENIX Annual Technical Conference, June 2003. [Zhuravlev 2010] Sergey Zhuravlev, Sergey Blagodurov, and Alexandra Fedorova. Addressing shared resource contention in multicore processors via scheduling. In Proceedings of the International Conference on Architectural Support for Programming Languages and Operating Systems (ASPLOS), 2010.