Conversion of Unusedland to Food Land in Minahasa ... evaluation criteria in order to determine conversion of unused .... capital and marketing support.
International Journal of Computer Applications (0975 – 8887) Volume 89 – No 8, March 2014
Application of AHP Method in Determining Priorities of Conversion of Unusedland to Food Land in Minahasa Tenggara Adi Setiawan
Eko Sediyono
Dirk A. L. Moekoe
Faculty of Science and Mathematics, Satya Wacana Christian University Jl. Diponegoro 52-60 Salatiga, Indonesia
Graduate School of Information System, Satya Wacana Christian University Jl. Diponegoro 52-60 Salatiga, Indonesia
Student of Graduate School of Information System, Satya Wacana Christian University Jl. Diponegoro 52-60 Salatiga, Indonesia
ABSTRACT This paper discusses the problem of how to identify the evaluation criteria in order to determine conversion of unused land into food land in Minahasa Tenggara and how to determine priorities of food commodities targeted districts as new food in Minahasa Tenggara using AHP method. The results showed that food commodities recommended in the conversion of unused land into food land is corn commodity. Corn became a major priority for qualified technical and non technical evaluation criteria food land. Districts that are in top priority is the district Touluaan where eight variables land evaluation of food, both technical and non - variable technically qualified with the highest priority as a target districts over the land. District Silian Raya and Pasan are two districts with the lowest priority (the lowest composite score) due to the low capacity of the soil, difficulty in accessing the area and access to the required technology.
Keywords Analytic hierarchy process (AHP), unused land, food land, Minahasa Tenggara.
1. INTRODUCTION Research application of analytic hierarchy process (AHP) method in conversion of unused land into land for food in Minahasa Tenggara aims to assess and to map the existing agricultural resources and is intended to provide decisionmaking tools for policy makers and implementers of development, in utilizing appropriate resources, in the context of food security and to increase in the number of public welfare 30.7 % of the population works in the agricultural sector [1]. According to the Security and Vulnerability Map of Food or Food Security and Vulnerability Atlas (FSVA) 2009, Minahasa Tenggara (data is included in the Minahasa Selatan as a district parent) included in the district food security conditions are relatively very safe [2]. This is consistent with the data in Figures 2012 Minahasa Tenggara, which illustrates that the Minahasa Tenggara as a whole is in a high food surplus. Conditions domestic food production surplus over consumption ratio of cereal production compared with consumption of 4.60 (five times greater production than consumption). Conditions of surplus food production is not directly proportional to the welfare of society in which there is still 17.65 % of the population living below the poverty line. Access individual/household to food, to economic social and
physical food security are key factors that is needed to optimize the utilization of unused land to improve poor people's access to food. Appropriate safeguards required in opening a new food land. In 2011, the Food and Agriculture Organization (FAO) renew the land evaluation models that have been released previously, namely the principles in land evaluation [3]. This model considers only technical criteria, while decision-making in land clearing by farmers is also determined by non - technical variables such as economic benefits gained by the opening of the land. Therefore, in addition to technical variables, variables nontechnical directly related to the effort to move and build a farm described by Mosher, also considered as criteria in the prioritization of land use [4]. Determination of the priority factors of new food land evaluation criteria using Analytic Hierarchy Process (AHP). AHP method is used because it is an effective approach in decision-making to describe the problems that are complex and multi-criteria in selecting the best alternative from a set of alternatives [5] [6]. Output is produced in the form of food commodities and factors priority target districts clearing new food, which is a recommendation for local governments in order expansion of food and increased food production areas. The problem in this research are how to identify the opening of the evaluation criteria in order to determine conversion of unused land into food land in Minahasa Tenggara; and how to set the priority of food commodities and land clearing priority target districts new food in Minahasa Tenggara district using AHP method.
2. LITERATURE REVIEW 2.1 Previous Research Research on the use of AHP as a decision support models (Decision Support Model) that supports decision-making in agriculture and food security at various levels of decisionmaking both at the operational, tactical and strategic among them : - The article titled Farming Differentiation in the Rural urban Interface of the Middle Mountains, Nepal : Application of Analytic Hierarchy Process (AHP) Modeling [6]. This study investigated the dominant differentiation factor farm by using AHP method in the rural-urban interface in the Kathmandu Valley are pockets of vegetable production supplying a large amount of vegetables in the city. Four and 7
37
International Journal of Computer Applications (0975 – 8887) Volume 89 – No 8, March 2014 criteria agricultural factors causing variations be included within the AHP framework and assessment (judgment) by farmers for agricultural practices priotitas determination described in 3 agricultural zones. The four criteria are : biophysical aspects, business (enterprise), market and resources. Seven factors/sub-criteria : accessibility, yield, quality, request (demand), price, agro - ecological considerations (agro - ecological considerations) and the availability of resources (resource availability). Three agricultural zones subsistence zone, inorganic commercial zone and the organic smallholder zone. According to him, the quantification factor in the agricultural zone differentiation by using AHP can be used for modeling applied to agriculture in the rural-urban interface in developing countries are characterized by high diversity of farming practices where land use pattern changes fast. - The article titled Accelerating Diversification Based Food Local Food Consumption : Perspectives and Strategies Achieving Local Officials [7]. This study was conducted in 3 provinces (West Sumatra, Central Java and Southeast Sulawesi), with the aim of reviewing the diverse perceptions of stakeholders in each of the priority areas and formulate appropriate strategies towards accelerating the diversification of food consumption based on local food. AHP method is used to determine the priority criteria, factors and strategies for achievement. Supporting diversification criteria specified acceleration are : infrastructure, stakeholders, potential areas of local food, and the level of participation and synergism program. Determinants : food security institutions, policy / action programs, budgets, the role of government, the private sector, the role of academics, the role of the community store, production potential, the potential of industrial, consumer acceptance, intersectoral collaboration and community participation. While the achievement of strategies : institutional performance and capacity enhancement of human resources, increased commitment, roles and partnerships among stakeholders, dissemination of potential information, the nutritional quality of processed food products and a variety of local, local food and business growth through capital and marketing support.
2.2 AHP as a Decision Support Model Analytic Hierarchy Process (AHP) is a decision support models developed by Thomas L. Saaty in the 1970s. Its development is based on human judgment ability to construct hierarchical perception of a multi-criteria problem. The decision support model to describe the problem of multi factor or multi- criteria complex and structured into a hierarchy. The hierarchy is defined as a representation of a complex problem in a multi-level multi-storey structure is level objectives, factors, criteria, sub-criteria, and alternative levels. With the hierarchy, a complex problem can be decomposed into their groups are then organized into a hierarchical form so that the problem will appear more structured and systematic [5]. Analytic Hierarchy Process (AHP) is a theory of measurement through pairwise comparisons and relies on the judgment of experts to determine priorities. Comparisons were made using an absolute grading scale that represents, how many, one element dominates another element with respect to the given attributes [5]. AHP has been developed and applied in various fields as well as a widely accepted methodology for decision making. AHP has also been applied in various decisionmaking scenarios [8] : 1.
Choices, choices one alternative from a set of alternatives.
2.
Priority / evaluation, determine the relative merits of a set of alternatives .
3.
Allocation of resources, finding the best combination of alternatives due to various constraints.
4.
Benchmarking, process or system to another, a process known or system.
5.
Quality management.
2.2.1 Basis of AHP axiomatic Analytic Hierarchy Process (AHP) has an axiomatic foundation [9] 1.
Comparison reciprocal, meaning that the pairwise comparison matrix is formed should be the opposite. For example, if A is k times more important than B then B is 1/k times more important than A.
2.
Homogenity, meaning that the similarity in doing comparisons. For example, it is not possible to compare oranges with a tennis ball with a sense of the criteria, it would be relevant to compare in terms of shape (round is a criteria).
3.
Dependence, meaning that each level is concerned (complete hierarchy) although it is possible that the relationship is not perfect (incomplete hierarchy).
4.
Expectation, meaning that is includes assessment expectations and perceptions of decision makers such that the priority is not rationality, but can also be irrational.
2.2.2 Basic Principles of AHP The basic principle of decision-making in the AHP methodology is the problem in the form of hierarchical decomposition (decomposition), the assessment of the relative importance between elements in each hierarchy (comparative judgment), priority synthesis (synthesis of priority), and consistency of assessment (local consistency) [10].
2.2.2.1 Preparation of hierarchy The preparation step of defining the hierarchy problem is a complex issue becomes more clear and detailed in the form of a hierarchy of decision-making process, where each element interconnected. The hierarchy of decision prepared based on the views of the parties who have the expertise and knowledge in the field. Decisions to be taken and used as the destination elements are translated into more detail. If you want to get accurate results, the solution is also made to the elements is not possible to further breakdown. Structure the decision hierarchy can be categorized as complete and incomplete. In making hierarchy there is no limit to the number of levels. If the elements one level harder than, the one level below it simpler with subtle differences that must be created. The hierarchy must be flexible, always can be changed to accommodate the emerging presence of new criteria.
2.2.2.2 Assessment Criteria and Alternatives AHP allows the user to determine the relative weights of the criteria of a compound (or an alternative compound of a criterion) intuitively, by doing pair wise comparisons, then change the pair wise comparisons into a set of numbers that represents the relative priority of each criterion and alternatives in a consistent way [5]. The assessment was performed by the decision makers who are experts in the field
38
International Journal of Computer Applications (0975 – 8887) Volume 89 – No 8, March 2014 of issues that are being analyzed and who have an interest to decision-making by using a rating scale (scale of 1 to 9 and it. Assessment criteria and alternatives do with making the reverse). judgments on the relative importance between the two elements at a certain level in relation to the level above it. This is done through pair wise comparison of elements of Table 1 Pairwise Comparison Assessment Importance Level 1 3 5 7 9 2, 4, 6, 8 Reciprocal
Definition Equal importance Moderate importance Strong importance Very strong importance Extreme importance Intermediate value between above scale values If element i has one of the above nonzeros numbers assigned on it when compared with element j, j has the reciprocal value when compared to i
Explanation Both elements contribute equally to the level intermediately above Judgment slightly favors element i than element j Judgment strongly favors element i than element j Element i is favored very strongly than element j There is evidence affirming that element i is favored than element j Absolute judgment cannot be given and a compromise is required Element i inverse each other with element j
Source: [4]
b1 b2 ... B bj ... b m
Values and opinions qualitative definition of scale comparison is shown in Table 1. Based on these value, compiled a matrix of pairwise comparisons, for example, the following matrix A:
a11 a12 ... a1 j a21 a22 ... a2 j A ... ... ... ... ... ... .... aij a a m1 m 2 ... amj
a1n a2 n ... .... .... .... amn ... ... ...
Add up all elements of the matrix B using the formula Equation 3 : n
b b i 1
where aij is the element of matrix A in the i-th row and the j-th column.
2.2.2.3 Weighting Criteria and Alternatives Weighting is done to produce a weighting factor or eigenvector of the matrix A with the following steps : a. Multiply the matrix A. Value of the matrix element A2 is obtained by the formula in Equation 1 : n
aij aik . akj 2
k 1
where aik is the element of matrix A in the i-th row and the k-th column and akj is the element of matrix A in the k-th row and the j-th column. b. Sum the elements of each row of the matrix A2 in order to obtain a matrix B with the formula in Equation 2 : n
bi aij ai1 ai 2 .... aij ... anj j 1
with bi is the i-th elements of matrix B. Matrix B can be expressed as follows:
i
1
b2 .... bn
c. Based on the above results , further normalization of the matrix B to obtain the eigenvector of the matrix B. Eigenvector matrix B is described in the form of a matrix C in Equation 4 : n b1 / bi i 1 n b / b 2 i i 1 ... C n b j / bi i 1 ... n b / b i m i 1
where ci is the i-th element of matrix elements C. d. All three above process is done repeatedly and at the end of each iteration sought difference eigenvector matrix C obtained by eigenvector matrix C prior to figures obtained are close to zero. The matrix C is obtained in the last step indicates the priority criteria indicated by the eigenvector coefficients.
2.2.2.4 Measurement of Consistency Consistency is an important characteristic of AHP. Assessment criteria between elements with one another is not entirely consistent. AHP allows the assessment inconsistencies but should not exceed 10 %. This
39
International Journal of Computer Applications (0975 – 8887) Volume 89 – No 8, March 2014 measurement is done by aggregating the entire eigenvector obtained from various levels of hierarchy, such that the obtained composite weighted vector which generates a sequence of decision making. Measurement consistency of a matrix based on an eigenvector maximum (λmax). The closer λmax obtained with n, the more consistent results.
CR = CI / RI where CR = ratio of consistency (consistency ratio), RI = random index ( random index ) for a matrix of order n. Maximum eigenvalue of a matrix will not be less than the value of n such that there can be no consistency index (CI) were negative. Comparison between CI and random index (RI) for a matrix is defined as the Consistency Ratio (CR) expressed in Equation 6. Where RI is the average index value generated randomly obtained through experiments using samples with large quantities. Random value index (RI) for the matrix of the order of 1 to 15 as shown in Table 2. Comparison matrix is acceptable if the value of the consistency ratio (CR) < 0.1. Limitation received whether consistency of a matrix is actually no standard . According to some experimentation and experience, the level of inconsistency is 10 % below the level of inconsistency that is still acceptable. More than that there should be a revision of the assessment because the level of inconsistency that is too large can lead to errors [4].
Consistency ratio is obtained by the following steps : a. Calculate λmax of each matrix of order n by summing the multiplication of the number of weights all criteria in each column of the matrix with the principal eigenvector of the matrix. b. Calculating the value of the consistency index for each matrix of order n using the formula : CI = (λmax – n) / (n – 1) where CI = consistency index, λmax = largest eigenvector of a matrix of order n, n = order of the matrix. c . Consistency ratio is calculated by the formula :
Table 2. Random Index N
1, 2
3
4
5
6
7
8
9
10
11
12
13
14
15
RI
0.00
0.58
0.90
1.12
1.24
1.32
1.41
1.45
1.49
1.51
1.48
1.56
1.57
1.59
Source : [5]
2.3 Criteria Used in Land Evaluation In evaluating food land, the criteria used in the criteria considered technical and non-technical.
2.3.1 Technical Criteria Technical criteria consist of variable climatic conditions, availability of water and land capability.
2.3.1.1 Climate Climatic factors, especially rainfall and sufficient levels of rainfall measured by the criteria of necessity evaporation and evapotranspiration , which is derived based on the criteria of the data Oldemand climatic regions. Threshold value of 200 mm rainfall as wet months, the parameters according to the needs of rainfall for rice crop and humid month threshold of 100 mm [11].
2.3.1.2 Availability of Water Although rough water requirements can be derived from the data climatic, but the real conditions in the locality and the need to use real terms the level of society that determines whether the water in the area can sustain various uses of water primarily for agricultural needs.
2.3.1.3 Land Capability Ability of the land is the land suitability in supporting the growth of food crops to be commercialized. The ability of land cover and soil texture topsoil thickness (top soil). Besides, the need to consider the sustainability of land resources in ensuring food production.
2.3.2 Non - Technical Criteria Non-technical criteria consist of variable economic value of food commodities, market demand, technological inputs, access areas and farmers HR.
2.3.2.1 Economic Value The economic value of food crops affect farmers’ motivation in seeking these commodities.
2.3.2.2 Market Demand Market demand and ease in marketing of commodities are cultivated.
2.3.2.3 Input of Technology Ease of access technologies with respect to the commodities sought .
2.3.2.4 Access of Areas Means and adequate transportation infrastructure, to open the isolation region thereby increasing the ease of access to both exit and into the region.
2.3.2.5 Human Resources The ability and skill of farmers in getting food crops.
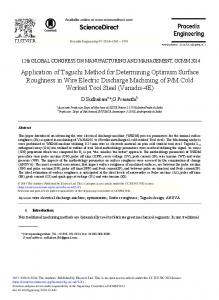
2.4 Hierarchy Prioritizing Land Transfer Function Rooms Become Land of Food Prioritization of land use was a land of food in Minahasa Tenggara structured into a hierarchical form so that the problem will appear more structured and systematic. Land use determination hierarchy consists of four levels / tiers are level goal, criteria, sub - criteria and alternatives level. Level goals are goals that are expected from this study. Level kerupakan criteria is the criteria used in the prioritization of land conversion, which consists of technical criteria and non technical. Level sub - criteria are the variables used in this study, both technically and variable non - technical variables. Level Alternative is an alternative choice decisions a priority in land use was a land of food, be it a priority type of food commodities (three alternative commodities) as well as the priority target location of land use districts (twelve districts).
40
International Journal of Computer Applications (0975 – 8887) Volume 89 – No 8, March 2014
Goal
Criteria Level
Sub-Criteria Level
Decision Level Ratahan
Goal : Prioritization Conversion Unused Land to Food Land
Climate Posumean Technical
Water Availability
Belang Field Rice Ratatotok
Land capability
Tombatu Economic Value
Touluaan Corn Tombatu Utara
Market Demand
Tombatu Timur Nontechnical
Input of Tecnology Casava Access of Area
Touluaan Selatan Silian Raya Ratahan Timur
Human Resource Pasan
Fig 1. Prioritization hierarchy conversion of unused land into food land
3. METHODOLOGY 3.1 Location and Time of Research The research was conducted in Minahasa Tenggara, North Sulawesi, Indonesia from April until September 2013.
3.2 Types and Data Collection Method Data used in this study is primary data and secondary data. The primary data obtained from interviews with experts in the areas concerned are scattered in various welfare institutions in Minahasa Tenggara district and the local community who understands the problem, which is gained through focus group discussions (FGD) with reference to a structured questionnaire. Forum FGD is used for aggregating individual ratings into a single rating that represents a group choice. The participants assessed as expert (expert judgment) in priority setting at each level of the hierarchy is based on the method of AHP, namely the level of criteria, sub - criteria and alternatives. Assessment conducted by experts in the pairwise comparisons of the elements at each level of the hierarchy using the Saaty scale (scale value of 1 to 9), according to the relative importance of elements other than elements in a hierarchy level. Secondary data is data that has been collected and presented by the other party obtained from various agencies / units of work in accordance with the needs of the data in this study in the form of books, reports and other related documents.
3.3 Data Analysis Data obtained from interviews through focus group discussions (FGD) experts in the form of pairwise ratings of importance between the elements to each other on each hierarchy level based on AHP method, processed and
analyzed using Expert Choice software 9.0. The results of the analysis in the form of weights the relative importance of each criteria, sub - criteria and decision alternatives such as to obtain the priority order from a wide selection of alternative objectives (goals) to be achieved is a priority over the function of uncultivated land into food land, be it a priority commodity types and priorities target districts.
3.4 Steps of Research Steps being taken in this research as follows : a) Preparation and initial data collection . At this step, the preparation and initial data collection for the conduct of research. b ) Identification of food land evaluation criteria . Identification criteria and sub - criteria evaluation of food land. c ) Preparation of AHP hierarchy. d ) Assessment pairwise comparisons elements at each level of the hierarchy is based on expert judgment. Assessment carried out by experts based on a hierarchical structure as shown in Figure 1 above. The first level is the goal (goal). Assessment pairwise comparisons performed on the elements in the hierarchy of the second level, i.e. how much the interest rate criteria with each other to achieve the goals set . Then the assessment conducted on the third level in the hierarchy of elements, namely the extent of the interest of the sub criteria with each other with reference to the criteria in the level above it. Assessment is done until the bottom of the hierarchy level that is an alternative decision, how much the
41
International Journal of Computer Applications (0975 – 8887) Volume 89 – No 8, March 2014 interest rate alternative to one another with reference to the above sub-criteria level . e ) Data analysis using Expert Choice software 9.0 Assessment data pairs between elements of importance to each other, processed and analyzed using Expert Choice software 9.0. f ) Weighting the criteria, sub - criteria and alternatives priority commodity crops in land use food. The results of the analysis in the form of weights the relative importance of each criteria, sub-criteria and decision alternatives so as to obtain the priority order from a wide selection of alternative objectives (goals) to be achieved is the priority land use food. g ) Determination of priority land use districts targeted food Prioritization of target districts is done by calculating the index of the eighth variable food land evaluation for each district. The composite index is as follows:
Score 0.81-1.00 : Priority 1 (very appropriate), Score 0.61-0.8 : Priority 2 (quite appropriate), Score 0.41-0.6 : Priority 3 (appropriate), Score 0.21-0.4 : Priority 4 (unappropriate), Score 0.0-0.2 : Priority 5 (very unappropriate). The steps to obtain a composite index of every district are : 1 ) Convert the condition of every district be scored according to predetermined variables in the eighth. Multiply the score of each variable with the variable weights . Do scores of eighth variable multiplication by a weighting factor of each variable for each district (see Table 3). 3 ) Calculate a composite score for each sub-district. Calculation of a total score of eight variables by summing the individual scores of each variable for each district. h ) The report of the research results. The final stage is the preparation of research reports the results of research. Steps of research can be described Figure 2.
Table 3. Score Classification for every variable
No 1 2 3
4 5 6 7 8
Variable Climate Water Availability Land Capability Texture of soil Top soil Economic Value Market Demand Input of Technology Access of Area Human Resources
0.2 < 50 mm Less
0.4 50-99 mm Quite less
Score Classification 0.6 100-199 mm Moderate
0.8 200-300 mm Quite good
1 > 300 mm Good
Rough < 25 cm Low Low Difficult Difficult Less
Quite rough 25-50 cm Quite Low Quite Low Difficult Quite Difficult Quite Less
Moderate 50-70 cm Moderate Moderate Moderate Moderate Moderate
Quite Smooth 70-90 cm Quite High Quite High Quite Easy Quite Easy Quite Good
Smooth > 90 cm High High Easy Easy Good
Preparation and Initial Data Collection Identification of food land evaluation criteria
Preparation of AHP Herarchy Assessment pairwise comparations elements at each level of the hierarchy is based on expert judment Data analysis using Expert Choice software 9.0 Weighting the criteria, sub-criteria and alternatives priority commodity crops in land use food.
Determination of priority land use districts targeted food. Report the result of research Fig 2 : Steps of research
42
International Journal of Computer Applications (0975 – 8887) Volume 89 – No 8, March 2014
4. RESULTS AND DISCUSSION 4.1 Weighting of criteria and sub - criteria with AHP Results of pairwise comparisons assessment of the experts on the two criteria and eight sub - criteria outlined in Table 1 above are normalized in order to obtain the weight of each criteria, sub - criteria and alternatives commodity crops. Retrieved weights of criteria and sub - criteria and priorities for commodity crops cultivated as in Table 4. Technical criteria gets the highest weight with the weight of 0.6250, while the technical criteria and weighs 0.3750. This
greatly affects the criteria in the evaluation of food land. Of the eight sub - criteria, the order of the three sub - criteria with the highest weight is a variable of technical criteria that successive variable land capability, climate and water availability. While the variables of the non - technical criteria have lower weights, which are sequentially access the variable region, the market demand, input of technology, human resources and economic value. Priority alternative food commodities that a recommendation in the conversion of food into land idle land is commodity corn and weighs 0.5166, followed by cassava (0.2456) and field rice (0.2378).
Table 4. Weight of Criteria, Sub-criteria and Alternative Food Commodity Criteria
Weight
Sub-Criteria
Weight
Technical
0.625
Non-Technical
0.375
Climate Water Availability Land Capability Economic Value Market Demand Input of Technology Access of Area Human Resources
0.2199 0.1759 0.2293 0.0143 0.1241 0.0675 0.1362 0.0329
Weight
Priority
0.2378 0.5166 0.2456
3 1 2
Table 5. Weights and Alternative Priorities Food Commodities
4.2 Priority Targets Commodities and the District Land Transfer Function of Food The results of three alternative normalization, obtained by weighting each alternative commodity crops for cultivated land conversion in the bed into a land of food as in Table 5. Priority alternative food commodities that is recommended in the conversion of food in idle land is corn commodity with the highest weight is 0.5166, followed by cassava (0.2456) and field rice (0.2378). Prioritization of target districts in land conversion into food land was done by determining a score for each district deciding eighth variable conversion of unused land into food land. Scores obtained for each district multiplied by a weighting factor of each variable (see Table 4 ). Then calculate a total score of eight variables by summing the individual scores of each variable for each district, in order to obtain a composite score and priority target districts over the function of unused land into food land in Minahasa Tenggara.
Alternative Commodity Field Rice Corn Cassava
Alternative Commodity Field rice Corn Cassava
Weights
Priority
0.2378 0.5166 0.2456
3 1 2
Converting condition every district be scored according to the eighth predetermined variables as in Table 6. The score for each sub-district for each variable, multiplied by a weighting factor variables, in order to obtain a composite score for each district can be defined priority target districts over the land as in Table 7. Composite scores in the above table shows that only one district that composite scores above 0.8 (priority 1), nine districts obtain a composite score above 0.6 and below 0.8 (priority 2), and two districts obtain a composite score above 0.4 and below 0.6 (priority 3).
Table 6. Score of District for Eight Conversion of Land Variable Variable No
District
Climate Water Land Capabilty (weight Availability (0.2293) 0.2199) (0.1759)
Economic Input of Market Demand Value Technology (0.1241) (0.0143) (0.0675)
Access of Human Area Resources (0.1362) (0.0329)
1
Ratahan
0.8
0.8
0.5
0.8
0.8
0.8
0.8
0.8
2
Pusomaen
0.8
0.8
0.4
0.8
0.8
0.4
0.4
0.8
3
Belang
0.8
0.8
0.5
0.8
0.8
0.8
0.8
0.8
4
Ratatotok
0.8
0.8
0.4
0.8
0.8
0.8
0.8
0.8
5
Tombatu
0.8
0.8
0.7
0.8
0.8
0.2
0.2
0.8
6
Touluaan
0.8
0.8
0.8
0.8
0.8
0.8
0.8
0.8
7
Tombatu Utara
0.8
0.8
0.7
0.8
0.8
0.2
0.2
0.8
8
Tombatu Timur
0.8
0.8
0.7
0.8
0.8
0.6
0.6
0.8
9
Touluaan Selatan
0.8
0.8
0.8
0.8
0.8
0.2
0.2
0.8
10 Silian Raya
0.8
0.8
0.2
0.8
0.8
0.2
0.2
0.8
11 Ratahan Timur
0.8
0.8
0.5
0.8
0.8
0.2
0.2
0.8
12 Pasan
0.8
0.8
0.2
0.8
0.8
0.2
0.2
0.8
43
International Journal of Computer Applications (0975 – 8887) Volume 89 – No 8, March 2014 Table 7. Composite Score and District Priority Target Land Conversion Variable No
District
Water Climate Availability
Land Capability
Economic Value
Market Demand
Input of Access of Technology Area
Human Resources
Composite Score
Priority
Ratahan
0.176
0.141
0.115
0.011
0.099
0.054
0.109
0.026
0.731
2
2
Pusomaen
0.176
0.141
0.092
0.011
0.099
0.027
0.054
0.026
0.627
2
3
Belang
0.176
0.141
0.115
0.011
0.099
0.054
0.109
0.026
0.731
2
4
Ratatotok
0.176
0.141
0.092
0.011
0.099
0.054
0.109
0.026
0.708
2
5
Tombatu
0.176
0.141
0.161
0.011
0.099
0.014
0.027
0.026
0.655
2
6
Touluaan
0.176
0.141
0.183
0.011
0.099
0.054
0.109
0.026
0.800
1
7
Tombatu Utara
0.176
0.141
0.161
0.011
0.099
0.014
0.027
0.026
0.655
2
Tombatu Timur
0.176
0.141
0.161
0.011
0.099
0.041
0.082
0.026
0.736
2
Touluaan Selatan
0.176
0.141
0.183
0.011
0.099
0.014
0.027
0.026
0.678
2
10 Silian Raya
0.176
0.141
0.046
0.011
0.099
0.014
0.027
0.026
0.540
3
11 Ratahan Timur
0.176
0.141
0.115
0.011
0.099
0.014
0.027
0.026
0.609
2
12 Pasan
0.176
0.141
0.046
0.011
0.099
0.014
0.027
0.026
0.540
3
1
8 9
5. CONCLUSION This paper propose AHP approach for determining priorities and the priorities of food commodities in the target districts over the function of uncultivated land into food land in Minahasa Tenggara, North Sulawesi. The results showed that food commodities recommended in the conversion of food into land idle land is commodity corn. Corn became a major priority for qualified technical and non - technical evaluation criteria food land. Districts are a top priority is the district Touluaan where eight variables land evaluation of food, both technical and non - variable technically qualified with the highest priority as a target districts over the land. District Silian Kingdom and Pasan are two districts with the lowest priority (the lowest composite score) due to the low capacity of the soil, difficulty in accessing the area and access to the required technology.
6. ACKNOWLEDGMENTS We thank to Daniel R. Kaparang as a local expert for the information and field consultation, such that this research can be done. We also thank to Higher Education Directorate (DIKTI) for the 2013 research grant, such that we can do the research in Minahasa Tenggara District, North Sulawesi, Indonesia.
7. REFERENCES [1] The Central Bureau of Statistics of Minahasa Selatan and Regional Planning and Development Agency of Minahasa Tenggara, 2012. Minahasa Tenggara in Number 2012. [2] Food Security Council, Department of Agriculture, and World Food Programme (WFP), 2010. A Food Security and Vulnerability Atlas of Indonesia (FSVA) 2009. PT Enka Deli, Jakarta.
IJCATM : www.ijcaonline.org
[3]
Mosher, A. T., 1965. Mobilizing and Building Agriculture, CV. Yasaguna Jakarta.
[4]
Sitorus, R. P. Santun, 2005. The Evaluation of Land Resources. Tarsito. Bandung.
[5] Saaty, Thomas L., 1980. The Analytic Hierarchy Process: Planning, Priority Setting, Resource Allocation, McGraw-Hill. [6] Bhatta, Gopal D., dan Doppler, W., 2010. Farming Differentiation in the Rural-urban Interface of the Middle Mountains, Nepal: Application of Analytic Hierarchy Process (AHP) Modeling. Journal of Agriculture Science, 2(4): 37-51. [7] Martianto, D., Briawan, D., Ariani, M., dan Yulianis, N., 2009. Acceleration Diversified Food Consumption-Based Local Food: Perspectives and Strategies Local Officials achievements. Journal of Nutrition and Food, 4(3): 123131. [8]
Bhushan, N., and Rai, K., 2004. Strategic Decision Making: Applying the Analytic Hierarchy Process, Springer-Verlag London Limited, London
[9] Iryanto, 2008. Exposition of Analytic Hierarchy Process in Operations Research: Effective Ways To Decision Making. Medan. [10] Latifah, S., 2005. Basic Principles of Analytic Hierarchy Process. Department of Foresty, Faculty of Agriculture, University of North Sumatera. [11] Oldeman, L. R., Las, I., and Muladi, 1980. The Agroclimatic Maps of Kalimantan, Maluku, Irian Jaya and Bali, West and East Nusa Tenggara. Center For Agricultural Research Institute, Bogor.
44