Application of ANN to evaluate effective parameters ... - CiteSeerX
Recommend Documents
PERFORMANCE TO SIMULATE AVERAGE CENTERLINE ... published by the American Society for Testing and Materials (ASTM D6589, 2000), provides a.
findings of Onuh and Donald (2009) who reported that the highest mean plant ..... JP Markwell, M Germann, JH Orf and KG Lark (2001). Soybean response to ...
Oct 12, 2009 - 1 Department of Pathobiology, College of Veterinary Medicine, University of Illinois at Urbana-Champaign, ... 3 Animal Technology Institute, Taiwan, Republic of China ..... Rabies [online] (2008) http://apps.who.int/globalatlas/.
... consisting of a large un- committed array of programmable logic and intercon- ... has the manual and automatic methods to sample and pro- cess the data, and ...
Oct 12, 2009 - 1 Department of Pathobiology, College of Veterinary Medicine, University of Illinois at ... ing a rabies vaccination certificate and the results of the ...
... Physics and Centre for Advanced Luminescence Materials, Hong Kong Baptist University, ..... 2000; Y. Shen, A. R. Hosseini, M. H. Wong, and G. G. Malliaras,.
restoration to recovery of species of concern to stormwater ...... project might involve placing bags of dead oyster ...... small project may send a DVD or hard drive.
Sensorless and Neural Network Control of an Induction Motor .... wwE w. Q. = = = = (10). Proceedings of the 6th WSEAS International Conference on Power ...
The Edward S. Rogers Sr. Department of Electrical and Computer Engineering. University of ... these structure, the inherent Bragg scattering can be made.
DOI: 103856/vol40-issue3-fulltext-4. Research Article. Parameters to evaluate the immunostimulant effect of Zymosan A in head kidney leucocytes (HKL) of ...
for a field technician scheduling problem, where the objective is to assign a set ... The greedy choice is to select jobs with the highest unit weight. The local ..... Optimization, volume 4446 of Lecture Notes in Computer Science, pages 60â71.
Nov 22, 2006 - able version of the Triangulation Method for 2-D structures, and thus ... In order to study the motion of various 2-D structures, sev- ... Fear et al., 2005). ..... work is supported by NSFC project 40528005, 40390152 and the.
May 5, 2005 - Klemm's colour etchant (no. 5) showed a .... show the same sign the change of the weights. )(t ij w. Î ... If the derivative retains its sign, the.
Crystalline basement rocks occupy 40% of the land area of sub-Saharan Africa [2]. .... cates a good conducting zone along the eastern part whi- ch may indicate ...
Wavelet transforms of meteorological parameters and gravity waves. Z. Can1, Z. Aslan2, O. Oguz2, and A. H. Siddiqi3. 1Yildiz Technical University, Faculty of ...
(Dunn et al., 1994; Stank et al., 2001), marketing .... protection in business-to-business (B2B) Internet ... market, Internet services are valuable for global car-.
Sep 15, 2010 - The results indicate that the method is able to rank the parameters effectively, and the ... Environmental Modelling & Software 26 (2011) 135e143 ..... 1995) was performed by keeping track of the efficiency (Nash and ... for developing
Abstractâ The solid phase microextraction technique was tested for thymol evaluation in honey. Thymol can be present in honey as a residue of treatments ...
filter bags and sludge transportation to a composting facility (bagfil),. ⢠vegetation-bed planted ... technology),. ⢠filtration press and disinfection with lime (pressfil).
into two-dimensional space allow to present multidimensional data on computer screen. Among such ... Janina Mining Plant
Summary. A study was undertaken to evaluate the efficienacy of histopathology and bacteriology- ical investigations in the diagnosis of lymphode tuberculosis in ...
Nov 22, 2015 - School of Mechanical Engineering & Automation, Beihang University, Beijing 100191, China ... the flow stress of the tube parameters using the bulge test based on ..... contains easy access to the Python language [16]. A 3D.
May 2, 2014 - evaluated on the basis of the hedonic models: S1, S3, S4 and S6. Conclusions ..... Chinese 20th century modern art, international conference on finance department of finance, National ... A call on art investments. Review of ...
Mar 29, 2017 - CBA was first mentioned in the report of Albert Gallatin in 1808 in the United ... Gallatin was U.S. Secretary of the Treasury at that time and he ...
Application of ANN to evaluate effective parameters ... - CiteSeerX
Application of ANN to evaluate effective parameters affecting failure load and displacement of RC buildings M. Hakan Arslan Selcuk University, Engineering and Architecture Faculty, Department of Civil Engineering, Konya, Turkey Received: 23 February 2009 – Revised: 20 May 2009 – Accepted: 19 June 2009 – Published: 25 June 2009
Abstract. This study investigated the efficiency of an artificial neural network (ANN) in predicting and determining failure load and failure displacement of multi story reinforced concrete (RC) buildings. The study modeled a RC building with four stories and three bays, with a load bearing system composed of columns and beams. Non-linear static pushover analysis of the key parameters in change defined in Turkish Earthquake Code (TEC-2007) for columns and beams was carried out and the capacity curves, failure loads and displacements were obtained. Totally 720 RC buildings were analyzed according to the change intervals of the parameters chosen. The input parameters were selected as longitudinal bar ratio (ρ` ) of columns, transverse reinforcement ratio (Asw /sc ), axial load level (N/No ), column and beam cross section, strength of concrete (fc ) and the compression bar ratio (ρ 0 /ρ) on the beam supports. Data from the nonlinear analysis were assessed with ANN in terms of failure load and failure displacement. For all outputs, ANN was trained and tested using of 11 back-propagation methods. All of the ANN models were found to perform well for both failure loads and displacements. The analyses also indicated that a considerable portion of existing RC building stock in Turkey may not meet the safety standards of the Turkish Earthquake Code (TEC-2007).
1
Introduction
Within developing countries, earthquakes have been the most significant reported cause of failure of RC buildings during the last 30 years, resulting in the greatest losses of life and property. The literature suggests [1–7] that this is not simCorrespondence to: M. Hakan Arslan ([email protected])
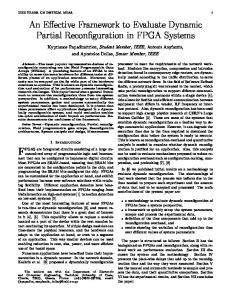
ply the result of flawed construction technology but of inadequate inspection and lack of information during the construction phase. Turkey has experienced serious loss of life and property after each large scale earthquake, not only because more than 70% of its’ building stock is of RC construction, but also because of its’ location on the Northern Anatolian Fault which is one of the world’s most active seismic zones. The Kocaeli earthquake of 1999 caused more than 20 000 fatalities, left 45 000 injured or homeless and caused damage or total collapse in 350 000 buildings. It is critically important to assess the probable performance, failure load and failure displacement of existing RC buildings and to decide on a strategy for strengthening these building, if required, in order to reduce the damage and collapses that may occur after probable earthquakes. Due to this requirement, the Turkish Earthquake Code (TEC-2007) was revised in 2007 in line with the codes developed by the US Federal Earthquake Management Agency (FEMA 356 [8]; FEMA 440 [9]), which are regarded as the global benchmark for evaluating the design and structural performance of building stock for earthquake events. The analyses and observations made by researchers [6, 11–12] after Turkey’s recent earthquakes have shown that most of the RC buildings that were seriously damaged or collapsed, were 3 to 7 storey RC buildings lacking shear walls in their load bearing systems. Many weaknesses exist such as insufficient casing reinforcement in the intersections of columns and beams, low compression strength, insufficient dimensions of columns and beams and defective reinforcement details in the damaged or collapsed buildings. All of these structural defects have been shown to contribute to the failure of many Turkish RC buildings to meet the required levels of ductility and lateral rigidity as set out in the codes, resulting in serious damage to buildings (Fig. 1). In order to evaluate the existing building stock, the code requires appraisal of the potential damage at the ends of the
Published by Copernicus Publications on behalf of the European Geosciences Union.
.
Comparison of Pushover and ANN Results for Failure Displacement (δ failure)of Figure RC Structures 968
1. A Seriously Damaged RC B
M. Hakan Arslan: Application of ANN to evaluate effective parameters
Fig. 2. Load-displacement curve and performance levels of aand strucFigure 1. A Seriously Damaged RC Building in Marmara Region Figure 2. Load-Displacement Curve Fig. 1. A seriously damaged RC building in Marmara region.
ture.
Performance Levels of a Structure
quakes with limited damage and; withstanding large-scale structural elements that form the load bearing system such as earthquakes without total collapse. The critical outcome is columns, beams and shear walls. Thus, a general assessment the prevention of total structural collapse. This means that can be provided for the element, each storey and the complete the upper level withstands total collapse (CP); The sub level, load bearing system. Parallel to FEMA-356, TEC-2007 also for the crucial structures, may be slightly damaged but reassesses levels of damage for the columns and beams accordmains fit for immediate occupancy (IO). Between the sub and ing to the parameters specified in Table 1. upper levels there is Life Safety (LS) level situation. Multiple The objective of this study is (1) to determine failure load performance objectives for these levels, including the seismic and failure displacement of multi-storey RC buildings in transformation periods, have been specified in Table 2. which the load bearing system is formed only by columns Seismic performance of the load bearing system is deand beams (2) to investigate the usability of artificial neu2. Load-Displacement Curve and fined the sum of seismic damage levels of the structural ral network (ANN) models in predicting the failure load and DamageasLevels Figure 3. Component ormance Levels of a Structure elements (beam, column, etc.) which form the load bearfailure displacement of RC buildings. (3) Such buildings are ing system. The damage level of the elements of the load reported to be the type most at risk of serious earthquake bearing system differs according to the method of analysis. damage, according to the column and beam parameters specIn common with FEMA 356, the Turkish Earthquake Code ified in the TEC-2007, FEMA-356 and other building codes (TEC-2007) states that the seismic performance of build[13–14]. The research further aims to analyze the extent to ings can be determined using linear or nonlinear analysis. which these parameters explain and predict failure load and The design engineer is free to utilize either linear or nonfailure displacement. linear analysis approaches. The seismic codes also include For these aims, first of all a database was created by usa number of analysis methods, such as “incremental equiving non-linear static pushover analysis of RC buildings. 720 alent seismic load method”, “incremental mode superposiframes were analyzed according to the change intervals of tion method” and “analysis method in time domain” which the parameters chosen (given in Table 1). Failure load and are suitable to be used for both approaches. In the present failure displacement of each 19 of the frames has been calcustudy, the structures were evaluated using nonlinear analysis lated using capacity curves (lateral load-lateral displacement with the incremental equivalent seismic load method (static curves) obtained by pushover analysis. After obtaining failpushover analysis method). ure load and failure displacement values of each frame, the Static pushover analysis is frequently used within the literresults of the analyses have been investigated and verified by ature as the preferred performance measure. Pushover anala mathematical model controlling with the assistance of 11 ysis is a numerical method of calculating a building’s lateral different artificial neural network (ANN) algorithms. load capacity under the influence of increasing lateral loads. Gravity loads are in place during lateral loading. Structure reaction in pushover analysis is defined by a capacity curve 2 Methodology for failure load and failure describing the relationship between the base shear force and displacement evaluation lateral roof displacement. Load-displacement and moment – Within Seismic Codes, the earthquake safety of existrotation (curvature or deformation) curves that show levels ing RC buildings is determined based on the concept of of performance of the load bearing system and cross section performance-based design. Generally this takes the form of are given in Figs. 2 and 3, respectively. desired performance outcomes, such as withstanding minor earthquakes undamaged; withstanding medium-scale earthNat. Hazards Earth Syst. Sci., 9, 967–977, 2009
www.nat-hazards-earth-syst-sci.net/9/967/2009/
19
Performance Back-Propagation The NetworkofTraining Parameters Methods for Values of Failure Point of the Structures (V ) failure Back Propagation Training Algorithms Used in NN Training Performance Point of of the the PerformanceofofBack-Propagation Back-Propagation Methods Methods for for Values Values of of Failure Failure Point Structures (δ ) failure Structures (Vfailure) List of Figures M. Hakan Arslan: Application of ANN to evaluate parameters Performance of effective Back-Propagation Methods for Values of Failure Point of the Table 12. Structures (δ failure) Table Table11. 9. Table 10. Table Table12. 11.
A Seriously Damaged RC Building in Marmara Region Load-Displacement Curve and Performance Levels of a Structure Component Type of element Damage Parameters Levels Damage occures Table 1. Parameters Required for Damage Prediction in RC Structural Elements Typical Load-Displacement Relationship for RCDamage Structures Type of Beams Parameters occures element Table 1. Parameters Required for Damage Prediction in RC Structural Elements – Transverse reinforcement Plan View of Sample Building • Transverse reinforcement Type of Parameters bars at the Damage occures –• Amount of Selected Interior Frame element Amount of compression compression bars at the support support Transverse reinforcement • of Capacity Curves the Type-1 and Type-720 Beams Longitudinal reinforcement Amount of compression barsratio at the –•• Longitudinal reinforcement Feed Forward• Multilayer NetworkratioConsisting of an Input Layer, a Hidden support Dimensions –•• Dimensions Longitudinal reinforcement ratio Concrete compressive strength LayerBeams and an Output Layer. Dimensions –• Concrete compressive strength Comparison of• Pushover and ANN Concrete compressive strength Results for Failure Load (Vfailure) of RC • Axial load level Structures Columns • Transverse reinforcement Axial Comparison of–••Pushover and ANN Results for Failure Displacement (δ failure)of Axialload loadlevel level Columns Dimensions • Transverse reinforcement – Transverse reinforcement • Concrete compressive strength RC Structures Columns • Dimensions
Table 1. Parameters required for damage prediction in RC structural elements.
Figure 9. Figure 10.
– Dimensions •
Concrete compressive strength
– Concrete compressive strength
Table 2. Required seismic performance levels for design earthquakes (EQ). Exceeding probability of EQ Purpose of structure and class of buildings
50 years 50% 22
50 years 2%
Average return period
75 year
475 year
2500 year
– – IO –
IO IO LS IO LS
LS LS – CP –
22
Buildings to be utilized after the EQ Intensively and long-term occupied buildings Intensively and short-term occupied buildings Buildings containing hazardous materials Other buildings
50 years 10%
Figure 1. A Seriously Damaged RC Building in Marmara Region
As a part of the static pushover analysis, it is necessary to define the cross-sectional damage level according to the deformation of each of the structural elements in order to determine the global performance of the load bearing system (Tables 3–4). In the Table 3, according to the TEC-2007, the cross sectional damage types are given. Based on these damage levels, the structural performance can be obtained as given in Table 4. 2.1
Calculating failure load and failure displacement
– In order to obtain lateral load – lateral top displaceFigure 2.ofLoad-Displacement ment curve the sample building, staticCurve pushoverand analLevels of apurpose, Structure ysisPerformance method is selected. For this researchers and engineers use linear and nonlinear dynamic analysis programs such as DRAIN, IDARC and SAP2000 [15–17]. www.nat-hazards-earth-syst-sci.net/9/967/2009/
Slight Damage (SD) Moderate Damage (MD) Heavy Damage (HD)
0.040 0.060
Table 4. Structure performance based on damage. Performance Level
Performance Criteria
Immediate occupancy (IO) – The ratio of beams in Slight Damage (SD) and Moderate Damage (MD) shall not exceed 10% in any story. – There must not be any columns beyond Slight Damage (SD). – There must not be any beams beyond Heavy Damage (HD). Life Safety (LS) – The ratio of beams in Moderate Damage (MD) and Heavy Damage (HD) shall not exceed 20%in any story. – In any storey, the shear force carried by columns in Heavy Damage (HD) shall not exceed 30% of story shear. Collapse Prevention (CP) – The ratio of beams in Heavy Damage (HD) must not exceed 20% in any story. – In any story, the shear force carried by column that passed Slight Damage (SD) must not exceed %30 of story shear force. Collapse (C) – If the failure can not be prevented, it is under failure condition.
– Beam and column elements are modeled as nonlinear frame elements with lumped plasticity by defining plastic hinges at both ends of the beams and columns. – To define plastic hinge properties, moment-curvature analyses are carried out taking section properties and axial load level for every column and beams into account. – The input required for the above mentioned programs is moment-rotation instead of moment curvature therefore transformation is needed. Transformations of bilinear diagrams M−ϕ (Moment-curvature) which are obtained in aforementioned procedure, in bilinear diagrams M−φ (Moment-rotations) implements (Eq. 1).
Nat. Hazards Earth Syst. Sci., 9, 967–977, 2009
Z`p θ`p =
ϕdx
(1)
o
In this step, a suitable plastic hinge length `p is used to obtain ultimate rotation values from the ultimate curvatures. In the literature several `p length are proposed [18–23] In the structural modeling, Eq. (2) was used for the plastic hinge length definition. This equation is also used in TEC-2007 and FEMA-356. In Eq. (2), H is the column and beam section depth. `p = 0.5H
(2)
The structural elements possess effective flexural stiffness values as TEC-2007: beams and low axial loaded columns (columns under tension failure) EIef =0.4EIg , high www.nat-hazards-earth-syst-sci.net/9/967/2009/
Figure 4. Typical Load-Displacemen M. Hakan Arslan: Application of ANN to evaluate effective parameters
971
4. Typical load-displacement relationship for RC structures. Figure 4. Fig. Typical Load-Displacement Relationship for RC Structures
axial loaded columns (columns under compression failure) EIef =0.8EIg .
Figure 4. Typical Load-Displacement – After completing plastic hinge length and effective flex-Relationship for RC Structures ural stiffness values, the gravity loads are applied on the systems. The pushover analysis takes from the gravity loads and a monotonically increasing pattern of lateral static forces. The first mode shape (inverted triangular) has been selected for loading as general. In the analysis, P −1 effects were taken into account.
Figure 5. Plan View of Sample Building Fig. 5. Plan view of sample building.
– Fy and δy are defined graphically (see Fig. 4). – The areas under the original and idealizing curve are approximately equal. – Since the original pushover curveFigure is known6. from analyt- Interior Frame Plan View of Sample Building Selected ical data, the two curves cross at a force equal to about 60 per cent of the yield strength (0.6 Fy ). – The failure displacement is there where the slump 25% of the strength is appeared. 3
Brief description of the selected sample RC structures
In this study, a 4 story reinforced concrete frame building was selected. The selected building was typical beam-column RC frame building with no shear wall. The 4 story frame building was 12 m by 12 m in plan. It has 3@4 m bays along X direction and 4@3 m bays along Y direction (Figs. 5–6). Typical floor height was 3.0 m. The column and beam dimensions used in this study were typical frame element proportions in Figure 7. Capacity Curves theany Type-1 Type-720 practice. The building doesn’tof have verticaland irregularities as soft story, short column, heavy overhangs etc. At every story, column and beam dimensions were the same. All columns were selected as 400 mm×400 mm and 500 mm×500 mm. All beams had 200×500 mm and 250×600 mm cross section. In practice, especially in Turkey, while column dimensioned are generally changed from one story to another, beam dimensions remained the same. In
5. Plan View of Sample Building
www.nat-hazards-earth-syst-sci.net/9/967/2009/
Figure 7. Capacity Curves of
Figure 6. Selected Interior Frame
Fig. 6. Selected interior frame.
this study, the column section changes were neglected between the stories. The parameters investigated within the scope of this study were (1) concrete strength, (2) amount of column’s longitudinal reinforcement, (3) amount of transverse reinforcement at the confinement zone for beam and column, (4) axial load level on the column, (5) dimensions of column and beam and (6) amount of compression bars at the support section of beams. Table 5 summarizes the range Nat. Hazards Earth Syst. Sci., 9, 967–977, 2009
20
972
M. Hakan Arslan: Application of ANN to evaluate effective parameters
of the parameters used in the structural and cross sectional analyses. According to the Table 5; – The longitudinal reinforcement ratio of the columns varies between 1% and 2%. In the codes [10, 13–14], the longitudinal rebar ratio (ρl ) ranges between 1%–4%, generally. Selection of low steel ratio is encouraged because; low steel ratio is an amplification of larger cross section. The use of larger cross section effects lateral stiffness to increase. – The proportion of compression bars and tensile bar of the beams’ support varies between 0.2 and 0.6. In order to obtain adequate ductility at the end of beam, codes stipulate the requirement minimum compression bar’s (bottom bar) ratio as 30 % of tension bar’s (top bar). – Axial load ratio ranges between 0.1 and 0.5 for columns. In the codes, the axial load level of column changes in this gap. Maximum value of this level given in the codes ranges from 0.50 to 0.65. The reason for this is to satisfy minimum rigidity, decrease the axial load level, and thus increase in ductility. – Transverse reinforcement spacing in critical region is selected as 50 ∼250 mm. In all codes including TEC2007, transverse bars spacing and special seismic hooks is important to obtain plastic hinge formation and high ductility. According to author observation after the earthquakes, especially in Turkey, the spacing of transverse ties is typically 200–250 mm uniform along the clear height of the column and beam. The wide spacing of the ties resulted in shear failures buckling of longitudinal rebar and poor confinement of the core concrete.
Nat. Hazards Earth Syst. Sci., 9, 967–977, 2009
Axial load level
Concrete compressive strength (MPa)
ρ`
N /No
fc
0.01 0.02 – – – – – – – –
0.1 – 0.5 – – – – – – –
10 20 30 – – 10 20 30 – –
of the main factors that caused the collapse of many structures. Damage due to poor quality of material was reported many of other country’s earthquakes [24– 26]. Lack of anchorage of beams and insufficient splice lengths is secondary affected by low quality level of concrete. 4
Database of evaluated RC buildings
In the study, the grouping of the RC buildings, of which evaluation has been performed, has been made according to the parameters specified in Table 5. As can be seen from the table, 720 frame types have been arranged according to their performance characteristics. Among these frames the lowest performance level in terms of section, reinforcement and material is designated as Type-1, and the highest performance in respect of the same features is designated as Type-720. The features of Type-1 and Type-720 have been specified in Table 6. The failure load and failure displacement of the all frames with static pushover analysis was conducted using the SAP2000 three-dimensional structural analysis program. The results are shown in Table 7. Because the decrease of 25% after the maximum load, which defines failure load, is not seen in the curves of lateral load-lateral displacement of both frames, the ultimate point of the curve has been taken as the failure load and failure displacement. Lateral drift capacities (%) in performance areas of sample RC frames are also specified in Table 7. Load displacement curves for both sample frames are also specified in Fig. 7. 5
– Concrete strength parameter is selected as 10, 20 and 30 MPa. In the all codes, it is stipulated that the minimum characteristic strength of concrete must be 20 MPa for structures which will be built on earthquake prone regions. Poor quality of material may have been one
Longitudinal reinforcement ratio
ANN-Based models for estimating the failure load and failure displacement of the RC structures
The use of artificial neural network (ANN) provides an alternative way to estimate and determine failure load and displacement of the RC structures. The ANN has been www.nat-hazards-earth-syst-sci.net/9/967/2009/
M. Hakan Arslan: Application of ANN to evaluate effective parameters
973
Table 6. Features based on related parameters of two sample RC frames.
Table 7. Failure point and global displacement drift capacities (%) of the sample buildings obtained for considered performance levels. Structure Type
Type-1 Type-720
Values of failure point of the structures
Performance Level
δfailure (mm)
Vfailure (kN)
Immediate Occupancy (IO)
Life Safety (LS)
Collapse Prevention (CP)
83.13 177.05
194 561
0.23 0.61
0.44 1.05
0.62 1.32
e 5. Plan View of Sample Building
Figure 6. Selected Interior Frame
Figure 7. Capacity Curves of the Type-1 and Type-720 Fig. 7. Capacity curves of the Type-1 and Type-720.
successfully applied to a number of areas of structural engineering that is an important branch of civil engineering. In the recent literature, structural analysis and design [27–32], structural dynamics and control [33] and structural damage Fig. 8. Feed forward multilayerConsisting network consisting of anInput input Figure Forward Multilayer Network of an assessment [34, 35] are good examples for8. theFeed application of layer, a hidden layer and an output layer. ANN. In this study, a three-layered neural netandfeed-forward an Output Layer. work was used and trained with the error back propagation method. The structure of feed-forward multilayer network In the ANN model, 720 different RC structures having is given in Fig. 8. As it seen20from the Fig. 8, general strucdifferent material and sectional parameters were analyzed to ture of the neural network consists of an input layer, one or calculate the failure load and displacement of the RC strucmore hidden layer(s) and an output layer. Layers are fully tures. These material and sectional parameters included; (1) interconnected, as shown by lines. The input data are preTransverse reinforcement ratio (Asw /sc ), (2) Amount of comsented to the ANN at the input layer, which are processed in pression bars at the support section of beams (ρ 0 /ρ), (3) Inera forward direction through the hidden layer(s), and the outtia moment of beam (Ib ), (4) Inertia moment of column (Ic ), put from the ANN is computed at the output layer. This is (5) Longitudinal reinforcement ratio for column (ρ` ), (6) Axknown as “feed-forward mechanism”. In a feed-forwarded ial load level on column (N/No ) and (7) Concrete compresoperation, the flow of information is from left to right [27]. sive strength (fc ). The range of datasets is listed in Table 8.
www.nat-hazards-earth-syst-sci.net/9/967/2009/
Nat. Hazards Earth Syst. Sci., 9, 967–977, 2009
Layer, a
974
M. Hakan Arslan: Application of ANN to evaluate effective parameters
Table 8. Data range.
Minimum Maximum Increment
Transverse reinforcement ratio
Amount of compression bars at the support section
Inertia Moment of Beam
Inertia Moment of Column
Longitudinal reinforcement ratio
Axial load level
Concrete compressive strength
Asw /sc (mm) 0.2 1.0 Variable
ρ 0 /ρ
Ib (mm4 )×108 20.8 45.0 None
Ic (mm4 )×108 21.33 52.08 None
ρ`
N/No
0.01 0.02 None
0.5 0.1 None
fc (MPa) 10 30 10
0.2 0.6 0.2
6
Table 9. The network training parameters. Parameter
Value
Number of Training examples (randomly) Number of Testing examples (randomly) Iteration Number (Maximum) Learning Rate (lr) Momentum Constants Error tolerance ANN structure
360 360 5000 1.0 0.2 0.0001 7:HN:1
Totally 720 data were scaled to be presented to the network. A simple linear normalization function within the values of 0 to 1 is given by Eq. (3) [27], sx =
(x − xmin ) (xmax − xmin )
(3)
In the Eq. (1), sx is the normalized value of variable, x, xmin and xmax are variable minimum and maximum values respectively. In this study, MATLAB neural network toolbox [36] was used to estimate and determine failure load and displacement of the RC structures. The MATLAB neural network toolbox needs some parameters to start simulation as; (1) number of training data; (2) number of hidden layers; (3) number of iteration (epocs); (4) learning rate; (5) number of nodes of input; output and hidden; (6) error tolerance and; (7) momentum constant. There are no acceptable generalized rules to determine the size of the training data. From the set of 720 design data, 360 data sets were selected for neural network training. Required parameter and its selected values are given in Table 9. In the simulation process, the 11 neural network configurations that are given in Table 10 were selected. In all simulations one hidden layer was chosen. Maximum training cycles, learning rate, error tolerance and momentum coefficient were kept constant. The number of neurons in the hidden layer was changed 2 to 16. In Table 9, 7: HN: 1 refers to 7 input nodes, HN optimum number of hidden nodes and 1 output node.
Nat. Hazards Earth Syst. Sci., 9, 967–977, 2009
Comparison of analysis results
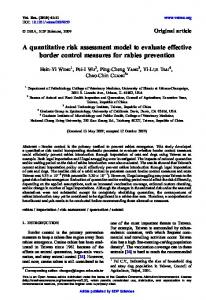
The results of ANN models for failure load and displacement of RC structure are given in Tables 11–12. The optimum number of hidden layer nodes that is obtained after many trials is also provided in the second column of the tables. Performance of Back-Propagation Methods for failure load (Vfailure ) is given in Table 11. It is obvious from the Table 11 that the performances of the BFG algorithm performed the best estimation concerning correlation coefficients (R 2 ), even though training time is quite long due to the training cycles. CGF algorithm made classification process in less time than other algorithms for Vfailure . In addition to these, as seen from the Table 11, all of back-propagation methods were obtained between 90.27% and 97.59 % averaged accuracy rate (100% – error %) for test phase of neural network and also 87.37% and 92.25% averaged accuracy rate (100% – error %) for training phase of neural network. As demonstrated in Table 12, the best estimation was performed by SCG algorithm for the δfailure similar to Vfailure performance. In the estimation of δfailure , CGF also made classification process in less time than the others. The averaged accuracy rate was between 94.53% and 97.54% for test phase and 84.85% and 89.95% for training phase. The comparison of pushover results as calculated and ANN results as estimated for failure load and failure displacement of RC structures is plotted in Figs. 9 and 10. In the figures, a BFG algorithm’s data was used because it has better performance (estimation power) than the other algorithms.
7
Results
The research has examined the performance of a sample RC frame with 4 storeys and 3 spans, according to a range of parameters. This represents the multi-storey RC structures which have been seriously damaged during earthquakes and which constitute the majority of Turkey’s building stock. The parameters considered for columns were longitudinal bar ratio, transverse reinforcement ratio, axial load level, column cross section and strength of concrete. The parameters considered for beams were the compression bar ratio on the support, transverse reinforcement ratio, beam cross section and strength of concrete. In order to obtain lateral load – lateral www.nat-hazards-earth-syst-sci.net/9/967/2009/
M. Hakan Arslan: Application of ANN to evaluate effective parameters
975
Table 10. Back propagation training algorithms used in NN training.
Category 1
GDA GDM GDX RP
Gradient descent with adaptive linear back propagation Gradient Descent BP with Momentum Gradient descent w/momentum and adaptive linear back propagation Resilient back propagation
Category 2
CGF CGP CGB SCG BFG OSS LM
Fletcher – Powell conjugate gradient back propagation Polak-Ribiere conjugate gradient back propagation Powell – Beale conjugate gradient algorithm Scaled conjugate gradient back propagation BFGS quasi – Newton back propagation One step secant back propagation Levenberg – Marquart back propagation
Table 11. Performance of back-propagation methods for values of failure point of the structures (Vfailure ). BackPropagation Methods
top displacement curve (capacity curve) of the sample building, static pushover analysis method was selected. In this study, following points have been noted by comparing the values of failure load and failure displacement to the results obtained by using 11 different artificial neural networks approaches; – Nonlinear and compex behavior of RC buildings under seismic action makes quantification of their performance a difficult task. This study explored the feasibility of the potential use of artificial neural networks in failure load and failure displacement of RC buildings.
Figure 9. Comparison of Pushover and ANN Results for Failure Load (Vfailure) o Fig. 9. Comparison of pushover and ANN results for failure load Structures
– This study demonstrates that the efficiency of feed forward back-propagation neural network to predict failure load and failure displacement. It was found that the selected parameters explain a high proportion of the results (91.73% for failure force and 90.95% for failure displacement). That means; the percentage of influence of mentioned variant on the result is very high. www.nat-hazards-earth-syst-sci.net/9/967/2009/
(Vfailure ) of RC structures.
– The estimation capacity and estimation duration of each algorithm show significant differences. It is obvious that the selection of the data used in the training set Nat. Hazards Earth Syst. Sci., 9, 967–977, 2009
Feed Forward Layer, a Arslan: HiddenApplication Layer 976 Multilayer Network Consisting of an Input M. Hakan of ANN to evaluate effective parameters put Layer. Table 12. Performance of back-propagation methods for values of failure point of the structures (δfailure ). BackPropagation Methods
e 9. Comparison of Pushover and ANN Results for Failure Load (Vfailure) of RC Structures
verse reinforcement ratio, Asw /sc ) (b) the bottom reinforcement of the beam supports did not have sufficient anchorage length and amount (Amount of compression bars at the support section, ρ 0 /ρ) (c) concrete strength was very low (fc ). (d) Inadequate column cross section (inadequate lateral rigidity) (e) high longitudinal reinforcement ratio (ρ` ) and high axial load level (N/No ) (f) the ends of the ties were bent 90◦ . (g) Excessive beam strength. (i) No transverse reinforcement was used in joints. The present study has demonstrated that all of these selected parameters directly affected the seismic performance of building, which is a function of lateral load carrying capacity, failure load level and failure dis0. Comparison of Pushover and ANN Results for Failure Displacementplacement. (δ failure)of The analyses also indicated that a considFig. 10. Comparison of pushover and ANN results for failure diserable portion of existing RC building stock in Turkey RC Structures placement (δfailure ) of RC structures. may not meet the safety standards of the Turkish Earthquake Code (TEC-2007). and algorithm directly influences the accuracy and rate. Therefore, selection of the algorithm most appropriate for each data set is a crucial factor in the solution of the problem. – It should be noted that selected ANN models presented above are valid only for21the ranges of database given in Table 5 and for the sample frame (4-storey R/C plane frames which are a very common building type in Turkey) given in Figs. 5–6. Therefore, the estimation capacity and estimation duration of each algorithm will be expected to be lower than calculated in this study, in case of selecting frames with different number of stories and bays, different columns as (450/450) and beams as (250/500). – Previous observations made by the author [6] indicate that RC buildings in Turkey have some structural deficiencies, such as (a) the end zones of beams and columns were inadequately confined (inadequate transNat. Hazards Earth Syst. Sci., 9, 967–977, 2009
Acknowledgement. The author acknowledges support provided by SU-BAP under Project No. 08 701 030. Edited by: M. E. Contadakis Reviewed by: two anonymous referees
References Bruneau, M.: Building damage from the Marmara, Turkey Earthquake of August 1999, J. Seismology, 6, 357–77, 2002. Igarashi, S.: Recommendations on minimizing earthquake damage in big cities in Turkey, Proc. International Conf. on The Kocaeli Earthquake, 1, 271–286, 1999. Yakut, A., G¨ulkan, P., Bakir, B. S., and Yilmaz, M. T.: Reexamination of damage distirbutation in Adapazari: Structural Consideration, Eng. Struct., 27(7), 990–1001, 2005. Adalier, K. and Aydingun O.: Structural engineering aspects of the June. 1998 Adana Ceyhan (Turkey) Earthquake, Eng. Struct., 23, 343–55, 2001.
www.nat-hazards-earth-syst-sci.net/9/967/2009/
M. Hakan Arslan: Application of ANN to evaluate effective parameters Cagatay, I.: Experimental evaluation of buildings damaged in recent earthquakes in Turkey, Eng. Fail. Anal., 12, 440–52, 2005. Arslan, M. H. and Korkmaz, H. H.: What is to be learned from damage and failure of reinforced concrete structures during recent earthquakes in Turkey?, Eng. Fail. Anal., 14, 1–22, 2007. Dogang¨un, A.: Performance of reinforced concrete buildings during the May 1. 2003 Bingol Earthquake in Turkey, Eng. Struct., 26, 841–856, 2004. FEMA-356: Prestandard and commentary for seismic rehabilitation of buildings, FEMA, 2000. FEMA-440: Improvement of nonlinear static seismic analysis procedures, FEMA, 2005. TEC-2007, (Turkish Earthquake Code): Regulations on structures constructed in disaster regions, Ministry of Public Works And Settlement, 2007. Sezen, H., Whittaker, A. S., Elwood, K. J., and Mosalam, K. W. : Performance of reinforced concrete buildings during the August 17, 1999 Kocaeli, Turkey Earthquake. and the seismic design and construction practice in Turkey, Eng. Struct., 25, 103–14, 2003. Bal, I. E., Crowly, H., Pinho, R., and G¨ulay, F. G.: Structural characteristics of Turkish RC building stock in Northern Marmara Region for loss assesment applications, IUSS Press, 2007. UBC-97: Uniform Building Code, International Conference of Buildings Official, USA, 1997. IBC: The International Building Code. International Code Council, Virginia, USA, 2003. Prakash, V., Powell, G. H., and Campbell, S.: Drain–2DX base program description and user guide version 1.10, Structural engineering mechanics and materials report no. UCB/SEMM-93-18, Berkeley: University of California; November, 1993. Valles, R. E, Reinhorn, A. M., Kunnath, S. K., Li, C., and Madan, A.: IDARC 2D version 4.0: a program for the inelastic damage analysis of buildings. Technical report NCEER-96-0010, State University of New York, Buffalo, 1996. CSI, SAP2000 V-8.: Integrated finite element analysis and design of structures basic analysis reference manual; Berkeley (CA, USA); Computers and Structures Inc., 2000. Park, R. and Paulay, T.: Reinforced concrete structures, John Wiley & Sons, New York, 1975. Panagiotakos, T. and Fardis, M.: Deformations of reinforced concrete members at yielding and ultimate, ACI Structural Journal, 98(2), 135–148, 2001. Priestley, M. J. N, Seible, F., and Calvi, G. M. S.: Seismic design and retrofit of bridges, John Wiley & Sons, New York, 1996. Corley, W. G.: Rotational capacity of RC beams, journal of structural division, ASCE, 92, 121–146, 1966. Mattock, A. H.: Discussion of “Rotational capacity of RC beams”, journal of structural division, ASCE, 93, 519–522, 1967.
www.nat-hazards-earth-syst-sci.net/9/967/2009/
977
Sawyer, H. A.: Design of concrete frames for two failure states, Proceedings of the international symposium on the flexural mechanics of RC, ASCE-ACI, Miami, November, 405–431, 1964. Naderzadeh, A. and Khademi, M. H.: A preliminary Report on the Ardekul, Iran Earthquake of 10 May, 1997, Earthquake Hazard Centre Newsletter, 1(3), 1174–3646, 1998. Goel, R. K.: Performance of Buildings During the January 26, 2001 Bhuj Earthquake, (http://ceenve.ceng.calpoly.edu/goel/ indian eqk/index.htm), 2001. Karakostas, C., Lekidis, V., Makarios, T., Salonikios, T., Sous, S., and Demosthenous, M.: Seismic response of structures and infrastructure facilities during the Lefkada, Greece earthquake of 14/8/2003, Eng. Struct., 27(2), 213–227, 2005. Arslan, M. H., Ceylan, M., Kaltakci, M. Y., Ozbay, Y., and Gulay, G.: Prediction of Force Reduction Factor R of prefabricated Industrial Buildings Using Neural Networks, Struct. Eng. Mech., 27(2), 117–134, 2007. Consolazio, G. R.: Iterative equation solver for bridge analysis using neural networks, Computer-Aided Civil Infrastructure Engineering, 15(2), 107–119, 2000. Hadi, M. N. S.: Neural network applications in concrete structures, Computers & Structures, Elsevier Science Ltd., 81, 373–381, 2003. Rajasekaran, S. and Amalraj, R.: Predictions of design parameters in civil engineering problems using SLNN with a single hidden RBF neuron, Computers & Structures, Elsevier Science Ltd., 80, 2495–2505, 2002. Tashakori, A. and Adeli, H.: Optimum design of cold-formed steel space structures using neural dynamics model, Journal of Constructional Steel Research, Elsevier Science Ltd., 58, 1545–1566, 2002. Inel, M.: Modeling ultimate deformation capacity of RC columns using artificial neural Networks, Eng. Struct., Elsevier Science Ltd. 29(3), 329–335, 2007. Chen, H. M., Tsai, K. H., Qi, G. Z., Yang J. C. S., and Amini, F.: Neural networks for structural control, Journal of Computational Civil Engineering, 9(2), 168–176, 1995. Elcordy, M. F., Chang, K. C., and Lee, G. C.: Neural networks trained by analytically simulated damage states, Journal of Computational Civil Engineering, 7(2), 130–145, 1993. Mukherjee, A., Deshpande, J. M., and Anmada, J.: Prediction of buckling load of columns using artificial neural networks, Journal of Structural Engineering, ASCE, 122(11), 1385–1387, 1996. MATLAB, Matrix Laboratory, Nueral Network Toolbox User Guide, 2006.