Labuan e-Journal of Muamalat and Society, Vol. 2, 2008, pp. 9-16
LJMS
Labuan e-Journal of Muamalat and Society
2008, 2
APPLICATION OF ARTIFICIAL NEURAL NETWORKS USING HIJRI LUNAR TRANSACTION AS EXTRACTED VARIABLES TO PREDICT STOCK TREND DIRECTION Zakariah Arisa♣, Dzulkifli Mohamadb a School bFaculty
of Engineering and Information Technology, Universiti Malaysia Sabah
of Computer Science and Information Systems, Universiti Teknologi Malaysia Received: 6 May 2008, Revised: 5 August 2008, Accepted: 27 August 2008
This is a peer-reviewed article
ABSTRACT There have been many studies using artificial neural networks (ANNs) in the stock market prediction. A large number of successful applications have shown that ANN can be a very useful tool for time-series modeling and forecasting (Zhang et al., 1998). There has been no specific research for stock market trend direction using the dates transaction attributes as the input variables. The aim of this paper is to use artificial neural networks to predict Kuala Lumpur Composite Index (KLCI) market index trend direction. Preliminary research performed on Malaysia stock market has suggested that the inputs to the system may be taken as: stock prices; Open, High, Low, Close, and 5 dummy variables each representing the working days of the week, month, day, numerology number representing the transaction, and day sequence of the month. After the inputs have been determined, the data have been gathered for the period of July 1, 2001 through February 28, 2003 downloaded from the Finance. yahoo database. Training set is determined to include about 90% of the data set and the rest 10% will be used for testing purposes. Network architecture is determined to be Multi Layer Perceptron and Generalized Feed Forward networks. Training and testing is performed using these two network architectures. However, subsystems are considered, which had different number of hidden layers (1, 2 and 4) for a mean-squared error value of 0.003. The results are then compared with the results of moving averages for 5 and 10-day periods, which showed that artificial neural networks have better performances than moving averages.
Keywords:
Artificial neural networks, prediction, stock market index direction
♣
Corresponding author: Zakariah Aris, School of Engineering & Information Technology, Universiti Malaysia Sabah, MALAYSIA , E-mail:
[email protected]
9
Aris & Mohamad 1. Introduction Stock market prediction is regarded as a challenging task of financial time-series prediction and one of the important issues in finance. With the advert of the advancement in computer technology, ANNs have been popularly applied to every area of disciplines especially financial type problems such as stock market index prediction, bankruptcy prediction, and corporate bond classification. The early days of these studies focused on application of ANNs to stock market prediction (Armano et al., 2002). Recent research tends to hybridize several artificial intelligence (AI) techniques (Abraham et al, 2001, Kim and Lee, 2004). Some researchers tend to include novel factors in the learning process. Studies were performed for the prediction of stock index values as well as daily direction of change in the index. In some applications it has been specified that artificial neural networks have limitations for learning the data patterns or that they may perform inconsistently and unpredictable because of the complex financial data used. Artificial neural networks are mostly used in predicting financial issues with fundamental and technical data as the input variables. An ANN model is a computer model whose architecture essentially mimics the learning capability of the human brain. The processing elements of an ANN resemble the biological structure of neurons and the internal operation of a human brain. Many simple interconnected linear or nonlinear computational elements are operating in parallel processing at multiple layers. In some applications, prior to input the variables into ANN for processing, the complex financial data used will be pre-processed as ANNs have limitations for learning the data patterns or they may perform inconsistently and unpredictable results. Sometimes data is so voluminous that learning patterns may not work. Continuous and large volume of data needs to be checked for redundancy and the data size should be decreased for the algorithm to work in a shorter time and give more generalized solutions (Piramuthu, 2004). There have been many studies using ANNs in finance area. The prediction of Tokyo stock exchange index is among the earliest projects that make used of ANNs (Kimoto et al., 1990; Kim and Lee, 2004). There are also work done with the application of neural networks incorporating Technical indicators and time series data from historical data to train the neural networks to predict buying and selling signals with an overall prediction rate of 63% (Yao and Tan, 2000). During training of ANN, the momentum and learning rate at start will be chosen at random points to solve the problems should it occurs (Sexton et al., 1998). An accuracy of 81% for predicting the market direction was achieved with the application of neural network with genetic algorithm to the stock exchange market of Singapore (Phua et al., 2000). There has been no specific research for prediction of market direction, incorporating attributes of stock data transaction occurs (for example: day, week, month, etc). The aim of this paper is to use unordinaries data as an input variables into ANNs to forecast Kuala Lumpur Stock Exchange (KLSE) market index directions. 2. Artificial neural network approach The pattern extraction in time-series prediction is referred as the process of identifying past relationships and trends in historical data for predicting future values. This paper describes the development of a new pattern matching technique for univariate timeseries forecasting (Leigh et al., 2002). The pattern modeling technique out-performs frequently used statistical methods such as Exponential Smoothing on different error measures and predicting the direction of change in time-series (Zhang, 2004). Green and
10
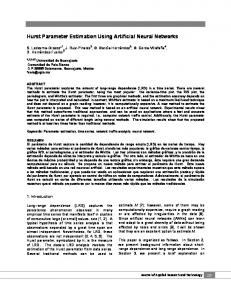
Labuan e-Journal of Muamalat and Society, Vol. 2, 2008, pp. 9-16 Pearson (1994) and others argue that a better method for measuring the performance of neural networks is to analyze the direction of change (Walczak, 2001). Therefore, the reported accuracy of the neural network forecasting models developed for the research presented in this paper is the percentage of correct market direction forecasts made by the neural network. The direction of change is calculated by subtracting today’s price from the forecast price and determining the sign (positive or negative) of the result. The percentage of correct direction of change forecasts is equivalent to the percentage of profitable trades enabled by the ANN system. Depending on the trading strategies adopted level-based forecasting models, forecasting methods based on potential smoothing, Bayesian vector auto regression minimizing forecast error may not be adequate regression, multivariate transfer function, and to meet their objectives (Leung et al., 2000). In other words, trading multilayered feedforward neural network) which driven by a certain forecast with a small fore-will be tested against their classification error may not be as profitable as trading counterparts. We discuss the design of the guided by an accurate prediction of the direction experiment (movement or sign of return), predicting the direction of change of the stock and how to apply the directional forecasts and market index and its return is also significant in the posterior probabilities supplied by the classification development of effective market trading models. Instead of predicting the actual value of the stock return, the direction of future change of the financial market is what we really needed. Predicting the direction of change is easier for the neural network when compared to actual value because of the noisy and non-stationary behaviour of the financial time series. The predicted direction can then be used to make a trading decision. This can be accomplished by changing the time series prediction problem into a classification task. Recently, Leung et al. (2000) find that the forecasting models based on the direction of stock return outperform the models based on the level of stock return in terms of predicting the direction of stock market return and maximizing profits from investment trading. Machine learning approach is appealing for artificial intelligence since it is based on the principle of learning from training and experience. Connectionist models, such as ANNs, are well suited for machine learning where connection weights are adjusted to improve the performance of a network. An ANN is a network of nodes connected with directed arcs each with a numerical weight, wij , specifying the strength of the connection (Figure 1). These weights indicate the influence of previous node, u j , on the next node, u i , where positive weights represent reinforcement; negative weights represent inhibition. Generally the initial connection weights are randomly selected.
Figure 1: Connection weight between nodes
11
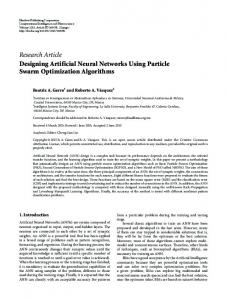
Aris & Mohamad
Figure 2: 2-hidden layers network with n inputs and 1 output Feed-forward networks were first studied by Rosenblatt (1961). Input layer is composed of a set of inputs that feed input patterns to the network. Following the input layer there will be at least one or more intermediate layers, often called hidden layers. Hidden layers will then be followed by an output layer, where the results can be achieved (Figure 2). In feed-forward networks all connections are unidirectional. Multi Layer Perceptron (MLP) networks are layered feed-forward networks typically trained with static backpropagation. These networks, also known as backpropagation networks, are mainly used for applications requiring static pattern classification (Egeli et al., 2003). The backpropagation algorithm selects a training example, makes a forward and a backward pass, and then repeats until algorithm converges satisfying a prespecified mean squared error value. The main advantage of MLP networks is their ease of use and approximation of any input/output map. The main disadvantage is that they train slowly and require lots of training data. Generalized feedforward (GFF) networks are a generalization of the MLP networks where connections can jump over one or more layers, but these networks often solve problems much more efficiently (Arulampalam and Bouzerdoum, 2003; Enke and Thawornwong, 2005). 2.1. Training algorithm Training is the process by which the free parameters of the networks (i.e. the weights) get optimal values. Supervised learning models, that are used for MLP and GFF networks, train certain output nodes to respond to certain input patterns and the changes in connection weights, due to learning, cause those same nodes to respond to more general classes of patterns. In these models input layer units distribute input signals to the network. Connection weights modify the signals that pass through it. Hidden layers and output layer contain a vector of processing elements with an activation function. Usually the Sigmoid function is used as the activation function. Every unit u i computes its new activation u i as a function of the weighted sum of the inputs to unit u i (u j ) from directly connected cells. Therefore, the output of each processing unit for the forward pass will be defined as:
12
Labuan e-Journal of Muamalat and Society, Vol. 2, 2008, pp. 9-16 n
S i = ∑ wij * u j ………………………………………………………………………….(1) j =0
u i = f ( S i ) where f ( x) =
1 ……………………………………………..(2) (1 + e − x )
The backward pass is the error back-propagation and adjustment of weights. Gradient descent approach with a constant step length, also referred to as learning rate, is used to train the network. This method minimizes the sum of squared errors of the system until a given minimum or stop at a given number of epochs, where epoch is the term specifying the number of iterations to be done over the training set. The error is multidimensional and may contain many local minima. A momentum term may be added to avoid getting stuck in local minima or slow convergence. The output of each processing unit for the backward pass is defined as: f ' ( S i ) = u i * (1 − u i ) …………………………………….……………………………..(3) Weights are then updated by the formula where ε is the mean squared error and p is the step size:
∂
δ i = − ε ...……………………………………………………………………………(4) ∂S i w *i , j = wij + pδ i u j …………………………………………………………………….(5) After the training process is completed, the network with specified weights can be used for testing a set of data different than those used for training. The results achieved can then be used for generalization of the approximation of the network. 3. Modeling of stock index direction Forecasting of stock exchange market index direction is an important issue in financial sector. The objective of this paper is to illustrate that the ANNs can effectively be used to predict the KLCI direction using technical analysis approach and dummy variables representing the working days of the week, day, month, and numerology. Supervised learning models have been utilized in which certain output nodes were trained to respond to certain input patterns and the changes in connection weights due to learning caused those same nodes to respond to more general classes of patterns. 3.1. System model In this study the following input variables were considered to ultimately affect the exchange market index direction. Open price (OP) High price (HL) Low price (LO) Close price (CL) Dummy variable 1 representing day (start with 1 as Sunday until 7 as Saturday) (D) Dummy variable 2 representing day of month (1-30) (DOM) Dummy variable 3 representing week (W) Dummy variable 4 representing month (start with 1 as Muharram and end with 12 as DzulHijjah (M) Dummy variable 5 representing numerology (start with 1 until 9) (N) Considering the input variables, the following system model was considered for the prediction exchange market index direction:
13
Aris & Mohamad
f KLCI = (OP, HI , LO, CL, D, DOM , W , M , N ) 3.2. Data sets Experimental data were downloaded online from finance.yahoo for a period of 5,254 days starting from 1st. Muharram 1405 to 29th. DzulHijjah 1426 (27 September 1984 to 29 January 2006). From this data set, only 313 data points are above and under 3% threshold and these are selected as the final data for the input variables. The first 282 cases (about 90%) were taken as training and 31 as testing examples. 3.3. Network parameters For the system model described before, two different ANN models (MLP and GFF) were applied with different number of hidden layers (HL = 1, 2, 4) for minimum mean squared error value of 0.003, for the data set. Thus, 6 different ANN models have been used. 3.4. Training results In this study, 6 ANN models were applied to the system model, using an ANN software package. ANN models’ performances can be measured by the coefficient of determination ( R 2 ) or the mean relative percentage error. This coefficient of determination is a measure of the accuracy of prediction of the trained network models. Higher values indicate better prediction. The mean relative percentage error may also be used to measure the accuracy of prediction through representing the degree of scatter. For each prediction model, Equation 6 was utilized to calculate the relative error for each case in the testing set. Then, the calculated values were averaged and factored by 100 to express in percentages.
( f KLCI ) actual − ( f KLCI ) predicted ( f KLCI ) actual
………………………………………………………………….(6)
Table 1 shows the ANN models with the R 2 values of the 3 MLP and 3 GFF network models applied to system model. Table 1: Coefficient of determinations R² for ANN models
1
Number of hidden layers 2
4
0.81 0.82
0.79 0.81
0.78 0.81
ANN Model MLP GFF
3.5. Comparison with ‘Moving Averages’ The ANN performances can be compared with Moving Averages (MA) approach. The moving average is the average of lagged index values over a specified past period (5 and 10 days in this study). The mean relative percentage errors were calculated as 0.022 for 5 days and 0.03 for 10 days. Table-2 shows all models with mean relative percentage errors.
14
Labuan e-Journal of Muamalat and Society, Vol. 2, 2008, pp. 9-16 Table 2: Mean relative percentage errors for all models Model MLP - 1 Hidden Layer
Mean relative percentage error (%) 1.62
MLP - 2 Hidden Layers
1.65
MLP - 4 Hidden Layers
1.70
GFF - 1 Hidden Layer
1.59
GFF - 2 Hidden Layers
1.65
GFF - 4 Hidden Layers
1.71
MA - 5 days
2.17
MA - 10 days
3.03
4. Evaluation The accuracy of the prediction for each ANN model has been compared by the coefficient of determination. The efficiency of ANN models varied with the number of hidden layers. For both MLP and GFF network models, the highest accuracies are obtained with 1 hidden layer. The mean relative percentage errors calculated for all models verified that the ANN models were superior to the MA model. 5. Conclusion This study was aimed at finding the best model for the prediction of Kuala Lumpur Stock Exchange market index values. Total of 8 sets of predictions, that result from the application of 6 ANN models and two MA were performed. Results were compared using the coefficients of determination for ANN models and using mean relative percentage errors for all of the models. Based on the findings of this study it can be concluded that: 1. The prediction models based on ANNs were more accurate than the ones based on MAs; 2. Among the ANN models, GFF network model was found to be more appropriate for the prediction; and 3. The extracted transaction of Hijri dates for input variables to the neural network can also be the trading rules for decision making of buy, sell or hold. References Abraham, A., Nath, B., & Mahanti, P.K. (2001). Hybrid intelligent systems for stock market analysis. Computational Science, 2074, 337-345. Armano, G., Andrea, M., & Fabio, R. (2002). Stock market prediction by a mixture of genetic-neural experts. International Journal of Pattern Recognition and Artificial Intelligence, 16(5), 501 – 526.
15
Aris & Mohamad Arulampalam, G., & Bouzerdoum, A. (2003). A generalized feedforward neural network architecture for classification and regression. Neural Networks, 16(5/6), 561568. Egeli, B., Özturan, M., & Badur, B. (2003). Stock market prediction using artificial neural networks. Proceedings of the 3rd Hawaii International Conference on Business, Hawai, USA. Enke, D., & Thawornwong, S. (2005). The use of data mining and neural networks for forecasting stock market returns. Expert Systems with Applications, 29(4), 927940. Green, H., & Pearson, M. (1994). Neural nets for foreign exchange trading, in: Trading on the Edge: Neural, Genetic, and Fuzzy Systems for Chaotic Financial Markets, Wiley, New York. Kim, K., & Lee, W.B. (2004). Stock market prediction using artificial neural networks with optimal feature transformation. Neural Computing & Applications, 13(3), 255-260. Kimoto, T., Asakawa, K., Yoda, M., & Takeoka, M. (1990). Stock market prediction system with modular neural network. Proceedings of the International Joint Conference on Neural Networks, 1-6. Leigh,W., Modani, N., Purvis,R., & Roberts, T. (2002). Stock market trading rule discovery using technical charting heuristics. Expert Systems With Applications, 23(2), 155-159. Leung,M.T., Daouk, H., & Chen,A.S. (2000). Forecasting stock indices: a comparison of classification and level estimation models. International Journal of Forecasting, 16(2), 173-190. Phua, P.K.H. Ming, D., & Lin, W. (2000). Neural network with genetic algorithms for stocks prediction. Fifth Conference of the Association of Asian-Pacific Operations Research Societies, 5th - 7th July, Singapore. Piramuthu, S. (2004). Evaluating feature selection methods for learning in data mining applications. European Journal of Operational Research, 156(2), 483-494. Rosenblatt F. (1961). Principles of neurodynamics: perceptrons and the theory of brain mechanisms. Spartan Press, Washington. Sexton, R. S., Dorsey., R. E., & Johson, J. D.(1998). Toward global optimization of neural networks: A comparison of the genetic algorithm and backpropagation. Decision Support Systems, 22, 171-185. Walczak, S. (2001). An empirical analysis of data requirements for financial forecasting with neural networks. Journal of Management Information Systems, 17(4), 203222. Yao, J. & Tan, C.L. (2000). A case study on using neural networks to perform technical forecasting of FOREX. Neurocomputing, 34, 79-98. Zhang, G., Patuwo, B.E., & Hu., M Y. (1998). Forecasting with artificial neural networks: The state of the art. International Journal of Forecasting, 14(1), 35-62. Zhang, G.P. (2004). Neural networks in business forecasting. Idea Group Publishing, Hershey, London.
16