Journal of Theoretical and Applied Information Technology 30th September 2012. Vol. 43 No.2 © 2005 - 2012 JATIT & LLS. All rights reserved.
ISSN: 1992-8645
www.jatit.org
E-ISSN: 1817-3195
APPLICATION OF CLASSIFICATION ALGORITHMS IN DATA MINING FOR HOTSPOTS OCCURRENCE PREDICTION IN RIAU PROVINCE INDONESIA 1,2
IMAS SUKAESIH SITANGGANG, 3RAZALI YAAKOB, 4NORWATI MUSTAPHA, 5 AINUDDIN A N 1,3,4 Faculty of Computer Science and Information Technology, Universiti Putra Malaysia 2 5
Department of Computer Science, Bogor Agricultural University, Indonesia
Institute of Tropical Forestry and Forest Products (INTROP), Universiti Putra Malaysia
E-mail:
[email protected],
[email protected],
[email protected], 5
[email protected]
ABSTRACT High fire occurrence in Riau Province, Indonesia has been going on in the recent years with large areas occurring in the peat soil. In this paper a data mining technique namely classification was applied on forest fire data to develop classification models for hotspots occurrence in Riau Province. The models provide characteristics of areas where active fires occurred. We studied physical data including land cover, road, river, city centers, industrial timber plantation, logging concession, peatland depth and peatland types to classify 2693 target objects. Target objects are true alarm data namely hotspots distribution in 2008 and false alarm data which are randomly generated within the areas at least 1 km away from any true alarm data. We applied three classification algorithms that are available in the data mining toolkit Weka 3.6.2: J48 module as Java implementation of C4.5 algorithm, SimpleCart and NaïveBayes. The result shows that the classifier generated from the J48 has highest accuracy i.e. 69.59 % compared to two other algorithms. Our results based on the J48 classifier show that hotspots are predicted to take place in areas that (1) are non logging concession areas, (2) are plantation and dryland forest, and (3) have peatland type: Very deep Hemists/Saprists (> 400 cm). Additionally, hotspot occurrence probability is higher in areas located 10 km from roads, 3 km from rivers and within 5 km to 20 km of city centers where the areas are accessible to humans. Keywords: Data Mining, Classification Method, Forest Fires, Hotspot, Indonesia 1.
INTRODUCTION
Forest fires both in Kalimantan and Sumatra, Indonesia seem to be yearly disaster especially in dry season. It is considered as a regional and global problem because its impacts could be felt by people not only in Indonesia but also in many parts of Southeast Asia including Singapore and Malaysia. Riau is one of provinces in Sumatra that has high deforestation because of forest fires especially in dry season. Uryu et al. (2008) in [1] state that Riau has high deforestation in recent years and the majority of the deforestation has occurred on peat soil. This province has lost more than 65% of forest (about 4 million hectares (ha)) in the last 25 years in which forest cover decreased from 78% in 1982 to 27% in 2007 [1]. A study conducted by [2] found that there is a clear relation between fires and
deforestation and degradation [2]. According to [1] more than 72,000 active fires (hotspots) were recorded in Riau by NOAA AVHRR and MODIS satellite sensors in the period 1997-2007. The total emission in Riau was estimated about 3.66 gigatons (Gt) CO2 between 1990 and 2007 resulted from deforestation, forest degradation and decomposition and burning of peat [1]. Especially in peatland, fires produce not only CO2 emissions but also smoke haze problems. Peatland fires in Riau Province have resulted in smoke haze problems that also felt in neighboring countries including Brunei, Singapore and Malaysia, and as far as Thailand, Vietnam and Philippines. Herawati et al (2006) in [3] state that smoke haze problems from peatland fires influence the city traffic, sea transportation and flights, human health and other economical lost [3]. In order to minimize the incidence of forest
214
Journal of Theoretical and Applied Information Technology 30th September 2012. Vol. 43 No.2 © 2005 - 2012 JATIT & LLS. All rights reserved.
ISSN: 1992-8645
www.jatit.org
E-ISSN: 1817-3195
fires, many works have been conducted in developing forest fire risks models using geographical information systems (GISs) and remote sensing [4-9].
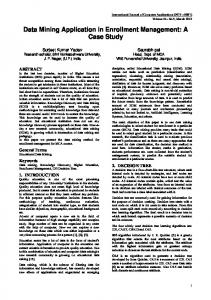
Data Spread and coordinates of hotspots 2008
Study on fires risk may involve large spatial data including physical data, climate data, and social economic data. The data are stored in spatial databases as one of the component in GISs. Spatial databases store large number of spatial features and their relationships for further manipulation and analysis to help users in decision making process. In order to extract interesting and useful but implicit spatial patterns from large spatial databases, data mining techniques continue applied in many areas including in forest fires risk modeling.
Physical data: land cover, road, river, city centers, Industrial Timber Plantation, Logging Concession Administrative border for village, subdistrict, district and province Peatland: peatland depth, peatland types
Data mining tasks including association rules mining, classification and prediction, as well as cluster analysis have been successfully utilized in analyzing spatial data related to forest fires [10-14]. In this paper, a data mining technique namely classification is applied on forest fires data to develop classification models for hotspots occurrence in Riau Province Indonesia. The spatial data used include land cover, road, river, city centers, logging concession, industrial timber plantation, type and depth of peatland. The classification models provide characteristics of areas where active fires occurred and it can be used to predict the hotspot occurences in a new area. 2.
MATERIAL AND METHODS
1) Forest fires data The study area is the Riau Province in Sumatera Island Indonesia (Figure (1)). The total area of Riau Province is approximately 8,915,015.09 Ha (89,150 Km2) consisting of land and water areas. Spatial data are detailed in Table 1. We assigned the datum WGS84 as the spatial reference system to all spatial objects.
Source Ministry of Environment, Indonesia National Land Agency (BPN) Riau province, Indonesia
BPS (StatisticsIndonesia) Wetland Indonesia
For mining purposes using classification algorithms, a dataset should contain some explanatory attributes and one target attribute. Therefore we conducted two main tasks in constructing a forest fires dataset: 1) creating the target attribute and populating its value from the target objects, and 2) creating explanatory attributes from neighbor objects related to the target objects. In our study, target objects are true and false alarm data (Figure (2)). True alarm data (positive examples) are hotspots that spread in Riau Province in 2008. Number of hotspots in peatland and nonpeatland areas in 2008 is 3,092. False alarm data (negative examples) were randomly generated and they are located within the areas at least 1 km away from any true alarm data. For this purpose we created 1 km buffers from positive examples and extract all randomly generated points outside the buffer to be negative examples. Explanatory objects are physical data including land cover, roads, rivers, city centers, industrial timber plantation (ITP), and logging concession, peatland type, and peatland depth that will classify the target objects into false or true alarm.
Figure 2. False and true alarm data Figure 1. Riau province, Indonesia (Source for Riau Province map: BPS (StatisticsIndonesia)) Table 1. Spatial data 215
Journal of Theoretical and Applied Information Technology 30th September 2012. Vol. 43 No.2 © 2005 - 2012 JATIT & LLS. All rights reserved.
ISSN: 1992-8645
www.jatit.org
2) Data preprocessing Preprocessing steps were performed to relate the explanatory objects to target objects by applying topological and metric operations. Topological relations used are Inside, Meet, and Overlap. Metric-relations i.e distance is calculated from target objects to explanatory objects such as river, road and city centers. Distance between two objects are calculated in decimal degree because all maps are referenced using WGS84. We converted decimal degree unit to meters to prepare a final dataset. Preprocessing steps for spatial objects are explained in the following subsections. All steps were performed using open source software: Quantum GIS 1.0.2 (http://qgis.org/) for spatial data analysis and visualization, PostgreSQL 8.4 as the database management system (http://www.postgresql.org/), and PostGIS 1.4 for spatial data analysis (http://postgis.refractions.net/). a) Distance target objects to nearest road, river and city centers We defined relations between target objects and spatial objects: roads, rivers and city centers by calculating distance from target objects to nearest roads, rivers, and city centers. For this purpose, the PostGIS operation ST_Distance was applied to compute distance from each target to all rivers, road networks and city centers then identify its minimum value as distance from a target to nearest objects. Figure (3) and Figure (4) show a river network and a road network respectively overlaid with target objects. Distance between target objects (false alarm and true alarm) and river segments were calculated by running the following query statement: SELECT target.gid AS target_ID, river.gid AS river_ID, target.class, ST_Distance(target.the_geom, river.the_geom) AS dist_target_river FROM river, target;
Figure 3. Rivers and some target objects
E-ISSN: 1817-3195
Figure 4. Roads and some target objects b) Land cover, logging concession, industrial timber plantation There are 13 types of land cover: natural forest, dryland forest, mix garden, mangrove, plantation, settlement, swamp, paddy field, shrubs, bare land, unirrigated agricultural field, water body, and embankment. We determined types of land cover for the areas where the target objects are located. For this purpose we applied the topological operation ST_Within in PostGIS to identify target objects inside an area and its type of land cover. The following query statement was used to identify target objects inside all land cover types. SELECT target.gid, target.the_geom, target.class, land_cover.landcovertype FROM target, land_cover WHERE ST_Within(target.the_geom, land_cover.the_geom) ORDER BY target.gid;
In order to relate target objects with logging concession and industrial timber plantation (ITP) represented in polygons we defined whether the objects are located in the polygons or not. The topological operation ST_Within in PostGIS was used to identify target objects inside logging concession and ITP. c) Peatland The total area of peatland in Riau Province is about 40,191.97 km2 or about 45% of the total area of Riau Province. There are two important characteristics of peatland considered in this work: peatland types and peatland depth. Figure (5) and Figure (6) display peatland types and peatland depth layers respectively, as well as some targets overlaid with these two layers. The label in peatland type for example “Hemists/Saprists (60/40), Moderate” is described as follows: Hemists and Saprists are peatland types, the value 60 and 40 respectively represent 60% of Hemists and 40% of Saprists covering the area. Moderate is a category for peatland depth. The topological operation
216
Journal of Theoretical and Applied Information Technology 30th September 2012. Vol. 43 No.2 © 2005 - 2012 JATIT & LLS. All rights reserved.
ISSN: 1992-8645
www.jatit.org
E-ISSN: 1817-3195
ST_Within in PostGIS was applied to identify target objects inside peatland. 3.
RESULT AND DISCUSSION
Classifiers were developed from a dataset containing physical data and target data. Number of target objects after preprocessing steps is 2693 (1373 true alarm (hotspot) and 1320 false alarm. Fields in the dataset are as follows 1. 2. 3. 4. 5. 6. 7. 8. 9.
Distance from target data to nearest road in km (min_dist_to_road) Distance from target data to nearest river in km (min_dist_to_river) Distance from target data to nearest city center in km (min_dist_to_city) Land cover type for the area where target data are located (landcovertype) Logging concession in the area where target data are located (in_logging_conc) Industrial Timber Plantation in the area where target data are located (in_itp) Peatland types (legend) Peatland depth Target attribute containing true and false alarm (class). True alarm data are hotspot in 2008 for all areas in Riau Province. False alarm data are randomly generated outside 1 km buffer for true alarm data
Figure 5. Target layer overlaid with peatland type layer
The dataset are divided into the training set for developing the classification models and the testing set to calculate the accuracy of the models. There are several methods that can be applied to construct classification models such as decision tree and neural network. The decision tree methods include ID3 [15] developed by J. Ross Quinlan during the late 1970s and early 1980s, C4.5 [16] as a successor of ID3, and CART (Classification and Regression Tree) [16] proposed by L. Breiman et.al in 1984 that generates binary decision trees. Other method is Bayesian Classification. The simple Bayesian classifier namely Naïve Bayesian Classifier learns from training data the conditional probability of each attribute Ai given the class label C [17]. Moreover, classification is conducted by applying Bayes rule to compute the probability of C given the particular instance of A1, …, An, and then predicting the class with the highest posterior probability [17].
Figure 6. Target layer overlaid with peatland depth layer. We applied two decision tree algorithms that are available in the data mining toolkit Weka 3.6.2: the J48 module as Java implementation of C4.5 algorithm and SimpleCart. For comparison, we
217
Journal of Theoretical and Applied Information Technology 30th September 2012. Vol. 43 No.2 © 2005 - 2012 JATIT & LLS. All rights reserved.
ISSN: 1992-8645
www.jatit.org
also run the algorithm NaïveBayes in Weka 3.6.2 to develop a classifier on datasets. Weka is a collection of machine learning algorithms for data mining tasks. It is the open source software issued under the GNU General Public License that contains tools for data pre-processing, classification, regression, clustering, association rules, and visualization (http://www.cs.waikato.ac.nz/ml/weka/). 10-folds cross validation was used to calculate accuracy of the classifiers. Table 2 represents accuracy of classifiers for forest fire data in peatland areas.
E-ISSN: 1817-3195
land cover types, distance the area to nearest city center and road in order to decide the potential of hotspot occurrence. Other attributes namely peatland types and peatland depth are not required to classify the objects in logging concession areas to the target classes.
Table 2 Accuracy of classifiers Algorithm J48 SimpleCart NaiveBayes
Accuracy 69.5878 % 66.84 % 62.8667 %
Below are some rules generated from the C4.5 decision tree: 1.
2.
3.
4.
IF in_logging_conc = no AND landcovertype = Plantation AND min_dist_to_city 20.3706 km AND legend = Saprists/Hemists(60/40),Very_deep THEN Hotspot Occurrence = T (127.0/9.0) IF in_logging_conc = no AND landcovertype = Shrubs THEN Hotspot Occurrence = T (111.0/27.0) IF in_logging_conc = yes AND min_dist_to_road > 5.212 km AND landcovertype = Dryland_forest THEN Hotspot Occurrence = F (140.0/13.0)
Figure 7. Subtree associated with the root node ‘logging concession’ with the value ‘yes’. The next test attribute for the root with the value non-logging concession is land cover type (Figure (8)). The tree predicts 659 hotspots occurred in the plantation and 197 hotspots taking place in Dryland forest (Table 3). After testing the land cover type, other explanatory attributes will be evaluated to create rules for classifying the hotspots occurrence. These attributes include distance the area to nearest city center, peatland types, distance the area to nearest river, peatland depth, Industrial Timber Plantation, and distance the area to nearest road. From the J48 classifier, we summary that hotspots are mostly predicted taking place in (1) non logging concession areas, (2) plantation and dryland forest, (3) areas with peatland type of very deep Hemists/Saprists (> 400 cm).
The numbers in parentheses at the end of each rule represent the number of examples associated to this rule whereas the number of misclassified examples are given after a / slash /. The main result of this work is a decision tree generated by the J48 module in WEKA 3.6.2. It consists of 241 leaf nodes with the first test attribute is logging concession. The next test attribute for the area in logging concession is minimum distance to nearest road (Figure (7)). If the distance between a particular area to the nearest road is less than or equal to 5.212 km then 23 hotspots are predicted occur in that area (see leaf 1 in Figure (7)). Otherwise the tree will evaluate the 218
Figure 8. Subtree associated with the root node ‘logging concession’ with the value ‘no’.
Journal of Theoretical and Applied Information Technology 30th September 2012. Vol. 43 No.2 © 2005 - 2012 JATIT & LLS. All rights reserved.
ISSN: 1992-8645
www.jatit.org
Table 5 Number of predicted hotspots grouped by distance to nearest city center
Table 3 Number of actual and predicted hotspots grouped by land cover types Land Cover Type
127 230 0 2 65 15 67 651 2 91 33
Number of predicted hotspot 158 197 0 1 69 16 61 659 2 115 30
90 0 1373
98 0 1406
Number of actual hotspot
Bare land Dryland forest Embankment Mangrove Mix garden Natural forest Paddy field Plantation Settlement Shrubs Swamp Unirrigated agricultural field Water body Total
Distance to nearest city center (km) 5 10 15 20 25 30 35 40 Total
4.
Most of forest fires cases in Indonesia are caused by human factors. Human activities may trigger fire ignitions. Some factors such as proximity to road networks, proximity to rivers, and proximity to settlement areas are related with human ignitions [8]. Roads represent areas of higher fire risk because of the influence of human activities [18]. Additionally, roads are potential routes for hiking or camping areas [19]. The consideration of the proximity to rivers is also important because of its influence in humidity and vegetation type [18]. Our results based on the J48 classifier showed that hotspot occurrence probability is higher in the area located 10 km from roads, 3 km from rivers and within 5 km to 20 km of city centers where peatlands are accessible to humans (Table 4 and Table 5). Table 4 Number of predicted hotspots grouped by distance to nearest road and river Distance to nearest road (km) 5 10 15 20 25 30 35 40 [45, 60) Total
Number of Predicted Hotspot (%) 39.12 28.09 12.87 6.33 3.27 2.56 3.06 2.42 2.28 100
Distance to nearest river (km) 1 2 3 4 5 6 7 8 [9, 12) Total
Number of Predicted Hotspot (%) 24.32 21.62 17.78 13.58 8.61 6.12 3.91 2.13 1.92 100
E-ISSN: 1817-3195
Number of Predicted Hotspot (%) 15.36 30.73 19.99 19.06 10.95 3.56 0.07 0.28 100
SUMMARY AND FUTURE WORK
In this study, classification models for hotspots occurrence in Riau Province Indonesia have been developed. The dataset contains explanatory attributes and the target attribute consisting of hotspots in 2008 as true alarm data and false alarm data which are randomly generated within the areas at least 1 km away from any true alarm data. We applied three classification algorithms, that are available in Weka 3.6.2, on peatland fires data to construct the classifiers. The model with the highest accuracy of 69.5878 % is generated by the J48 algorithm. Our results based on the J48 classifier show that hotspots are predicted taking place in (1) non logging concession areas, (2) plantation and dryland forest, (3) areas with peatland type of very deep Hemists/Saprists (> 400 cm). Furthermore, hotspots are predicted occurred in areas located 10 km from roads, 3 km from rivers and within 5 km to 20 km of city centers where peatlands are accessible to humans. The classification model can be used to predict the hotspots occurrence in the new location. Additional data preprocessing steps can be performed to improve accuracy of the model. The steps include identifying outliers and smoothing out noisy data, attribute transformation and discretization, as well as attribute selection. Furthermore, our next study will include socioeconomic and weather data that influence peatland fires. Another direction of research is applying spatial data mining techniques to the data so that relation between objects of interest and its neighbors can be involved.
219
Journal of Theoretical and Applied Information Technology 30th September 2012. Vol. 43 No.2 © 2005 - 2012 JATIT & LLS. All rights reserved.
ISSN: 1992-8645
www.jatit.org
ACKNOWLEDGMENT The authors would like to thank Indonesia Directorate General of Higher Education (IDGHE), Ministry of National Education, Indonesia for supporting PhD Scholarship (Contract No. 1724.2/D4.4/2008) and Southeast Asian Regional Center for Graduate Study and Research in Agriculture (SEARCA) for partially supporting the research.
[8]
[9]
REFRENCES: [1]
[2]
[3]
[4]
[5]
[6]
[7]
Uryu, Y. et. al., 2008. Deforestation, Forest Degradation, Biodiversity Loss and CO2 Emissions in Riau, Sumatra, Indonesia. Technical Report, WWF Indonesia. Ainuddin, N.A., Goh, K. 2010. Effects of forest fire on stand structure in Raja Musa Peat Swamp Forest Reserve, Selangor, Malaysia. Journal of Environmental Science and Technology. 3(1):56-62. Herawati, H., Heru S., Claudio, F. 2006. Forest fires and climate change in Indonesia. Background document for the Southeast Asia kick-off meeting of the project Tropical Forests and Climate Change Adaptation (“TroFCCA”). Available in www.cifor.cgiar.org/trofcca/asia/docs/Forest Fire & CC.pdf. Date view 23 January 2010. Boonyanuphap, J., 2001. GIS-based method in developing wildfire risk model (case study in SASAMBA, East KALIMANTAN, Indonesia). Master Thesis, Bogor Agricultural University. Darmawan, M., A. Masamu and T. Satoshi, 2001. Forest fire hazard model using remote sensing and geographic information systems: toward understanding of land and forest degradation in lowland areas of East Kalimantan, Indonesia. Proceedings of the 22nd Asian Conference on Remote Sensing, Vol. 5. http://www.a-a-rs.org/acrs/proceeding/ACRS2001/Papers/FR F-05.pdf Setiawan, I., Mahmud, A.R., Mansor, S., Mohamed Sharriff, A. R., Nuruddin, A. A.. 2004. GIS-grid-based and multi-criteria analysis for identifing and mapping peat swamp forest fire hazard in Pahang, Malaysia. Disaster Prevention and Management Journal. 13(5):379-386. Hadi, M., 2006. Pemodelan spasial kerawanan kebakaran di lahan gambut: studi kasus Kabupaten Bengkalis, Province Riau
[10]
[11]
[12]
[13]
[14]
[15]
[16]
220
E-ISSN: 1817-3195
(in Bahasa). Master Thesis, Bogor Agricultural University. Danan, P.H., 2008. A RS/GIS–Based MultiCriteria Approaches to Assess Forest Fire Hazard in Indonesia (Case study: West Kutai district, East Kalimantan province). Master Thesis, Bogor Agricultural University. http://repository.ipb.ac.id/handle/123456789/ 8924 Razali, S.M, Nuruddin, A. A., Malik, I. A., Fatah, N. A. 2010. Forest fire hazard rating assessment in peat swamp forest using Landsat thematic mapper image. J. Appl. Remote Sens. Vol. 4:43531. doi:10.1117/1.3430040 Hu, L., Zhou, G., Qiu, Y., 2009. Application of apriori algorithm to the data mining of the wildfire. In Sixth International Conference on Fuzzy Systems and Knowledge Discovery, IEEE, pp. 426-429. Kalli, S.N.P. Ramakrishna, S., 2008. An autonomous forest fire detection system based on spatial data mining and fuzzy logic. IJCSNS International Journal of Computer Science and Network Security, VOL.8 No.12, pp. 49-55. Liang, Y., Fuling, B., 2007. An incremental data mining method for spatial association rule in GIS based fireproof system. In International Conference on Wireless Communications, Networking and Mobile Computing, 21-25 September 2007, Shanghai (IEEE), pp. 5983 – 5986. Daniela, S., Panče, P., Andrej, K., Sašo, D., Katerina, T., 2006. Learning to predict forest fires with different data mining techniques. In Conference on Data Mining and Data Warehouses (SiKDD 2006), Ljubljana, Slovenia. Seng, C.T., Wynne, H., Kim, H.L., Lee, C.,Y., 2003, Spatial data mining: clustering of hot spots and pattern recognition. In Geoscience and Remote Sensing Symposium, 21-25 July 2003 (IEEE International ), pp. 3685-3687. Quinlan, J. R., 1986. Induction of decision trees, in Machine Learning 1, Kluwer Academic Publishers, Boston, pp. 81-106. Kohavi, R., Quinlan, R., 1999. Decision tree discovery. Available in: http://citeseerx.ist.psu.edu/viewdoc/summary ?doi=10.1.1.4.5353. Date view 13 October 2009.
Journal of Theoretical and Applied Information Technology 30th September 2012. Vol. 43 No.2 © 2005 - 2012 JATIT & LLS. All rights reserved.
ISSN: 1992-8645
[17]
[18]
[19]
www.jatit.org
Friedman, N., Geiger, D., Goldszmidt, M., 1997. Bayesian network classifiers. Kluwer Academic Publishers, Boston, pp. 1-37. Almeida, R., 1994. Forest fires hazard areas and definition of the prevention priority planning actions using GIS. EGIS (1994) National Centre for Geographical Information, Portugal. Chuvieco, E., Congalton, R. G. 1989. Application of Remote Sensing and Geographic Information System to Forest Fire Hazard Mapping
221
E-ISSN: 1817-3195