Reference in this document to any commercial product, process, or service by
trade name, ..... Airways Boeing 777-200 and Boeing 747-400 aircraft fleets. .....
due to the greater degree of manual throttle control during the final approach on.
Application of Smiths Aerospace Data Mining Algorithms to British Airways 777 and 747 FDM Data A Technology Demonstration In Partnership with the Federal Aviation Administration and the Global Aviation Information Network (GAIN)
Report Prepared by:
Mr. Brian Larder PHM Department Manager Smiths Aerospace Information Systems - Southampton Capt. Nigel Summerhayes Flight Manager BA FDM British Airways
December 2004
Disclaimers; Non-Endorsement All data and information in this document are provided “as is,” without any expressed or implied warranty of any kind, including as to the accuracy, completeness, currentness, noninfringement, merchantability, or fitness for any purpose. The views and opinions expressed in this document do not necessarily reflect those of the Global Aviation Information Network or any of its participants, except as expressly indicated. Reference in this document to any commercial product, process, or service by trade name, trademark, servicemark, manufacturer, or otherwise, does not constitute or imply any endorsement or recommendation by the Global Aviation Information Network or any of its participants (e.g., FAA) of the product, process, or service.
Notice of Right to Copy This document was created primarily for use by the worldwide aviation community to improve aviation safety. Accordingly, permission to make, translate, and/or disseminate copies of this document, or any part of it, with no substantive alterations is freely granted provided each copy states, “Reprinted by permission from the Global Aviation Information Network.” Permission to make, translate, and/or disseminate copies of this document, or any part of it, with substantive alterations is freely granted provided each copy states, “Derived from a document for which permission to reprint was given by the Global Aviation Information Network.” If the document is translated into a language other than English, the notice must be in the language to which translated.
For further information on this Technology Demonstration Mr. Brian Larder Smiths Aerospace Information Systems - Southampton School Lane -- Chandlers Ford Eastleigh, Hampshire SO53 4YG UK
[email protected] +44 (0)23 8024 2000 www.smiths-aerospace.com
Mr. Andy Muir GAIN Program Office Federal Aviation Administration / FSAIC 800 Independence Avenue, SW Washington, DC 20591 USA
[email protected] +1-202-267-9180 www.gainweb.org
Application of Smiths Aerospace Data Mining Algorithms to British Airways FDM Data
Table of Contents ACKNOWLEDGEMENTS .............................................................................................. II EXECUTIVE SUMMARY ............................................................................................... III GLOSSARY OF TERMS ...............................................................................................IV 1
INTRODUCTION................................................................................................. 1
1.1
Background – Safety Reporting and Flight Data Analysis in British Airways.................... 1 1.1.1 Safety Incident Reporting................................................................................... 1 1.1.2 Flight Data Monitoring........................................................................................ 2 Objective of the Project ..................................................................................................... 7 Overview of the Smiths Aerospace Data Mining Tool....................................................... 8 1.3.1 Algorithms Used on This Program................................................................... 10
1.2 1.3
2
PREPARATION OF DATA AND TOOL ........................................................... 15
2.1 2.2
Description of Input Data................................................................................................. 15 Data Capture, Cleansing and Transformation ................................................................ 16
3
OVERVIEW OF THE ANALYSIS PERFORMED.............................................. 17
4
EXAMPLE RESULTS AND FINDINGS ............................................................ 19
4.1
Flight Data Events ........................................................................................................... 19 4.1.1 Date-Related Trends........................................................................................ 19 4.1.2 Associations Between Events, and Events and ASRs .................................... 23 4.1.3 Associations Between Events and Specific Aircraft and Crews ...................... 25 4.1.4 Associations Between Events and Airport Locations ...................................... 25 Flight Data Measurements .............................................................................................. 32 4.2.1 Date-Related Trends........................................................................................ 32 4.2.2 Trends with Airport Locations .......................................................................... 36
4.2
5
ASSESSMENT OF RESULTS BY BRITISH AIRWAYS .................................. 51
5.1 5.2
Observations on Data Mining Tool and Suggestions for Improvement .......................... 52 Assessment of the Tool’s Value to Flight Safety Analysis .............................................. 52
6
CONCLUSIONS................................................................................................ 53
7
RECOMMENDATIONS – POSSIBLE NEXT STEPS ....................................... 54
8
REFERENCES.................................................................................................. 55
i
Application of Smiths Aerospace Data Mining Algorithms to British Airways FDM Data
Acknowledgements This project was funded by the US Federal Aviation Administration, Office of System Safety to facilitate the application of advanced methods and tools in the analysis of aviation safety data with the goal of improving aviation safety industry-wide. The project also involved the support and guidance of the Global Aviation Information Network (GAIN), an industry-led international coalition of airlines, manufacturers, employee groups, governments (including FAA) and other aviation organizations formed to promote and facilitate the voluntary collection and sharing of safety information by and among users in the international aviation community to improve aviation safety. Specifically, the project was guided by principles developed by GAIN’s Working Group B, “Analytical Methods and Tools” (WG B), which has been tasked with fostering the use of existing analytical methods and tools and the development of new tools that elicit safety information out of aviation data. Primary members of the project team included Brian Larder and Dr. Rob Callan of Smiths Aerospace; Captain Nigel Summerhayes of British Airways; Tom O’Kane, an Aviation Safety Consultant; and Andy Muir, of the FAA Office of System Safety and GAIN WG B.
ii
Application of Smiths Aerospace Data Mining Algorithms to British Airways FDM Data
Executive Summary Many airlines analyse data downloaded from flight data recorders to determine how their aircraft are being flown in order improve the safety of their flight operations. This process is known in Europe as Flight Data Monitoring (FDM) and in the USA as Flight Operations Quality Assurance (FOQA). Events occur when certain flight parameters exceed a predetermined threshold and, after investigation, these events are usually stored in an event database. Some airlines such as British Airways (BA) also record a selection of maximum or minimum parameter values (known as measurements) on every flight and store these in a separate database. The purpose of this Federal Aviation Administration sponsored proof-of-concept demonstration was to determine the additional value of applying data mining tools to these FDM databases as compared to the current analyses that airlines conduct. The demonstration was performed on British Airways’ flight data event and measurement databases for their Boeing 777-200 and 747-400 fleets. The event databases covered a period of three years from June 2001 and each contained approximately 2,500 records, whilst the measurement databases covered a two year period from June 2002 and each contained approximately 40,000 records. The data mining tool used for the project had been produced by Smiths Aerospace (Smiths) and contained learning algorithms such as Clustering, Decision Trees and Association Rules that Smiths had specifically adapted and developed for aerospace applications. Smiths carried out the data mining with input from BA, and the results were analysed and interpreted by a joint review team. The analysis conducted during this proof-of-concept demonstration delivered useful and intriguing results. As was expected, the most significant findings were already known to BA, which operates a very mature and comprehensive FDM program. These primary findings served to validate the tool and provide confidence in its results. However, the data mining tool also unearthed many interesting patterns and relationships at what could be called a “second level” down which had not previously been detected using existing analysis techniques. If they had been detected it is likely that they could have been dismissed as noise or random groupings. The demonstration showed that data mining can provide new insights into patterns and relationships within the databases of flight data events and measurements. Running preset mining models on these databases on a regular basis would provide airlines with useful additional safety management information. It should also improve the efficiency of the flight data analysis process. Both Smiths and BA believe that the proof-of-concept demonstration shows that data mining has a very useful role to play in Flight Data Monitoring, and will be a valuable complement to existing analysis tools.
iii
Application of Smiths Aerospace Data Mining Algorithms to British Airways FDM Data
Glossary of Terms ASR
Air Safety Report
ATC
Air Traffic Control
BA
British Airways
BASIS
British Airways Safety Information System
FAA
Federal Aviation Administration
FDE
Flight Data Exceedances
FDM (BA)
Flight Data Measurements
FDM
Flight Data Monitoring
FOQA
Flight Operations Quality Assurance
GAIN
Global Aviation Information Network
GPWS
Ground Proximity Warning System
GUI
Graphical User Interface
OLE DB
Microsoft component data base specification
PAPI
Precision Approach Path Indicator
SQL
Structured Query Language
TCAS
Traffic Collision Avoidance System
iv
Application of Smiths Aerospace Data Mining Algorithms to British Airways FDM Data
1 Introduction One of the goals of the FAA Office of System Safety (ASY) is to identify and evaluate methods and tools not previously applied to aviation safety data with the goal of improving aviation safety industry-wide. One of the most interesting developments in information management is the increasing use of “data mining” tools that can discover hidden patterns and relationships in data without specific queries from a human expert. Emphasis is placed on automated learning from data within large databases, although subject matter expertise from a human is always needed to review the initial results from a data mining project and to determine which of the patterns and relationships are of real interest. British Airways has many years of experience in the development and operation of an effective airline Flight Data Monitoring (FDM) program. Smiths Aerospace has developed a data mining tool that has successfully been applied to aircraft health monitoring data, and also to flight data from rotorcraft operations in the North Sea in Europe. Under a contract to RS Information Systems, Inc. Smiths Aerospace has carried out a proof-of-concept demonstration on the application of data mining algorithms to flight data from British Airways’ FDM program (see Reference [1], Statement of Work). The results of the proof-of-concept demonstration are presented in this report. Section 1 contains background information on the British Airways safety reporting and flight data monitoring programs, and also on the Smiths Aerospace data mining tool and algorithms used on this project. Section 2 describes the input data for the project and its cleansing and transformation, whilst Section 3 presents an overview of the data analysis performed. Section 4 represents the main body of the document and contains a wide selection of example analysis results and findings. Section 5 gives British Airways’ assessment of the results of the proof-of-concept demonstration. Summary conclusions from the project are presented in Section 6 and recommendations on the possible next steps are presented in Section 7.
1.1
Background – Safety Reporting and Flight Data Analysis in British Airways There are two mainstream methods of safety event monitoring in British Airways:
1.1.1
(i)
Safety incident reporting, covering Air Safety Reports (ASR), Ground Occurrence Reports, Cabin Safety Reports, Ground Handling Reports and Occupational Safety Reports
(ii)
Flight Data Monitoring, Measurements
covering
Flight Data
Events
and
Flight
Data
Safety Incident Reporting Using Air Safety Reporting as an example, the typical process is as follows. British Airways Flying Crew Orders define safety events that must be reported by the flight crew. If an incident occurs the flight crew will fill in an ASR form which will be entered into the British Airways Safety Information System (BASIS). The Air Safety department
1
Application of Smiths Aerospace Data Mining Algorithms to British Airways FDM Data
will investigate according to the seriousness of the event. Some event investigations will require significant effort whilst other events will just be recorded in the database. The BASIS tool helps manage single incident investigations and records the outcome and corrective actions. In addition to the investigation of an incident, the Air Safety department will classify all Air Safety incidents using the BASIS Descriptor Classification System (see Reference [2]). The classification system is based on Event Descriptors which describe a real or potential safety occurrence. Event Types are a convenient way of grouping Event Descriptors. Each Event Descriptor is unique and is found in the list of only one Event Type. The classification system also captures the Immediate Effect of the incident on the aircraft and what the Operational Effect was (if any). The purpose of the classification system is to enable easy querying and analysis of the ASR database to detect trends, anomalies unusual patterns etc. The BASIS software has well developed functionality that facilitates this analysis. The classification system and the associated software have been continually developed and improved over the past decade. Significant thought and effort was applied to the classification system by experts from the airline community in 2001 and 2002 in order to further enhance the system. Because of the quality of the classification system and the analysis functionality of the BASIS software, the British Airways Safety department has always believed that text mining applied to a BASIS ASR database was unlikely to provide significant new insight above what is already available using the current analysis tools. 1.1.2
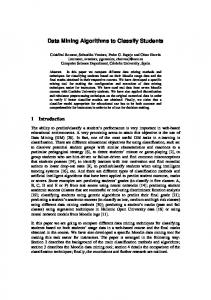
Flight Data Monitoring British Airways has a well developed Flight Data Monitoring system which measures or monitors how aircraft in a fleet are being flown by the analysis of data taken from the aircraft’s Quick Access Recorder. Safety events such as high energy approaches or deep landings are detected using sophisticated algorithms running in the event detection program called FDT (Flight Data Traces). A Go-Around example event is shown in Figure 1-1 below.
2
Application of Smiths Aerospace Data Mining Algorithms to British Airways FDM Data
Figure 1-1: Go-Around Event From FDT
The full list of the events that are monitored is presented in Appendix A. Validated events are transferred to the Flight Data Exceedances (FDE) database. FDE has the functionality to analyse events by aircraft type, event type, airfield, date, etc. and can present the results in graphical formats selected as most appropriate for that particular analysis. Example analysis outputs showing event frequency by Category and Location are presented in Figures 1-2 and 1-3 below.
3
Application of Smiths Aerospace Data Mining Algorithms to British Airways FDM Data
Figure 1-2: Event Frequency by Category
Figure 1-3: Event Frequency by Location
4
Application of Smiths Aerospace Data Mining Algorithms to British Airways FDM Data
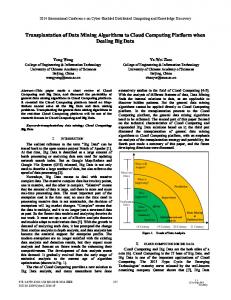
There is also an integrated risk analysis program that automatically assigns a "severity" to all events using exceedance margins, permitting comprehensive analysis of events by risk rather than frequency of occurrence. The severity index for glideslope deviation is shown in Figure 1-4 below.
Figure 1-4: Severity Index for Glideslope Deviation
Analysis of the FDE database can be performed in many ways, for example event rate per 1000 sectors, severity, location, pilot reference number etc. Obviously only the pre-determined events listed in Appendix A are monitored and detected. Events sharing the same Event Code are grouped together but no further classification of events takes place in a manner similar to the BASIS ASR Descriptor system. Therefore there is a greater opportunity for a data mining tool to provide new insights into the safety events contained in the database. Flight Data Measurements (FDM) is a different, but complementary, approach to the analysis of flight data. Instead of only looking at exceedances or events, FDM analyses the maximum or extreme value of many flight parameters on each and every flight. For example, maximum ‘g’ force on landing, maximum rate of descent, maximum pitch on landing etc. A full list of FDM parameters is presented in Appendix A. FDM can calculate and display a parameter’s distribution over thousands of flights. Two distributions on the same chart can easily be requested comparing, for example, the same measurement parameter on another aircraft type, registration, station, date range or against a standard normal distribution, as shown in Figure 1-5.
5
Application of Smiths Aerospace Data Mining Algorithms to British Airways FDM Data
Figure 1-5: Example of Normal Distribution Chart
The mean and standard deviation are automatically calculated for each distribution and can also be plotted to illustrate the spread of the maximum values, as shown in Figure 1-6.
6
Application of Smiths Aerospace Data Mining Algorithms to British Airways FDM Data
Figure 1-6: Example of Standard Deviation Chart
However, in addition to the current analysis techniques, there is significant potential for a data mining tool to detect unusual patterns and associations in the FDM database.
1.2
Objective of the Project The primary objective of the proof-of-concept demonstration was to determine whether data mining techniques can help improve airline or system safety by identifying unknown risks, or providing an ability to monitor the effectiveness of operational changes, that is currently not being achieved by the existing Flight Data Monitoring system. In addition, the potential for the data mining tool to perform existing analysis in a more effective manner and/or to provide regular management reports was investigated. The following factors were relevant in determining the specific safety analysis goals of this project. ¾
Most of the intellectual effort in Flight Data Monitoring has gone into the event detection algorithms in order to (a) improve event detection, (b) avoid the capture of non-events, (c) define new events which may have previously proved infeasible to detect (e.g. runway distance remaining) and (d) improve the display of events (e.g. overlay of track on approach plates). A classification system similar to that used in BASIS ASR has not been developed and thus the
7
Application of Smiths Aerospace Data Mining Algorithms to British Airways FDM Data
opportunity for data mining to produce meaningful new information is much larger. ¾
Air Safety Reports are those defined in Flying Crew Orders plus any other event or condition that the flight crew believe is unsafe. Flight data events can only include those specified thus there is a greater potential to miss unsafe conditions. The “you don’t know what you don’t know” syndrome.
¾
The FDM database of measurements is usually interrogated to find the answer to a specific query e.g. “how does the distribution of landing distance at one airfield compare to another”. The existing analysis tool can generate and display distributions but cannot look for anomalies. There is significant potential for a data mining tool to detect unusual patterns and associations in the FDM data base.
¾
Aircraft operating procedures are changed for a number of reasons. Sometimes the change is specific enough that it is relatively simple to monitor the consequences using the existing flight data tools. However, a data mining algorithm that was run regularly could detect adverse or favourable trends that could be linked to changes in operating procedures, training etc.
The specific safety analysis goals established for the proof-of-concept demonstration project were: (i)
Analyse the Flight Data Exceedances (i.e. event) database to detect previously unknown patterns or trends that could adversely affect flight safety.
(ii)
Analyse the Flight Data Measurements database, looking for unusual distributions or patterns that could identify areas of risk to the operation.
(iii)
Analyse the data by aircraft registration and fleet to identify flight data recording equipment or sensor problems.
(iv)
Crosscheck the existing software; i.e. a comparison between fleets may indicate that there are events going undetected in a fleet due to incorrect specification or programming.
(v)
Detect current known patterns as a validation of the effectiveness of the data mining tool.
(vi)
Determine if the data mining tool could provide the existing functionality in a more effective manner than the current system.
The data mining demonstration was performed on FDE and FDM data from the British Airways Boeing 777-200 and Boeing 747-400 aircraft fleets.
1.3
Overview of the Smiths Aerospace Data Mining Tool The tool used on this program is a state-of-the-art data mining tool that has been produced by Smiths Aerospace (Smiths). The tool contains algorithms found in many
8
Application of Smiths Aerospace Data Mining Algorithms to British Airways FDM Data
commercial data mining packages such as Clustering, Decision Trees, Association Rules, etc. The philosophy behind the tool development is to take those algorithms from the research community that are generally recognised as being ‘best in class’ and adapt/extend them for aerospace applications. This requirement to provide ‘the best solution for the application’ drove the need for Smiths to develop its own data mining tool since the mix of algorithm capabilities being sought were not available in any single commercial tool. As Smiths’ aerospace application domains are demanding and present some novel challenges, it is imperative that the company has the ability to adapt and develop the tool’s capabilities. Data mining tools need good interfaces to the data and the user. The data interface must handle different data storage formats and facilitate the processing of large volumes of data. The user interface must assist the analyst in managing the construction of mining models1 and the browsing of mining results. In the Smiths data mining tool these interfaces are kept separate from the mining algorithms. This separation is facilitated by the adoption of a data mining framework standard produced by Microsoft in consultation with other data mining tool vendors. This standard is called the ‘OLE DB for Data Mining Specification’. A query engine forms part of the data mining framework. This engine processes data mining language extensions to SQL. Within the framework a mining model is treated conceptually as a relational table. In standard SQL there are commands to CREATE a table, INSERT INTO to populate a table, and SELECT to browse the contents of a table. Treating a mining model as a special type of table provides enormous flexibility. SQL type commands are used to train mining models and to query their results or make predictions. These commands provide the link between the data and mining algorithms, and also between user requests and mining results. The real appeal of the data mining framework is that it provides a generic specification for the way in which mining algorithms should interface to the data and the types of query which mining results should support. Smiths’ data mining tool is not designed to be an off-the-shelf commercial product for general purpose use. Such products must appeal to a wide user base, and a large amount of effort has to be placed into providing a generic user interface with comprehensive data views, charts, menus and tips. Smiths see more value in concentrating effort on algorithm capability and the data interface. Aerospace application domains present specific challenges and Smiths’ focus is on providing solutions to these challenges, utilising (i) its experience developing a range of aerospace products, (ii) its application knowledge and (iii) skills in artificial intelligence and data mining. The emphasis for Smiths therefore is on extending the tool’s core algorithm capabilities to meet specific application requirements. A customer’s requirements can be satisfied either by a customised tool, or an analysis support contract, or a combination of the two. The adoption of the ‘OLE DB for Data Mining Specification’ facilitates this approach by enabling the Smiths data mining tool to leverage third party products for the user interface. For example, the Smiths data mining tool has been demonstrated through a range of interfaces: Microsoft’s Analysis Services, a Microsoft command driven query tool, Smiths specific interfaces for both client machine and web services, and a tool add-in for Microsoft’s Excel. Some example GUIs are shown in Figure 1-7. This ability to interface to a wide range of GUIs 1
A mining model is the structure and collection of statistics learnt from the data. A model may be in the form of a decision tree, or a collection of clusters, or a collection of rules, etc. Internally, the model is stored as a table which offers flexibility for querying or when used to perform predictions.
9
Application of Smiths Aerospace Data Mining Algorithms to British Airways FDM Data
and databases means that the application specific capability provided by Smiths is unrivalled by any single commercial data mining product.
Figure 1-7: Example Data Mining Tool GUIs
1.3.1
Algorithms Used on This Program The primary Smiths algorithms used for mining of the BA FDE and FDM data were “Decision Tree”, “Cluster” and “Association Rules” learning algorithms. The three algorithms provide complementary ‘views’ on the data and, by combining their outputs, a clear picture of significant patterns or trends can be provided. All algorithms have predictive capabilities. Decision Trees have proved to be one of the most practical machine-learning algorithms applied to real-world problems. The Decision Tree can be applied to discrete or continuous data, and is a ‘supervised’ algorithm that derives decision boundaries to partition data according to particular characteristics. For example it can search for regions in the event or measurement data that characterise airport locations. It learns to predict the values of a predictable attribute (or item of information, e.g. takeoff/landing location, pilot, event type) from a set of predictor attributes (i.e. other items of information). The algorithm can learn to predict multiple attributes during a single learning run. The learnt prediction model is represented as a tree with ‘nodes’ and ‘branches’, where a node denotes an attribute, and a branch an attribute value. A path
10
Application of Smiths Aerospace Data Mining Algorithms to British Airways FDM Data
in the tree represents a particular combination of attribute values (e.g., location = x and pilot = y). All nodes along a path contain statistics representing the distribution of the predicted values corresponding to the predictor values denoted by that path. A pruning algorithm limits the size of the tree based on configurable input parameters. Figure 1-8 shows an example Decision Tree and the statistics of a selected node.
Figure 1-8: Decision Tree and Output Statistics of a Selected Node
11
Application of Smiths Aerospace Data Mining Algorithms to British Airways FDM Data
The Cluster algorithm is an ‘unsupervised’ algorithm that partitions data (e.g. flight data measurements) into a number of groups or clusters. The data items within a cluster have more in common with other items in the same cluster than they do with items in other clusters – items within a cluster are said to be similar. Clustering can therefore reveal any natural structuring in the data. The cluster technique models the statistical distribution of the data using a maximum likelihood algorithm. The version implemented by Smiths has many powerful features, for example an ability to indicate the optimum number of clusters, and the availability of many parameters to control the complexity of the model. Both continuous and discrete attributes can be input to the cluster algorithm. Different types of predictions are supported by the algorithm, which adds significantly to its capability for constructing statistical models. Figure 1-9 presents example Cluster plots and the statistics of a selected cluster. The left hand display shows the cluster locations and sizes (at one standard deviation), with the input data overlaid on the plot. The right hand display shows a “heat map” to indicate the density of the data in the different regions of the plot (lighter colour = higher density).
Figure 1-9: Cluster Plots and Output Statistics of a Selected Cluster
12
Application of Smiths Aerospace Data Mining Algorithms to British Airways FDM Data
The Association Rules algorithm detects significant associations between objects (e.g. there is a high probability of ‘deep landing’ at location x). Associations are expressed as conditional rules and a single rule can express the association between multiple objects. A notion of significance is specified using a number of algorithm parameters. The Association Rules algorithm was primarily applied to the event data, which is discrete data, but it could also be applied to continuous (i.e. measurement) data. Figure 1-10 presents an example set of learnt association rules.
Figure 1-10: Association Rules Algorithm Outputs
All three learning algorithms generate similar statistics to indicate the significance of patterns discovered in the data. The key statistics are: ¾
“Confidence” or “Probability”: This is the proportion of the data items contained within a particular tree node or cluster that have a particular association (e.g. the proportion for which the airport was JFK). For the Association Rules it is the proportion of the first named data item for which a particular rule applies (e.g. the proportion of event 24s that exist for which an event 44D also exists).
¾
“Support” or “Cases”: This is simply the number of data items contained within a particular tree node or cluster that have a particular association (e.g. the number of cases for which the airport was JFK). For the Association Rules it is the number of data items for which a particular rule applies (e.g. event 24 exists and event 44D exists).
¾
“Lift”: This is a normalised measure of the significance of an identified pattern in the data. It is a ratio between the observed number of data items contained within a particular tree node or cluster, or for which a particular rule applies, that have a particular association (e.g. the number of cases of event 21B for which the airport was JFK) to the expected number given a random distribution of the data item associations (e.g. assuming that the rate of event 21B occurrences at JFK should be in proportion to the rate of occurrence of all events at JFK). Two normalisation methods were used for an analysis of events occurring at different airport locations, the first based on the rate of occurrence of all events at the different locations, and the second based on the number of sectors flown to those locations (identified from the number of flight data measurement records). A lift value of 1 means that the observed number of data items exactly matches the expected number assuming a random distribution of the data. A lift value of less
13
Application of Smiths Aerospace Data Mining Algorithms to British Airways FDM Data
than 1 means that there are less data items than expected, and a value of greater than 1 means that there are more items than expected. For this analysis, lift values of greater than 2 were considered to be significant in terms of the identification of abnormally high concentrations of data items.
14
Application of Smiths Aerospace Data Mining Algorithms to British Airways FDM Data
2 Preparation of Data and Tool 2.1
Description of Input Data Two BA long haul fleets were analysed in the data mining demonstration; the Boeing 777-200 (777) fleet and the Boeing 747-400 (744) fleet. Two data sets were acquired for each fleet, the first set from BA’s FDE database of events and the second from the FDM database of measurements. For both fleets the FDE data covered the period from June 2001 to June 2004 and the FDM data covered the period from June 2002 to June 2004. The FDM database is much larger than the FDE database because a measurement record is generated for every flight, whereas events are only detected on a small percentage of flights (typically less than five percent). The Boeing 777-200 data comprised 2,169 event records (from FDE) and 40,813 measurement records (from FDM). The Boeing 747-400 data comprised 2,550 event records and 39,709 measurement records. Each event record contained 24 data items and each measurement record contained 87 different parameters. All the FDE event codes and their descriptions are listed in Table A1 in the Appendix. The FDM measurement names and descriptions are listed in Tables A1 and A2, with Table A1 containing those measurements that can be directly related to a particular event code. In addition to the event parameters, the event records contained the following documentary data fields which were used during the analysis: ¾ ¾ ¾ ¾ ¾ ¾ ¾ ¾
Aircraft Registration Departure Airfield Landing Airfield Crew codes for Captain and Co-pilot (de-identified) Severity measure for the event Flight phase (take-off, climb, cruise, descent, approach, go-around, and landing) ASR flag (whether or not an Air Safety Report was raised) Date
In addition to the measurement parameters, the measurement records contained the following documentary data fields which were used during the analysis: ¾ ¾ ¾ ¾ ¾ ¾
Aircraft Registration Departure Airfield Landing Airfield Landing Runway Date Aircraft Weight at take-off and landing
To prevent the identification of individual flights, for this project BA translated the dates in both the event and measurement records to the first day of the month. Therefore it was only possible to identify the month and year on which a record was generated, and not the day.
15
Application of Smiths Aerospace Data Mining Algorithms to British Airways FDM Data
2.2
Data Capture, Cleansing and Transformation The event and measurement data were supplied as “comma separated variable” files (CSV format). Since, in data mining terms, the volume of the data was relatively small, and the duration of this program was short, it was determined that the data cleansing and transformation would prove more efficient if the data was stored in Microsoft Excel. Excel is a convenient tool for data exploration, which involves searching for unbelievable values, potential outliers, correlations between measured parameters, missing values, etc. At a late stage in the analysis, the data was imported into Microsoft’s SQL Server using Data Transformation Services. Excel was still used as a convenient interface for executing the data mining analysis but the data was retrieved directly from the database using SQL queries formatted from within Excel. The use of SQL Server would normally be the preferred option when performing data mining since it provides a high level of data security, facilitates complex data queries, and assists in providing a record of the analysis. Overall, the integrity of the FDE data was good. There were some missing crew codes and upon inspection of the mining analysis results it became clear that the raising of ASRs was not always recorded in the database. As a result of this study the link between the ASR and FDE databases has been automated to improve the matching of records. There was no transformation of the FDE data other than the extraction of two additional parameters for ‘date-month’ and ‘date-year’. The integrity of the FDM data was also good. Some records had one or more missing measurements that had been given an out-of-range code. For some parameters there was a lot of missing data due to the fact that these measurements were introduced after June 2002. Many of the measurement parameters are associated with particular flight phases and there is little relationship between parameters calculated in different flight phases. Therefore each analysis performed concentrated on different subsets of parameters. For this reason there was no generic cleanup of the FDM data. Instead, the cleanup was performed online during each analysis. This cleanup included removing records for which the relevant measurements were not available. Histograms for individual measurement parameters were produced as part of the data integrity checking process. These histograms often suggested that the measurement results could contain some noisy data (i.e. data at the extreme tails of a distribution). A decision was made to keep the ‘suspected noise data’ in the analysis to determine its nature and to identity it as either ‘true’ noise or ‘patterns of interest’. Additional parameters for ‘date-month’ and ‘date-year’ were extracted for each record in the FDM data. At a late stage in the analysis it was suggested that, in addition to searching for associations with landing location, identifying associations with a particular runway could provide useful additional information. There is no explicit recording of the runway used for landing in the FDM data, but it is possible to derive this given the landing airport and aircraft heading at touch down. Each flight was tagged with a string composed from the landing location and touch down heading. This heading could not be used directly since for a given location and runway it could vary by several degrees. Instead a simple rounding formula was applied on the assumption that this was sufficient to correctly associate most flights with runway usage.
16
Application of Smiths Aerospace Data Mining Algorithms to British Airways FDM Data
3 Overview of the analysis Performed This project was a short duration proof of concept demonstration of the application of data mining techniques to airline flight data. Owing to the time constraints the analysis performed had to be of limited scope. It is important to stress that the objective was to perform example analyses to demonstrate the concept and potential benefits of data mining, rather than perform an exhaustive analysis of BA’s 777 and 744 event and measurement data. Smiths and BA had two review meetings during the analysis process. The project was an investigative exercise for both parties, with BA learning about the capabilities of the data mining algorithms, and Smiths increasing its knowledge of the information provided by the flight data events and measurements. There is clearly a need for future work to build on the experience gained from the exercise in order to produce an operational data mining capability. Recommendations on the next steps towards the development of such a capability are presented in Section 7. In general terms, the focus of the analysis effort was to mine the event and measurement records to search for hidden patterns in the data, and associations with the documentary data fields listed in Section 2.1. In addition the following items were specifically examined: ¾
The association of events and measurements with take-off and landing location and runway.
¾
The association of events with crew codes. These codes are not currently included in the measurement records.
¾
The association of events with aircraft registration.
¾
Detecting date-related patterns and adverse trends.
¾
The level of voluntary safety reporting (i.e. the raising of ASRs), and therefore associations between events and ASRs.
The analysis of the event data included searches for all of the above associations. The measurement data should give a richer picture of operational variations than the events, and enable abnormalities to be highlighted even where no events are being generated. However, with less documentary data fields, the measurement analysis was limited to searching for associations with location/runway and date. Although the event and measurement analyses were performed separately, where relevant the findings from these analyses were correlated to provide the most complete picture of operational risks. In addition, the measurement data was assessed to determine what additional information this could provide on specific associations, and whether there was evidence to suggest that any event limits should be changed. In addition to the general focus of the analysis described above, some analysis effort was directed to answering specific questions raised at the BA/Smiths review meetings. Examples of such questions are; Is there any association between high energy or
17
Application of Smiths Aerospace Data Mining Algorithms to British Airways FDM Data
unstable approaches and poor landings? Are there any significant patterns contained in the tails of measurement distributions? All three learning algorithms described in Section 1.3.1 (Decision Trees, Clustering and Association Rules) were applied to the event and measurement data. Where relevant, the different algorithm outputs were compared to identify the extent to which these identified common patterns, or whether a pattern was more clearly detected by one particular algorithm. The event records (from the FDE database) were originally analysed in isolation. As the FDE data only contained records of flights on which one or more events occurred, and did not include flights on which there had been no event, all results were conditioned on the basis of the events that had occurred, and not the occurrence rate of events in terms of the number of sectors flown. For example, the analysis could identify an abnormal number of occurrences of event E at location L in terms of all the events generated at that location, but not whether the occurrence rate of event E was abnormal in terms of the number of sectors flown to location L. At the request of BA, Smiths subsequently performed some additional analysis, linking the event and measurement records from the FDE and FDM databases to enable results to be conditioned on the basis of the number of sectors flown to different locations. The findings from these two approaches to result conditioning were then compared. The linking of the event and measurement records was hampered by the de-identification of the two data sets, (i.e. with dates only identified as months and years), so that it was not possible to directly link event and measurement records generated on the same flight. It is recommended that future data mining is performed with identified data, or if de-identified, data linked with an added unique key field.
18
Application of Smiths Aerospace Data Mining Algorithms to British Airways FDM Data
4 Example results and findings This section presents example results and findings from mining of the event and measurement databases. The event analysis results are presented first, and are categorised according to the types of association found in the data. Data mining tools are normally used to build predictive models. Therefore models of interest are usually restricted to those that reveal patterns with high values of support. When examining results the reader should keep in mind that the data mining tool is being used as an intelligent query tool to highlight patterns of interest and not for building reliable predictive models. It is therefore valid to have patterns of interest with low values of support.
4.1 4.1.1
Flight Data Events Date-Related Trends
4.1.1.1 Changes to Analysis Configuration and Routes Operated A Decision Tree mining model identified date related trends in the rate of occurrence of events that were due to changes in the flight data analysis program. For example, the mining highlighted that event 40C (abnormal configuration, speedbrake with flap) ceased occurring on the 777 fleet in January 2003. On the 777 use of speedbrake with flap is allowed, therefore BA had discontinued the event on this fleet at that time. The Decision Tree shown in Figure 4-1 has identified the date of January 2003 as being the most significant in terms of changes in the occurrence of events in the approach phase. There were a large number of 40C events before that date, but none after, and the event has a strong association with the node representing the period before that date, with a lift value of 5.5. Some new events such as 06H (high energy at 8nm) were also introduced at the same time, and Event 06H has a strong association with the node representing the period after that date, with a lift value of 6.8.
19
Application of Smiths Aerospace Data Mining Algorithms to British Airways FDM Data
Figure 4-1: Decision Tree Identifying Date-Related Changes in Event Occurrences
The mining of the flight data measurements also identified some date-related trends that were associated with changes in the routes flown by the fleet types (see Section 4.2.1). Both these examples illustrate the fact that the mining is being performed on a dynamic data set, subject to changes as a result of changes to the flight data analysis being performed, and the routes being flown. These changes tended to mask the identification of trends which may be of interest for flight safety. Cleaning could be performed to remove data affected by known changes prior to mining, but this would be a relatively time consuming task. The dynamic nature of the data suggests that there should be a limit to the period over which historical data is included in any mining process. For the initial mining of the event data a three year period was used. For the additional analysis (see Section 4.1.4) this was limited to a two year period.
20
Application of Smiths Aerospace Data Mining Algorithms to British Airways FDM Data
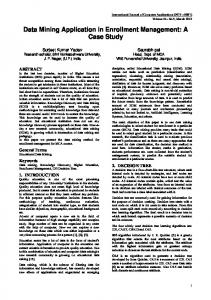
4.1.1.2 Weather Related Events in October 2002 In a cluster model of 777 event data, the most significant features of one cluster were the presence of 44D events (GPWS windshear warning) with a lift of 24.0, and the dominance of the month of October 2002 with a lift of 18.7. Statistics for cluster 10 are presented in Figure 4-2. A GPWS warning should result in a go-around, so there is an association between events 44D and 24 (go-around from below 1000ft). A subsequent query of the event database confirmed that 11 of the 18 44D events on the 777 had occurred in the month of October 2002, and that the 11 events all occurred at the London airports of STN (Stansted), LHR (Heathrow) and LGW (Gatwick). The data mining is highlighting the effects of bad weather in the UK during the month of October 2002.
Figure 4-2: Single Cluster Event and Date Statistics
21
Application of Smiths Aerospace Data Mining Algorithms to British Airways FDM Data
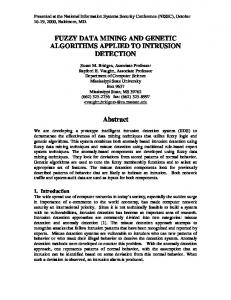
4.1.1.3 Apparent Change in the Raising of ASRs Through a link between BA’s FDE and BASIS ASR (Air Safety Report) databases, the events database is updated to include a record of whether or not an ASR was raised for each event. The Cluster and Decision Tree analysis identified an apparent large drop in the raising of ASRs on both the 777 and 747 fleets around the period of June to December 2003. This was confirmed by a subsequent query of the event database. Figure 4-3 shows the monthly percentage of event 24s (Go-Around) that have an associated ASR record on the 744 fleet. All Go-Arounds should trigger the raising of an ASR, however it can be seen that there is almost a complete absence of ASRs between June 2003 and January 2004. There was in fact no drop off in aircrew’s raising of ASRs, and the missing ASR records in the FDE database were actually due to a temporary problem with linking of the ASR and FDE databases at the time BA introduced a new incident reporting system called eBASIS. Therefore the data mining is identifying a system problem, and not a reporting problem. 744: Percentage of Event 24s with associated ASR 120
100 80
60 40
20
01 ct -0 D 1 ec -0 1 Fe b02 Ap r -0 2 Ju n02 Au g02 O ct -0 D 2 ec -0 2 Fe b03 Ap r -0 3 Ju n03 Au g03 O ct -0 D 3 ec -0 3 Fe b04 Ap r -0 4
g-
O
Au
Ju
n-
01
0
Figure 4-3: ASR Records for Event 24
British Airways was aware of the three issues highlighted above. However they do show that the mining tool is correctly identifying anomalies and thereby verify the accuracy of the tool and provide confidence in other reported results.
22
Application of Smiths Aerospace Data Mining Algorithms to British Airways FDM Data
4.1.2
Associations Between Events, and Events and ASRs
4.1.2.1 Event Associations Tables 4-1 and 4-2 present outputs from the Association Rules algorithm, highlighting the most significant associations between events on the 777 and 744 fleets respectively. Table 4-1: Significant Event Associations on 777 Fleet Events 48B → 44B 19A → 50A 44D → 24 08A → 08B
Confidence 0.31 0.76 0.67 0.27
Support 13 13 10 33
Lift 12.3 9.49 7.65 6.52
The following comments can be made on the 777 event associations: 1
48B (reduced flap landing) – 44B (GPWS soft warning): This is a natural consequence of the GPWS requirement to generate a soft warning (“too low flaps”) if Land Flap is not selected by final approach.
2
19A (long flare) – 50A (deep landing): There is a natural physical relationship between these events, in that a long flare will often result in a deep landing.
3
44D (GPWS windshear warning) – 24 (Go-Around from below 1000ft): BA Flying Crew Orders require that a Go-Around should be flown following a GPWS windshear warning on approach unless previously briefed in accordance with Flying Crew Orders. Identifying negative associations between events, for example where a 44D event does not have an associated 24 event, would be a useful addition to the analysis capability and should be included in any implementation.
4
08A (climb out speed high below 400ft) - 08B (climb out speed high 400 to 1,000ft): This association shows that, in approximately one third of the occurrences of a high climb out speed in the first phase of flight, this has still not been corrected by the second phase. Many of these cases were related to takeoffs at low gross weight. Table 4-2: Significant Event Associations on 744 Fleet Events 06J → 06K 56A → 44B 19A → 50A
Confidence 0.833 0.83 0.9
Support 5 19 28
Lift 74.84 11.1 3.83
The following comments can be made on the 744 event associations: 1
06J (high energy at 1,000ft) – 06K (high energy at 500ft): This shows that crews are unable to reduce excess speed as often as would be desired. What is
23
Application of Smiths Aerospace Data Mining Algorithms to British Airways FDM Data
interesting is that this correlation does not show up on the 777 fleet. This is probably due to differences in the way the final approach is flown. On the 777 the auto throttle is engaged to touchdown, whereas on the 744 when the auto pilot is disengaged the auto throttle is also disengaged. Therefore the events may be due to the greater degree of manual throttle control during the final approach on the 744. 2
56A (deviation under glideslope) – 44B (GPWS soft warning): The GPWS is programmed to warn crew if they deviate significantly below the glideslope
4.1.2.2 Associations Between Events and ASRs Tables 4-3 and 4-4 present outputs highlighting the most significant associations between events and ASRs on the 777 and 744 fleets respectively. Table 4-3: Associations Between Events and ASRs on 777 Fleet Events 44D → ASR = R 24 → ASR = R 02A → ASR = R 49 → ASR = R 44C → ASR = R 23B → ASR = R 48B → ASR = R 46A → ASR = R 24A → ASR = R
Confidence 0.67 0.68 0.53 0.47 0.43 0.38 0.36 0.33 0.31
Support 12 110 10 70 9 5 15 4 15
Lift 4.82 4.65 3.81 3.37 3.1 2.78 2.58 2.41 2.21
Table 4-4: Associations Between Events and ASRs on 744 Fleet Events 24 → ASR = R 46A → ASR = R 24A → ASR = R 49 → ASR = R 23C → ASR = R 44D → ASR = R
Confidence 0.6 0.49 0.47 0.4 0.34 0.33
Support 224 40 27 44 21 3
Lift 3.65 2.99 2.87 2.42 2.1 2.02
The percentages of events with ASRs raised (as shown by the confidence statistic) indicated in the above tables will have been affected by the problems of capturing the ASR information in the FDE database that were discussed in Section 4.1.1.3. However, this analysis should be useful in reinforcing to flight crew the requirement to report certain events as ASRs. The crew will have been aware of all of the above events except possibly 23C (high normal acceleration on landing) and all should be reported.
24
Application of Smiths Aerospace Data Mining Algorithms to British Airways FDM Data
4.1.3
Associations Between Events and Specific Aircraft and Crews Table 4-5 shows significant associations between events and de-identified crew codes on the 744 fleet. Only one significant association was found, and this was that two crew were responsible for 13% of all the 09A events (high pitch rate on take-off) occurring on the 744 fleet. This information will be fed into the BA pilot events studies. Table 4-5: Associations Between Events and Crew on 744 Fleet Events & Crew
CODE = 09A → 20161 CODE = 09A → 61481
Confidence 0.06 0.07
Support 6 7
Lift 3.16 3.16
Table 4-6 shows significant associations between events and aircraft registrations on the 777 fleet. It can be seen that 14% of all the 23A events (high normal acceleration on ground) and 23D events (firm nose wheel touchdown) occurred on aircraft GVIIC. This information has been passed to BA engineering. Table 4-6: Associations Between Events and Aircraft Registration on 777 Fleet Events & A/C Reg
CODE = 23D → GVIIC CODE = 23A → GVIIC 4.1.4
Confidence 0.14 0.14
Support 6 12
Lift
3.22 3.1
Associations Between Events and Airport Locations This is the most interesting result category, as factors associated with different airport locations cause the greatest operational variability and, as these are usually outside an airline’s control, they are the most difficult for a single airline to address. Results are presented separately for the 777 and 744 fleets, and also for the flight phases of (i) approach and landing, and (ii) take-off and climb. Two sets of results from the Association Rules algorithm are presented for each combination of fleet type and flight phase. As explained in Section 3, in the initial analysis lift values were normalised according to the rate of occurrence of events at different locations. These results are presented second. Additional analysis was then performed, linking the event and measurement data to enable lift values to be normalised according to the number of sectors flown to different locations. These results are presented first. All results are sorted according to the magnitude of the lift value.
4.1.4.1 777 – Landing Tables 4-7 and 4-8 present Association Rules outputs for events occurring on the 777 fleet in the flight phases of approach (A), landing (L) and Go-Around (G).
25
Application of Smiths Aerospace Data Mining Algorithms to British Airways FDM Data
Table 4-7: 777 Landing Events, Lift Calculation Based on Number of Sectors Flown Flight Phase = A, L, G
CODE = 56B → TO = JED CODE = 56B → TO = ABV CODE = 23A → TO = BDA CODE = 45A → TO = GRU CODE = 43 → TO = DFW CODE = 06H → TO = DFW CODE = 48B → TO = ORD CODE = 06H → TO = PHX CODE = 50A → TO = DXB CODE = 06H → TO = MCO CODE = 40C → TO = GRU CODE = 23C → TO = DEN CODE = 50A → TO = AUH CODE = 06H → TO = BOS CODE = 43 → TO = IAH CODE = 06H → TO = ORD CODE = 23C → TO = IAH CODE = 23A → TO = EWR CODE = 23C → TO = ORD CODE = 43 → TO = ORD CODE = 40C, CODE = 43 → TO = LHR
Confidence
Support
Lift
0.21 0.17 0.12 0.38 0.10 0.08 0.21 0.07 0.13 0.07 0.12 0.06 0.09 0.08 0.08 0.11 0.08 0.10 0.08 0.07 0.63
6 5 6 5 7 6 6 5 11 5 10 5 8 6 6 8 7 5 7 5 5
38.04 19.77 17.06 14.52 7.36 6.14 6.06 5.62 5.47 4.70 4.49 4.35 3.54 3.29 3.22 3.17 3.15 3.00 2.38 2.03 2.03
Table 4-8: 777 Landing Events, Lift Calculation Based on Number of Events Flight Phase = A, L, G CODE = 56B → TO = JED CODE = 23A → TO = BDA CODE = 45A → TO = GRU CODE = 56B → TO = ABV CODE = 50A → TO = AUH CODE = 50A → TO = DXB CODE = 40C → TO = SAN CODE = 48B → TO = ORD CODE = 06H → TO = PHX CODE = 43 → TO = DFW CODE = 06H → TO = DFW CODE = 40C → TO = GRU CODE = 06H → TO = MCO CODE = 23A → TO = EWR CODE = 06H → TO = ORD CODE = 06H → TO = BOS CODE = 43 → TO = IAH CODE = 23C → TO = IAH
Confidence 0.21 0.12 0.38 0.17 0.09 0.13 0.08 0.21 0.07 0.10 0.08 0.11 0.07 0.10 0.11 0.08 0.08 0.08
26
Support 6 6 5 5 8 11 7 6 5 7 6 10 5 5 8 6 6 7
Lift 15.86 10.12 9.01 8.07 5.29 4.96 4.84 4.15 3.75 3.67 3.07 2.69 2.44 2.34 2.14 2.11 2.04 2.02
Application of Smiths Aerospace Data Mining Algorithms to British Airways FDM Data
A number of the items in the above tables support what is already known about certain airports. A few examples are given below. When the sectors information is used in the lift calculation, the two highest lift values are for 56B (deviation above glideslope) events at JED (Jeddah) and ABV (Abuja). The prominence of these two locations in the occurrence of 56B events is confirmed by a specific query of BA’s FDE database (Figure 4-4). There are known issues at JED with alignment of the PAPIs and glideslope, and also with the visual aspects of the final approach to ABV.
Figure 4-4: FDE Database Query for Event 56B
All the 6H events (high energy at 8nm) are into USA airfields [e.g. PHX (Phoenix), MCO (Orlando), DFW (Dallas) and BOS (Boston)] and are due to ATC procedures. The high rate of occurrence of 50A events (deep landing) at DXB (Dubai) and AUH (Abu Dhabi) is expected as the airports have long runways and are on training routes. The 48B (reduced flap landing) events at ORD (Chicago) and other busy airfields are as a result of the aircraft QRH checklist actions. In the event of extended holding at these airfields a “low fuel” warning can be received and the QRH action is to make a flap20 landing instead of the normal flap30. The 23C events (high normal acceleration at touchdown) at DEN (Denver) are probably caused by the high altitude of the airport. 4.1.4.2 777 – Take-Off Tables 4-9 and 4-10 present Association Rules outputs for events occurring on the 777 fleet in the take-off (T) and climb (C) phases.
27
Application of Smiths Aerospace Data Mining Algorithms to British Airways FDM Data
Table 4-9: 777 Take-Off Events, Lift Calculation Based on Number of Sectors Flown Flight Phase = T,C CODE = 08A → FROM = LTN CODE = 49 → FROM = EWR CODE = 08D → FROM = ORD CODE = 08A → FROM = ORD CODE = 08A → FROM = BOS
Confidence 0.08 0.32 0.19 0.10 0.07
Support 7 7 6 9 6
Lift 241.50 9.51 5.77 2.95 2.75
Table 4-10: 777 Take-Off Events, Lift Calculation Based on Number of Events Flight Phase = T,C CODE = 49 → FROM = EWR CODE = 23A → FROM = LHR CODE = 08D → FROM = ORD
Confidence 0.32 0.63 0.19
Support 7 5 6
Lift 4.12 2.85 2.38
Again, some of the items in the table are expected, for example the prominence of event 49 (TCAS resolution advisory) at EWR (New York Newark) is due to the very busy airspace. Other items were unexpected, such as event 08A (climb out speed high below 400ft) at LTN (Luton), however this is confirmed by the result of a specific query of BA’s FDE database shown below (Figure 4-5). The item does not appear in the second table, and is only prominent in the first owing to the small number of sectors flown to/from LTN. These events are caused by low gross weight take-offs subsequent to diversions to Luton.
Figure 4-5: FDE Database Query for Event 08A
28
Application of Smiths Aerospace Data Mining Algorithms to British Airways FDM Data
Conversely an item in the second table, 23A events (high normal acceleration on ground) at LHR (London Heathrow) does not appear in the first table. All the events occurred in May/June 02 and were caused by the runway resurfacing program at LHR. 4.1.4.3 744 – Landing Tables 4-11 and 4-12 present Association Rules outputs for events occurring on the 744 fleet in the flight phases of approach, landing and Go-Around. Table 4-11: 744 Landing Events, Lift Calculation Based on Number of Sectors Flown Flight Phase = A, L, G CODE = 58B → TO = SYD CODE = 21B → TO = JFK CODE = 06H → TO = SFO CODE = 42 → TO = JFK CODE = 06H → TO = MIA CODE = 56B → TO = SFO CODE = 19A, CODE = 50A → TO = SIN CODE = 56B → TO = SYD CODE = 19A → TO = SIN CODE = 56B → TO = HKG CODE = 06K → TO = JFK CODE = 24 → TO = MIA CODE = 42B → TO = JFK CODE = 56B → TO = MIA CODE = 50A → TO = BKK CODE = 44B → TO = JNB CODE = 50A → TO = HKG CODE = 24 → TO = SFO CODE = 50A → TO = JNB CODE = 24 → TO = JFK CODE = 06H → TO = LAX CODE = 44B → TO = NRT CODE = 24A → TO = JFK
Confidence 0.50 1.00 0.30 0.89 0.23 0.16 0.23 0.12 0.21 0.11 0.33 0.11 0.29 0.09 0.07 0.07 0.06 0.05 0.06 0.17 0.06 0.05 0.15
Support 4 6 25 8 19 16 6 12 6 11 6 21 4 9 20 6 16 10 16 32 5 5 5
Lift 21.14 13.56 13.20 12.05 8.17 6.96 5.06 4.98 4.70 4.59 4.52 3.97 3.87 3.19 2.65 2.57 2.47 2.32 2.28 2.27 2.24 2.24 2.05
Table 4-12: 744 Landing Events, Lift Calculation Based on Number of Events Flight Phase = A, L, G CODE = 58B → TO = SYD CODE = 21B → TO = JFK CODE = 42 → TO = JFK CODE = 19A → TO = SIN CODE = 06H → TO = SFO CODE = 56B → TO = SYD CODE = 06H → TO = MIA CODE = 56B → TO = HKG CODE = 06K → TO = JFK CODE = 06H → TO = LAX
Confidence 0.50 1.00 0.89 0.21 0.30 0.12 0.23 0.11 0.33 0.06
29
Support 4 6 8 6 25 12 19 11 6 5
Lift 17.06 8.97 7.97 6.30 4.09 3.98 3.15 3.05 2.99 2.62
Application of Smiths Aerospace Data Mining Algorithms to British Airways FDM Data CODE = 42B → TO = JFK CODE = 50A → TO = SIN CODE = 44B → TO = NRT CODE = 56B → TO = SFO CODE = 50A → TO = BKK CODE = 27A → TO = LHR
0.29 0.08 0.05 0.16 0.07 0.50
4 22 5 16 20 5
2.56 2.28 2.23 2.13 2.13 2.00
Tables 4-11 and 4-12 highlight issues with JFK (New York John F Kennedy) airport. These become even clearer when all three years of event data are included, and the analysis is limited to the approach phase. This produces the results shown in Table 413. For these results the lift value is calculated using event rates. Table 4-13: 744 Events in Approach Phase (3 Years of Data) Rule CODE = 21B → TO = JFK CODE = 42 → TO = JFK CODE = 03M → TO = LHR CODE = 40C → TO = LHR CODE = 27A → TO = LHR CODE = 06H → TO = SFO CODE = 49 → TO = SFO
Confidence 1.00 0.90 0.80 0.40 0.38 0.29 0.29
Support 12 9 4 6 5 27 4
Lift 8.19 7.37 5.28 2.64 2.54 2.24 2.23
All 12 of the 21B events (excessive bank angle 100ft to 500ft) occurred at JFK. Furthermore 90% (9) of event code 42 events (low on approach) also occurred at JFK. Both events are highlighting issues with the Canarsie approach, shown in Figure 4-6. The abnormality of this approach is also clearly illustrated in the results of the measurement data analysis presented in Section 4.2.2.2. The Carnarsie approach is designed to avoid overflying residential areas close to JFK and mitigate the effect of aircraft noise in these areas. It requires a sharp right turn late in the approach. The low on approach events are possibly caused by the requirement to obtain visual reference.
30
Application of Smiths Aerospace Data Mining Algorithms to British Airways FDM Data
Figure 4-6: Canarsie Approach
Table 4-11 also highlights the high rate of occurrence of 06H events (high energy at 8nm) at SFO (San Francisco) and MIA (Miami). This is not unexpected as ATC keep aircraft high on the approach and both airports are known for rushed approaches. 4.1.4.4 744 – Take-Off Tables 4-14 and 4-15 present Association Rules outputs for events occurring on the 744 fleet in the take-off phase. Table 4-14: 744 Take-Off Events, Lift Calculation Based on Number of Sectors Flown Flight Phase = T,C CODE = 23A → FROM = MAA CODE = 49 → FROM = PHL CODE = 10D → FROM = NRT CODE = 10D → FROM = NBO CODE = 08D → FROM = SFO CODE = 10D → FROM = JNB CODE = 08D → FROM = JFK CODE = 49 → FROM = JFK
Confidence 0.50 0.22 0.26 0.13 0.14 0.13 0.18 0.17
31
Support 6 5 8 4 7 4 9 4
Lift 137.88 19.49 10.87 7.57 6.72 5.24 2.54 2.41
Application of Smiths Aerospace Data Mining Algorithms to British Airways FDM Data
Table 4-15: 744 Take-Off Events, Lift Calculation Based on Number of Events Flight Phase = T,C CODE = 23A → FROM = MAA CODE = 10D → FROM = NBO CODE = 49 → FROM = PHL CODE = 10D → FROM = NRT CODE = 08D → FROM = JFK CODE = 08D → FROM = SFO CODE = 49 → FROM = JFK CODE = 10D → FROM = JNB CODE = 46A → FROM = LHR
Confidence 0.50 0.13 0.22 0.26 0.18 0.14 0.17 0.13 0.64
Support 6 4 5 8 9 7 4 4 9
Lift 17.21 6.22 5.24 3.89 2.46 2.46 2.33 2.22 2.09
At the top of Tables 4-14 and 4-15 is the occurrence of 23A events (high normal acceleration on ground) at MAA (Madras), which is due to the condition of the runway. It is noted that all the significant associations for event 49 (TCAS resolution advisory) are with airports in the USA. These are PHL (Philadelphia), SFO and JFK for the 744 fleet, and EWR for the 777 fleet. Again, this is related to the busy airspace.
4.2 4.2.1
Flight Data Measurements Date-Related Trends As discussed in Section 4.1.1, data mining can detect date related trends caused by changes in the analysis and routes flown. Two examples are described below. A histogram of the MAXRODB2000 measurement (maximum rate of descent below 2000ft) on the 744 fleet is shown in Figure 4-7. It can be seen that the parameter has a double distribution.
32
Application of Smiths Aerospace Data Mining Algorithms to British Airways FDM Data
744 MXRODB2000 3000
2500
2000
1500
1000
500
33
30
98
Figure 4-7: Histogram of Max Rate Of Descent Below 2000ft on 744 Fleet
30
67
28
35
27
03
26
71
25
40
23
08
22
76
21
44
19
13
18
81
17
49
15
17
14
86
13
11
0
9
7
5
3
2
2 54 10
92
79
65
52
39
26
13
0
0
Application of Smiths Aerospace Data Mining Algorithms to British Airways FDM Data
Figure 4-8 presents a simple cluster model for this measurement, with cluster 1 representing the major data distribution and cluster 2 the minor distribution. Cluster 2 is strongly associated with the year 2004 (with a high lift of 4.5), but not with the previous years, indicating a date related change. The reason for the change is that the measurement was originally being incorrectly calculated, and the problem had been identified and corrected.
Figure 4-8: Simple Cluster Model of Max Rate Of Descent Below 2000ft on 744 Fleet
A second example relates to a Cluster model produced for the two climbout measurements of MNCLS35400 (minimum climb speed 35ft to 400 ft) and MIN4001500 (minimum climb speed 400ft to 1500 ft). Model outputs are shown in Figure 4-9. Cluster 9 contains the highest values of both measurements, and information on this cluster is shown on the lower left of the figure. The location information shows that two locations with very strong associations with cluster 9 are DOH (Doha) and BAH (Bahrain), with lifts of 72 and 11 respectively. The date information shows a strong increase in membership of this cluster in 2003 and 2004.
34
Application of Smiths Aerospace Data Mining Algorithms to British Airways FDM Data
Figure 4-9: Cluster Model of Climb Out Speed Measurements on 744 Fleet
A Naive Bayes model was produced to provide statistical information about the different airport locations. In Figure 4-10 the location of DOH has been selected and the date related information shows that the 744 began operating there in mid 2003 (the same was true for BAH). Therefore the date related trend associated with high climbout speeds (captured by cluster 9) was due to the start of operations on a new route. The explanation for the high climb out speeds at DOH and BAH is that aircraft shuttle between these two locations, and therefore a considerable number of the take-offs are made at low gross weights.
35
Application of Smiths Aerospace Data Mining Algorithms to British Airways FDM Data
Figure 4-10: Naive Bayes Model Showing Airport Locations
4.2.2
Trends with Airport Locations
4.2.2.1 777 – Landing A Cluster model was produced for 777 approach energy measurements of VEGS500 (energy minus Vref at 500ft) and VEGS1000 (energy minus Vref at 1000ft) (Figure 411). There is a relatively strong correlation between the two measurements, and cluster 8 captures the highest values of both measurements. The location information on the lower left of Figure 4-11 shows that this cluster has a strong association with SAN (San Diego), with a lift value of 9.9. A total of 187 of the 315 flights into SAN are associated with this cluster.
36
Application of Smiths Aerospace Data Mining Algorithms to British Airways FDM Data
Figure 4-11: Cluster Model of Approach Energy Measurements on 777 Fleet
37
Application of Smiths Aerospace Data Mining Algorithms to British Airways FDM Data
The left hand heat map in Figure 4-12 shows where the majority of the data is located and the right hand heat map shows the regions in which energy measurements would be assigned to cluster 8. This confirms the issue of rushed approaches into SAN.
Figure 4-12: Heat Maps for all Data (left) and for Cluster 8 Only (Right)
Additional Cluster and Decision Tree models were produced to include another approach energy measurement, ENGY8NM (energy minus Vref at 8 nm). The Decision Tree presented in Figure 4-13 shows that there is a strong association between very low energies at 8nm and flights to BGI (Barbados). BGI has the largest percentage of cases associated with the top most node of the tree, representing the lowest energy values (below –126), with a very high lift value of 21.7. The Cluster model also highlighted a group of low energy values associated with BGI.
38
Application of Smiths Aerospace Data Mining Algorithms to British Airways FDM Data
Figure 4-13: Decision Tree Model of Energy at 8 nm on 777 Fleet
39
Application of Smiths Aerospace Data Mining Algorithms to British Airways FDM Data
A histogram of the ENGY8NM measurement is shown in Figure 4-14. It can be seen that the distribution has an extended lower tail, with a small secondary peak at extremely low values of below –100. The data mining has shown that these are strongly associated with BGI. 777 ENGY8NM 800 700 600 500 400 300 200 100
Figure 4-14: Histogram of Energy at 8 nm on 777 Fleet
40
146.9
134.6
122.2
109.9
97.5
85.2
72.9
60.5
48.2
35.8
23.5
11.1
-1.2
-13.6
-25.9
-38.2
-50.6
-62.9
-75.3
-87.6
-100.0
-112.3
-124.7
-137.0
0
Application of Smiths Aerospace Data Mining Algorithms to British Airways FDM Data
There is an event (6H) to detect high energies at 8nm, but BA would normally not pay attention to the extended tail of low energy values, assuming that some of the values may be caused by bad data. Prompted by the data mining results, BA used their existing FDM database to compare histograms of energy at 8nm for approaches to BGI, and for approaches to all other airports excluding BGI. The result is presented in Figure 4-15. As there are few ATC constraints on approach to BGI with very low air traffic activity there is a tendency for pilots to fly lower on the approach along the coastline.
Figure 4-15: Histograms of Energy at 8 nm at BGI and All Other Airports
41
Application of Smiths Aerospace Data Mining Algorithms to British Airways FDM Data
4.2.2.2 744 – Landing A Cluster model for the 744 approach energy measurements of VEGS500 (energy minus Vref at 500ft) and VEGS1000 (energy minus Vref at 1000ft) is shown in Figure 4-16. Cluster 10 captures the lowest values of both measurements and also has the largest variance. The cluster is dominated by JFK, with a lift of 11.6, and contains a relatively small proportion (86 out of 2929) of all the flights into JFK.
Figure 4-16: Cluster Model of Approach Energy Measurements on 777 Fleet
42
Application of Smiths Aerospace Data Mining Algorithms to British Airways FDM Data
The left hand heat map in Figure 4-17 shows where the majority of the energy data is located. The right hand heat map shows the regions in which energy measurements would be assigned to cluster 10, and illustrates the high variance of this cluster.
Figure 4-17: Heat Maps for All Data (Left) and for Cluster 10 Only (Right)
43
Application of Smiths Aerospace Data Mining Algorithms to British Airways FDM Data
A Decision Tree model was produced for four approach energy related measurements, ENGY8NM (energy minus Vref at 8 nm), VEGS1000 (energy minus Vref at 1000ft), VEGS500 (energy minus Vref at 500ft), and CAS90SEC (airspeed at 90 seconds before touchdown). This again illustrates the low energy approaches at JFK, with the selected leaf node with low ENGY8NM and VEGS1000 values in Figure 4-18 being dominated by JFK, with 265 cases and a lift of 12.2.
Figure 4-18: Decision Tree Model for Four Approach Energy Measurements on 744 Fleet
44
Application of Smiths Aerospace Data Mining Algorithms to British Airways FDM Data
The abnormality of approaches to JFK was further highlighted by an analysis of maximum bank angles at low levels on the approach. Figure 4-19 presents a Decision Tree for the measurement MXBK100500 (maximum bank angle between 100ft and 500ft). JFK dominates the lowest node displayed, for bank angles of greater than 18.8 deg, with 174 cases and a lift of 12.2. From the histogram of the measurement presented in Figure 4-20, it can clearly be seen that these values are on the extreme upper tail of the distribution. The event analysis described in Section 4.1.4.3 identified that all 21B events (excessive bank angle 100ft to 500ft) occurred at JFK due to the Carnarsie approach. The findings from the measurement data provide further evidence to support the findings of the event analysis.
Figure 4-19: Decision Tree Model for Bank Angle Between 100ft and 500ft on 744 Fleet
45
Application of Smiths Aerospace Data Mining Algorithms to British Airways FDM Data
744 MXBK100500 4500 4000 3500 3000 2500 2000 1500 1000 500
30
28
25
23
20
18
15
13
8 10
5
3
0
-2
-5
2
5
7
0
2
5
0 -7
-1
-1
-1
-1
-2
-2
-2
-2
7
0
Figure 4-20: Histogram of Maximum Bank Angle Between 100 and 500ft on 744 Fleet
46
Application of Smiths Aerospace Data Mining Algorithms to British Airways FDM Data
A Cluster model (Figure 4-21) was also produced for the measurements MXBK100500 (maximum bank angle between 100ft and 500ft) and MXBKBL100 (maximum bank angle below 100ft). The measurement data has be overlaid on the cluster plot, the grey points show all landing locations and the red show landings at JFK. This airport dominated both clusters 9 and 10.
Figure 4-21: Cluster Model of Bank Angle Measurements on 744 Fleet
47
Application of Smiths Aerospace Data Mining Algorithms to British Airways FDM Data
The left hand heat map in Figure 4-22 shows that the majority of the measurement data is located in a region of low bank angles. The right hand heat map shows the regions in which bank angles would be assigned to cluster 10. It can be seen that cluster 10 is capturing occurrences of both high bank angle between 100ft and 500ft, and high bank angle below 100ft. Interestingly, the FDE database contained no occurrences of event 21B (excessive bank below 100ft). Therefore in this case the measurement data is providing more information on bank angles at this very low level, and there may be case for lowering the current event limit.
Figure 4-22: Heat Maps for All Data (Left) and for Cluster 10 Only (Right)
To confirm that the high bank angles were associated with the Canarsie approach a second cluster model was produced, including runway information in the data set. Using the original data set, cluster 10 contained 106 approaches into JFK, with a lift of 7.4. When runway heading was included, cluster 10 contained 100 approaches landing on runway 13 (the Canarsie approach), with the lift increasing to 36.2. Therefore of the 106 approaches to JFK with high bank angles at low levels, 100 involved landings on runway 13. This runway also dominated the approaches to JFK contained in cluster 9, as illustrated by Figure 4-23. Clusters 9 and 10 account for 98% of all flights that used runway 13 at JFK.
48
Application of Smiths Aerospace Data Mining Algorithms to British Airways FDM Data
C lu s te r 9 - d is tr ib u tio n o f flig h ts b y r u n w ay fo r JFK
Clu s te r 10 - d is tr ib u tio n o f flig h ts b y r u n w ay fo r JFK
450
300 250
No. Flights
No. Flights
400 350
200 150 100 50 0 04
13
22
100 90 80 70 60 50 40 30 20 10 0 04
31
13
22
31
Ru n w ay
Ru n w ay
Figure 4-23: Histograms for Approaches Landing on Different Runways at JFK Contained in Cluster 9 (Left) and Cluster 10 (Right)
A Cluster model was produced to analyse flap speeds on the approach (flap A, B, D and E). Figure 4-24 shows the airports associated with cluster 17, and also the region of high flap A and B speeds included in this cluster. The results indicate that a higher than expected number of approaches into LAX (Los Angeles) have associated high flap speeds, with a lift of 5.4. ATC procedures at LAX often require a long straight-in final approach at high speed with continuous descent, and sometimes cause early flap selection.
Figure 4-24: Cluster Model of Flap Speeds on Approach
49
Application of Smiths Aerospace Data Mining Algorithms to British Airways FDM Data
4.2.2.3 744 – Take-Off Section 4.2.1 on date related trends has already discussed the association of high climb out speeds with the locations of DOH (Doha) and BAH (Bahrain), due to the high percentage of take-offs at low gross weights. An analysis of take-off pitch attitudes identified the effect of altitude on aircraft take-off performance. Figure 4-25 shows cluster distributions for the measurements MXTOFPCHAT (maximum pitch attitude during take-off) and TOFFALT (take-off altitude). Cluster 5 captures a relatively tight grouping of take-offs with low maximum pitch attitudes and a high airport altitude. 99% of the cases assigned to this cluster are for the high altitude airports of JNB (Johannesburg) and NBO (Nairobi), with very high lifts of 23.8 and 23.9 respectively. The analysis is identifying normal aircraft performance variation, with a reduction in performance at high altitudes.
Figure 4-25: Cluster Model of Pitch Attitude on Take-Off and Airport Altitude
50
Application of Smiths Aerospace Data Mining Algorithms to British Airways FDM Data
5 Assessment of Results by British Airways The analysis conducted during this proof-of-concept project delivered useful and intriguing results. The data mining tool highlighted many items of which British Airways was already aware from using its existing analysis techniques. This is not a criticism, but is hard evidence that the tool is correctly identifying relationships of interest. In turn this gives confidence that other relationships detected are worth investigating. Of course if previous analysis had not been carried out on the data then these items would be perceived to have a greater safety value. In addition British Airways is not aware of any known issues that should have been identified by the tool and were not. The data mining tool unearthed many interesting patterns and relationships at what could be called a “second level” down. These had not previously been detected using existing analysis techniques and, if they had, it is likely that they would have been dismissed as noise or random groupings. The software provided quantitative information showing the degree of confidence that there was something non-random occurring. The tool was adept at detecting date related changes. This would prove useful for monitoring the British Airways operation for unintended consequences as a result of changes to operational procedures. It would also prove useful for monitoring changes to the existing Flight Data Analysis software. The tool was effective in analysing the FDM database for patterns where the maximum parameter level recorded did not exceed the pre-determined event level (e.g. maximum bank angle below 100ft). It could also be used on the FDM database to aggregate data and provide a ranking of airports from best to worst. The data mining tool would be useful for providing routine monthly management reports using specially created models running on the FDM and FDE databases. It could probably replace some of the existing analysis process with a more efficient method, thereby freeing up scarce expertise to focus on the results rather than the process. It can therefore be used to complement and improve existing processes. The tool would enable more in-depth investigation into individual pilot handling events. It would more easily identify if any pilots have recurring handling characteristics outside the fleet norm.
51
Application of Smiths Aerospace Data Mining Algorithms to British Airways FDM Data
5.1
Observations on Data Mining Tool and Suggestions for Improvement The tool seemed easy to use once familiarity was gained with the various analysis configuration settings and outputs. A new model run took about ten minutes to set up and about twenty minutes to analyse the results for interesting patterns or relationships. A repeat of the same model on different data reduced these numbers to two and fifteen minutes respectively. Changes to the user interface for the input selections and the output displays could be made which would reduce the set up and analysis times. For example more information with regard to location analysis, giving percentage of total database sectors and runway heading would aid results analysis. None of these changes are particularly difficult to make. The mining models generally took less than a minute to run on a state of the art PC. As suggested in previous sections of the report, analyses looking for negative as well as positive associations would prove valuable. Because of the need to preserve confidentiality of the event and measurement data going outside British Airways, the date information was shortened to month and year only, removing the ability to connect records between the FDE and FDM databases. This ability should be restored for any internal analysis within BA. Crew identifiers would be a useful adjunct to the FDM documentary data fields and analysis capabilities would be increased if these are added to the FDM data set.
5.2
Assessment of the Tool’s Value to Flight Safety Analysis The tool provided an ability to unearth “second level” items of interest in the FDE database that had previously not been detected. It also provided new insights into the FDM data that complemented the information derived from FDE. By running preset mining models on a regular basis the data mining tool should generate useful management information and provide an overall monitor of the British Airways operation to detect any undesirable changes. If used for the routine analysis of the FDE database the tool could replace some of the existing manual analysis processes with a more efficient method. However, in general, the data mining tool would be used to complement rather than replace the existing event and measurement data analysis.
52
Application of Smiths Aerospace Data Mining Algorithms to British Airways FDM Data
6 Conclusions This Federal Aviation Administration sponsored data mining proof-of-concept demonstration has been a very interesting and worthwhile project. The results obtained have clearly demonstrated the benefits of utilising data mining tools within an airline Flight Data Monitoring (FDM) program. Data mining algorithms have been applied to databases containing three years of flight data events and two years of measurements from British Airways’ FDM program on its Boeing 777-200 and 747-400 fleets. Although some patterns detected were due to changes in the flight data analysis, the quality of the databases was good and enabled valid and meaningful results to be obtained. Mining of the event data identified date-related trends, associations between different events, and significant associations between events and take-off and landing locations, crew codes, aircraft registrations and the raising of Air Safety Reports. Mining of the measurements also identified date-related trends, and significant associations between groups of measurements and take-off and landing locations. The measurement analysis provided additional information to support the findings of the event analysis, and in some cases identified associations not present in the event data. As was expected, the most obvious findings from the data mining related to issues that were already known to British Airways, which operates a very mature and comprehensive FDM program. These “primary” findings served to validate the tool and provide confidence in its results. However, the data mining tool also unearthed many interesting patterns and associations at what could be called a “second level” down which had not previously been detected using existing analysis techniques. Some of these were in the extreme tails of measurement data distributions, which previously may have been dismissed as noise or random groupings. It is concluded that data mining can provide new insights into patterns and associations within databases of flight data events and measurements. Running preset mining models on these databases on a regular basis would provide airlines with useful additional safety management information. It should also improve the efficiency of the flight data analysis process. Both Smiths Aerospace and British Airways believe that the proof-of-concept study demonstrates that data mining has a very useful role to play in Flight Data Monitoring, and will be a valuable complement to existing analysis tools. There is clear potential for data mining tools to become an integral part of the suite of tools used in an airline FDM program.
53
Application of Smiths Aerospace Data Mining Algorithms to British Airways FDM Data
7 Recommendations – possible next steps This project was a short duration proof of concept demonstration of the application of data mining techniques to airline flight data. There is clearly a need for future work to build on the experience gained from the exercise in order to produce an operational data mining capability. Developing such a capability would require the following steps: 1
Perform a more comprehensive data analysis to optimise the mining process (including selection of input data and algorithms) to provide the most useful outputs for the airline. There is a need to optimise: (i) The selection of complementary FDE and FDM parameters to provide the best overall picture of potential operational risks; and (ii), the application of complementary data mining algorithms to provide the clearest picture of anomalous trends.
2
Develop a standard set of data mining models, which could then be run routinely by the airline with minimal effort. Developing a standard set of mining models is important as this will minimise analysis workload, and also facilitate trend monitoring by enabling comparison of consistent model outputs at different periods of time.
3
Configure the data mining tool to interface to the databases of events and measurements, automatically run a set of analyses, and present results in the most meaningful format to the airline. This step is one of tailoring the data mining tool to the specific requirement of airline Flight Data Monitoring programs. Smiths’ adoption of an open standard data mining framework linked to third party tools is designed to facilitate this approach, enabling the production of a tool well matched to airline requirements. Alternatively some airlines may wish to obtain new analysis capabilities though the use of a data mining service, and Smiths can also support this approach.
In parallel with the direct development of a data mining capability described above, there is a need for airlines to determine how to obtain the maximum benefits from data mining by: 1
Optimising the information provided by their current Flight Data Monitoring programs. For example, the proof of concept demonstration identified that additional benefits would be obtained if BA’s FDE and FDM records could be directly linked, and if additional documentary information such as pilot codes could be added to the FDM data.
2
Determining how best to disseminate the new types of information provided by data mining both internally and externally, and how to best utilise this information in the closed loop process of identifying, assessing and addressing operational risks.
54
Application of Smiths Aerospace Data Mining Algorithms to British Airways FDM Data
8 References [1]
Statement of Work. Work Order 2 DTFAAC-03-T16107 Proof-of-Concept Demonstration: Application of Data Mining Algorithms to Airline Digital Flight Data.
[2]
BASIS Descriptors. Background to the BASIS Descriptor Classification System: Version 1.2 22nd January 2003
55
Application of Smiths Aerospace Data Mining Algorithms to British Airways FDM Data
APPENDIX A
Table A1 presents a list of the Flight Data Events implemented on BA’s 777 and 744 fleets, and the Flight Data Measurements that are related to these events. Table A2 presents a list of additional Flight Data Measurements that do not have an associated event. Table A1: BA 777 & 744 Events and Associated Measurements Event Code 01A 02A 03A
VMO Exceedance MMO Exceedance Flap Placard Speed Exceedance
03G 03I 03J 03M 4 5 06A 06B 06C 06H 06J 06K
Gear Down Speed Exceedance Gear Up Selected Speed Exceedance Gear Down Selected Speed Exceedance Airspeed low for configuration Exceedance of Flap/Slat Altitude Exceedance of Max Operating Altitude Approach Speed High Within 90 secs of T/D Approach Speed High Below 500ft AAL Approach Speed High Below 50ft AGL High energy at 8nm High Energy (knots equivalent) at 1000' AAL High Energy (knots equivalent) at 500' AAL
Description
Measurement MXVMO MXMMO MXFLPALND MXFLPBLND MXFLPCLND MXFLPDLND MXFLPELND MXFLPFLND MXFLPATO MXFLPBTO MXFLPCTO MXFLPDTO MXFLPETO nil nil CASGRSELD nil nil nil CAS90SEC CASATH500 CASATR30 MXENGY8NM VEGS1000 VEGS500
A-1
Description MAX VMO MAX MMO CAS MINUS FLAP SPEED (FLAP 1) LANDING CAS MINUS FLAP SPEED (FLAP 5) LANDING CAS MINUS FLAP SPEED (FLAP 15) LANDING CAS MINUS FLAP SPEED (FLAP 20) LANDING CAS MINUS FLAP SPEED (FLAP 25) LANDING CAS MINUS FLAP SPEED (FLAP 30) LANDING CAS MINUS FLAP SPEED (FLAP 1) T/O CAS MINUS FLAP SPEED (FLAP 5) T/O CAS MINUS FLAP SPEED (FLAP 15) T/O CAS MINUS FLAP SPEED (FLAP 20) T/O CAS MINUS FLAP SPEED (FLAP 25) T/O
CAS AT GEAR SELECTED DOWN
CAS AT 90SECS BEFORE T/D CAS MINUS VREF AT 500FT CAS MINUS VREF AT 30FT ENERGY AT 8NM VREF ENERGY MINUS VREF AT 1000FT ENERGY MINUS VREF AT 500FT
Application of Smiths Aerospace Data Mining Algorithms to British Airways FDM Data Event Code 07A 07B
Approach Speed Low Within 2 mins of T/D Approach Speed Low Below 25ft Radio
08A 08B 08C 08D 09A 09B 10A 10B 10C 10D 11A 19A 19B 20A 20B
Climb Out Speed High Below 400ft AAL Climb Out Speed High 400' to 1000' AAL Climb Out Speed Low 35' AGL to 400' AAL Climb Out Speed Low 400' to 1500' AAL Inst Pitch Rate High on Take-Off Average Pitch Rate High Unstick Speed High Unstick Speed Low Tyre Limit Speed High at Take-Off Slow acceleration on take-off Elev During T/O run Long Flare Short Flare Pitch Attitude High During Take-Off Abnormal Pitch Landing (High)
20C 20G 21A 21B 21C 21D 22C 22D 22E 22F 22G 22H 23A 23B 23C 23D 24 24A
Abnormal Pitch Landing (Low) Excessive Pitch Attitude Excessive Bank below 100ft AGL Excessive Bank 100' AGL to 500' AAL Excessive Bank above 500ft AAL Excessive Bank near Ground (Below 20ft AGL) Slow climb to 2500ft AAL after T/O Initial Climb Hght Loss 20' AGL to 400' AAL Initial Climb Hght Loss 400' to 1500' AAL Excessive Time to 1000ft AGL After Take-Off High Rate of Descent Below 2000 ft AGL Altitude deviation High Normal Acceleration on Ground High Normal Acceleration in Flight High Normal Acceleration at Landing Firm nose wheel touchdown Go-Around from below 1000ft. Go-Around from above 1000ft
Description
Measurement nil CASTDOWN CASATR30 MNCLS3540 MIN400150 MNCLS3540 MIN400150 TOFFPRM TOFFPRA TOFFSPEED TOFFSPEED nil TOACC nil TIME25TD TIME25TD MXTOFPCHA MXPTCHLAN LDGINSTPITCH nil nil MXBKBL100 MXBK10050 MXBKABV50 MXBKNRGRN nil nil nil TIMTO1000 MXRODB2000 nil MXNMLGRND MXNMLAIR MXNMLALAN nil nil nil
A-2
Description CAS AT TOUCHDOWN CAS MINUS VREF AT 30FT MIN CLIMB SPEED 35FT TO 400FT MIN CLIMB SPEED 400FT TO 1500FT MIN CLIMB SPEED 35FT TO 400FT MIN CLIMB SPEED 400FT TO 1500FT INSTANTANEOUS PITCH RATE AT T/O AVERAGE PITCH RATE AT T/O CAS MINUS V2 CAS MINUS V2 SECONDS FROM 80KTS TO 120KTS T/O TIME 25 FT TO T/D TIME 25 FT TO T/D MAX PITCH DURING T/O MAX PITCH DURING LANDING MAX INST PITCH DURING LANDING
MAX BANK ANGLE BELOW 100FT MAX BANK ANGLE 100FT TO 500FT MAX BANK ANGLE ABOVE 500FT MAX BANK ANGLE BELOW 25FT
TIME TO 1000FT MAX ROD BELOW 2000FT MAX NMLA ON GROUND MAX NMLA AIR MAX NMLA LANDING
Application of Smiths Aerospace Data Mining Algorithms to British Airways FDM Data Event Code 24C 26 27A 27B 40C 41 42 42B 43 44A 44B 44C 44D 45A 46A 46B 47 48A 48B 48D 49 50A 50C 51A 56A 56B 56C 58B 75A
Description Inadvertent TOGA activation Abandoned Take-Off Rudder deflection above 1000ft AAL Rudder reversal below 1000ft AAL Abnormal Configuration. Speedbrake with flap Taxi without take-off flap set Low on Approach (Between 3 & 2 mins of T/D) Too high at 1 minute to touchdown Spdbrakes out below 1000' AAL GPWS Hard Warning GPWS Soft Warning GPWS False Warning GPWS Windshear Warning Reduced Lift Margin Stick Shake False Stick Shake Early Configuration Change After T/O (Flap) Late Land Flap (Not in posn below 500 ft AAL) Reduced Flap Landing Flap Load Relief System Operation TCAS Resolution Advisory Deep Landing Short Landing Gear Not Locked-Down at 1000FT AAL Deviation Under Glideslope (below 600ft AAL) Deviation Above Glideslope (below 600ft AAL) Deviation from Localiser Below 600ft Excess Tailwind on Landing Low power on approach below 500ft
Measurement nil nil MXRUDA1000 nil nil nil nil HAAL60TD MNHSBG43A nil nil nil nil nil nil CONFIGHT HALLSTFPCH nil nil nil XTD XTD HAALGRDN NEGGSDEV POSGSDEV nil MXTAILWIND MINN1
A-3
Description
MAX RUDDER ABOVE 1000FT
HEIGHT AT 60 SECS TO T/D MINIMUM HT SPEEDBRAKE USED ON APPROACH
HEIGHT OF FIRST FLAP SELECTION AFTER T/O HEIGHT AT LAST CHANGE IN FLAP
LANDING DISTANCE PAST G/S AERIAL LANDING DISTANCE PAST G/S AERIAL HEIGHT AT GEAR DOWN MAX NEG GS DEVIATION BETWEEN 600FT AND 150FT MAX POS GS DEVIATION BETWEEN 600FT AND 150FT MAX TAIL WIND MINIMUM N1 500FT TO 50FT
Application of Smiths Aerospace Data Mining Algorithms to British Airways FDM Data Table A2: Additional Measurements Measurement SERIALNO REPLAYDATE ACREG ACTYPE DEPDATE REG DEPAP LNDAP DEPAPTYPE LNDAPTYPE GMTTO GMTLND FLLENGTH VARIANT FLNO TOFFAUW TOFFRUNWA TOFFALT TOFFTEMP TOFFVR TOFFV2 CASATH1000 LANDAUW LANDRUNWA LANDALT LANDVREF TIME200KT FUELTD TIME100TD FUELD100TD TODIST TIMEFFLTD LNDRES TOINSTPITCH TAXITIME TAXIFUEL MXROTPOS
Description SERIALNO REPLAY DATE A/C REGISTRATION A/C TYPE DEP DATE REGISTRATION DEP AIRPORT LND AIRPORT DEP AIRPORT TYPE LND AIRPORT TYPE GMT T/O GMT T/D FLT DURATION A/C VARIANT FLT NUMBER T/O WEIGHT T/O RUNWAY T/O ALTITUDE T/O TEMP T/O VR T/O V2 CAS MINUS VREF AT 1000FT LANDING WEIGHT LANDING RUNWAY LANDING ALT LANDING VREF TIME FROM 200KTS TO T/D TOTAL FUEL ON LANDING TIME FROM 100NM TO T/D FUEL USED FROM 100NM TO T/D T/O DISTANCE FROM START OF ROLL TO UNSTICK TTIME SINCE FLAPS CLEAN TO T/D LANDING WEIGHT * 1000 INSTANTANEOUS PITCH AT T/O TAXI TIME TAXI FUEL ROTATION SPEED REL TO V2
A-4
Application of Smiths Aerospace Data Mining Algorithms to British Airways FDM Data
THIS PAGE IS INTENTIONALLY LEFT BLANK
A-5