Application of Clustering Methods for Online Tool. Condition Monitoring and Fault Diagnosis in High. Speed Milling Processes. Amin J. Torabi1â, Meng Joo Er1 ...
1
Application of Clustering Methods for Online Tool Condition Monitoring and Fault Diagnosis in High Speed Milling Processes Amin J. Torabi1∗ , Meng Joo Er1 ,Senior Member, IEEE, Xiang Li2 , Beng Siong Lim2 , Gan Oon Peen2 ,
Abstract—Tool Condition monitoring (TCM) is a necessary action in high speed milling (HSM) process. As worn milling tool might irreversibly damage the workpiece, there is a vital demand for a TCM system to evaluate the tool wear progress, or equivalently resultant surface roughness, non-intrusively. To build up the condition monitoring system for HSM processes, sensor signals are to be utilized to form a reference model which reflects the performance of the system. Therefore, a desired reference model have to apply more efficient feature extraction and artificial intelligence (AI) techniques to be more repeatable and generalizable. This paper illustrates the performance of clustering techniques on high speed end milling experimental data. Studied clustering methods are applied to wavelet features of force and vibration signals to illustrate the repeatability of their results. It is shown that clustering methods can coarsely capture the status of the process and can be applied for fault diagnosis and TCM purposes. It is also discussed that how the application of clustering methods may improve the performance of existing reference models towards more efficient utilization of available experimental data and to develop easily generalizable reference models. Lastly, a possible application of clustering results is discussed comparing to state of the art papers.
I. I NTRODUCTION Today, high speed machining (HSM) is widely applied to fulfill the overwhelming and increasing demands for producing vital pieces for various industrial sectors, specially in aerospace industries. The throughput of the machining process is a critical parameter for determining the quality of a production process. Large throughput as well as the surface quality of the product is directly related to the change in the total production rate and the overall gain. Early research in this area started in the late ∗
Corresponding Author Nanyang Technological University, School of Electrical and Electronics Engineering, Singapore {Amin0005, Emjer}@ntu.edu.sg 2 Singapore Institute of Manufacturing Technology, Singapore {Xli, Bslim, Opgan}@SIMTech.A-star.edu.sg 1
70s and early 80s [1]. Afterwards, many methods were suggested for the production monitoring to beef up the quality of the process. Deliverables of these works were often demonstrated in the form of mathematical models or presented in the form of artificial intelligence based models, [2, 3]. A common goal was to accomplish better surface quality and extended tool life. This knowledge engine eases the extraction of the inherent relationship between all the effective parameters, sensor signals, and process results employing the most descriptive models for the studied case and its objectives [4, 5]. Accuracy, consistency and repeatability of these models requires that the structure of the reference model is chosen to have more robustness toward the replacement of the tool. Early models were mostly dependent on the geometry of the tool and workpiece as well as cutting conditions as the key parameters on the milling process, while state-of-the-art models employ many more parameters such as cutting length and/or cutting signals, tool and workpiece design and materials, to make such models preciser [7, 8]. Any replacement or change in the tool must be always followed by suitable modifications in the condition monitoring systems. Therefore, it will be an improvement for the existing proposed reference models if it requires least changes in such cases. Therefore, interpretation layer between sensors and AI modes has to be robust enough so that these variations in the system hardly affect the overall repeatability and consistency of the model. Hence, in our proposed model robustness of this layer to the tool replacement will protect the model from remarkable changes in the structure. Knowing the complexity of the milling signals, time and frequency features are used in many investigations [3, 9, 10]. In some studies, these features are incorporated with some other parameters from cutting conditions to make the model comprehend the tool wear and changes in the quality of the surface while the process is running.
2
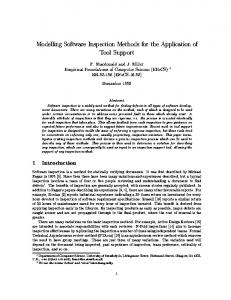
Fig. 1.
Tool condition monitoring and resultant surface roughness prediction [6].
Time-frequency transformations such as continuous and discrete wavelet transform were also applied as feature extraction for milling signals [3]. It is reported that the distribution of energy patterns in wavelet scales of cutting signals are changing according to gradual change in tool condition, [3, 10, 11, 12, 13]. Usually time-frequency features consist of high-dimensional vectors of data which can complicate the computations. Hence, the dimension reduction seems to be vital for simplification of the implementations. The overall tool condition monitoring system (TCM) is depicted in Fig.1. In the present work, a clustering based interpretation layer is proposed after application of several clustering methodologies on wavelet energy features of milling signals. In this structure, two main characteristics are underlined for a more effective reference model. First, the features have to be normalized, ranging from zero to one employing clustering techniques. The standardized outputs are then to be used later by an AI modeling layer. It requires to show the consistency and repeatability of clustering results. Second characteristic is the repeatability of the results of same type milling tools. These two conditions must be verified to show that time-frequency signal features are stable and repeatable features for proper TCM models. In this study it is shown that among the available clustering methods, fuzzy Cmeans clustering will result in better normalized outputs and is more suitable to be applied in further studies. II. E XPERIMENT S ETUP Our destructive test experiments are performed on a 3-Axis Roders Tech RFM760 HSM center. Many 2-flute and 3-flute micro-grain tungsten carbide ball-nose end mills were used to cut a surface with a slope of 60 degrees. Inconel 718 is used as the workpiece material because of its vast applications in aerospace field. It is considered as a hard-to-cut material and is a chemical composition of 53% Ni, 19% Cr, 18% Fe, 5% Nb, 3% Mo, 0.9% Ti, 0.5% Al and C balance [14]. The surface is cut line by line from the top to the bottom where the cutter cuts the lines with its flutes. In our case, each surface requires about 300 to 400 lines
of cut depending on the intended depth of cut, cutting diameter, workpiece geometries, and cutting direction. At certain preplanned instants of the milling process, it was stopped for tool-wear and surface roughness measurements.
Fig. 2.
Workpiece and the arrangement of the sensors.
For signal data acquisition, a vibration, force and acoustic sensor were attached to the workpiece and environment, Fig.2. Kistler 9257BA dynamometer with builtin 3-channel charge amplifier was applied on the workpiece as force sensor. Kistler 8762A50 ceramic shear triaxial accelerometer was also attached as vibration sensor and lastly, for capturing acoustic emission, Kistler 8152B121 sensor were attached to the environment. As the force sensors are not easy to work with in industrial environments, vibration and acoustic are more favorite options for signal processing regarding their lower price and their easy installation. Acoustic emission sensor does not even need to be mounted on the workpiece and yet is capable of reflecting the changes in the process. These sensor signals are sampled with properly high sampling rates, i.e. 96 samples for each flute cut, or equivalently 50,000 samples per second while the cutting
3
(a)
(b)
Fig. 3.
The obvious change in the sensor signals from the beginning of the cutting process to the end. (a) The 40th cut of the process. (b) The 600th cut of the same process.
speed is 10360 RPM. vc = 10360rpm sample/ sec = 50k
(1)
F lutes = 3 E{F lute cut samples} =
In [9, 10] wavelet analysis of the vibration signal and power usage time series were investigated. Using wavelet packets, power and vibration signals were decomposed into several scales. Each scale provided different features regarding to the status of the tool. Then, they were compared to a pretrained feature bank for diagnosing the state of the tool. In the present work, first, we focus on the scales of the CWT analysis of the force signal where we find a proper leading signal for the flute-cut separation (as the novel finding of our studies). Then, energy content of several scales of each cut is regarded as a blueprint of the basic variations of the process. As a result, these features can be applied as the feeds for a clustering based TCM or a fault diagnosis system.
50,000×60 10,360×3
Surface roughness measurement, Ra is the most commonly used surface quality indicator which is the arithmetic mean of the absolute ordinate values of the surface profile. III. C ONTINUOUS WAVELET A NALYSIS , F LUTE -C UT SEPARATION , E NERGY F EATURE E XTRACTION Wavelet transform of the sensor signals is becoming very common in recent years where it results into a significant meaningful analysis of the signals. It helps for a better comprehension of the processes’ nature. In some studies, it provides deeper insight on the nature of the signals rather than its old counterpart Fourier transform [10, 11, 12]. The main reason behind choosing a data analysis method is the similarity between the signal under processing and the basis of the signal processing space. In our case study, sensor signals are extremely similar to mother wavelet functions rather than sinusoidal functions. Hence, a more reasonable alternative is to decompose our signals into its building wavelet components. However, this time-frequency signal analysis method did not find its place yet in the field of ball-nose surface finishing processes. In [13], a quick investigation on the benefits of wavelets’ results was presented. Using wavelet packets, the energy content of each scale in wavelet analysis is presented to vary regarding to the changes in the state of the tool. To prove this, energy content of some scales were shown to reflect the moments that tool is new to the moment near tool-breakage. The difference between the shapes of the available signals are depicted in Fig.3.
IV. A PPLICATION OF C LUSTERING M ETHODS ON WAVELET F EATURES Continuous wavelet transform (CWT) and discrete wavelet transform (DWT) were widely applied for feature extraction. It is experimentally found out that the distribution of energy blueprints in wavelet scales of cutting signals variegates regarding to gradual changes in the condition of the tool. Therefore, the consequences of the tool deformation is reflected on each frequency band and can be discerned by a method like wavelet analysis. Fuzzy clustering on continuous and discrete wavelet analysis of servo-motor current signals of the spindle and the feeder was utilized in [15] for detection of tool breakage and monitoring of tool wear. As reported in [16], tool wear conditions could be presented using feature bank of a clustering based TCM system. Here, four states for the tool wear with seven features each, compose the codebook of the clustering method. The fuzzy clustering method was also applied in [16] on wavelet packet features of acoustic emission signals and also in previous works of the authors [17, 18] on the energy contents of different scales of CWT of the force and vibration signals. Power consumption and vertical force features were also clustered in [19] which points out its applicability. Since the RMS value of frequency bands in an acoustic emission signal varies with variations in tool conditions, it is applied as indicative of tool wear and surface roughness [20]. Classification of the features was also applied for TCM purposes. Elbestawi, et al. in [21] assumed five different classes of feature patterns of sensor signals, applying the prior knowledge based monitoring system with linear discrimination classification techniques.
4
While early modeling techniques in the field were mostly based on the geometry of the tool and cutting conditions, recent models consider cutting time and/or other experimental factors to make models more precise. It is clear that replacement of the cutting tool must always result into proper modifications in the model. Our idea is that, there must be an interpretation layer between signals part and the AI part of the reference model so that these changes do not affect the whole model. Proving it can be considered as a big step forward modifying the existing models. In our proposed structure, after each tool replacement the only necessary adjustment is the rectification in the interpretation layer. The suitable change in the interpretation layer after each replacement of the tool will protect (or minimize) the AI part from drastic changes and avoid multiple models for the milling process. To affirm our proposed idea, some well known clustering methods were applied on wavelet features of sensor signals. Among the available clustering techniques, Kmeans, K-medoids, Gath-Geva and fuzzy C-means clustering are investigated in our research [2, 3].
Fig. 4.
Proposed structure for tool wear condition monitoring using clustering layer as interpretation layer between AI and feature extraction layer. In the current paper we focus on the clustering layer.
To check the applicability of this idea we must first verify the suitability the applied crisp and fuzzy clustering methods. The results of the clustering layer must fulfill the characteristics mentioned and highlighted in the last section. We will practically point out that those two conditions will be ensured through our method and verified in the following sections. Section V presents outputs of the proposed clustering layer and discussions are made accordingly. Finally, the conclusions are summarized in Section VI.
A. Problem Description on Clustering of Wavelet features As described in Section I, there are many methods to extract signal features to be applied in estimation methods. Some of them are time-domain based as some others are frequency-domain based feature extraction methods. In the present work, we concentrated on time-frequency features, precisely wavelet features, of our signals due to their similarity to some existing mother wavelets and ever increasing demands for time-frequency analysis in literature and industry. This requires identification of the cutting states and associating them with certain timefrequency patterns in sensor signals. There are many uninvestigated and unclassified patterns to be studied by clustering and classification methods which can lead to more investigations in this field. In our method, features are energy of different scales of CWT of the signal. The details will be provided in section IV-B. Also, there are number of grouping algorithms that have not been utilized in the field of intelligent machining. In addition, combination of the these methods and artificial intelligence has not been widely investigated. Clustering algorithms can be applied to look into the resemblances among different cutters’ signal features. Finding these similarities, other artificial intelligence techniques might be utilized to map different classes to states of the tool during cutting process. But, number of classes may determine the accuracy of the method and it is an open issue to determine this number. We will focus on determining this number automatically with some dynamic structures in our future studies. The structure which is considered for the milling process should direct us to a generalizable descriptive model. This model has to be able to combine all available data of the process, either from destructive tests or best-cutting-condition determination experiments [2, 17]. Our proposed structure is depicted in Fig.4. To check its suitability, the applicability of each block of the model structure have to be verified separately before they are merged. In [17], the applicability of some AI techniques was presented. In this paper, the contribution of clustering methods and the repeatability and consistency of their results will presented. Also, a possible application of their results for fault diagnosis will be discussed and the results will be compared to studies with similar attitude. Since the proposed model must be generalizable, grouping the signal features have a considerable role. This technique makes the model more robust to variations due to tool replacement. Therefore, the results of clustering on the available experimental data of milling process will facilitate the generalization
5
of the reference model. To verify the applicability of the clustering methods, some of them are applied on the extracted milling signal features. In our study, we emphasize on wavelet features as they are proved to reflect more consistent information about the process [10, 11, 12, 22]. Also the similarity between cutting signals and existing wavelets are another reason for this time-frequency analysis. Also, as it is time-frequency based analysis, it facilitates time-based identification of any undesirable phenomena in cutting process and associate them with certain patterns in resulting signals. The details are similar to the method that is applied in [17] and were briefed in Section III. Here we try to try to cover the following vacancies in TCM literature: 1) There are numerous clustering methods that were not used in this field. 2) Merging the clustering algorithms and artificial intelligence was not widely studied in the field. The most important issue is to find the most suitable method among available clustering methods. The touchstone is to have smooth results, maintaining less complexity and at the same time possibility of generalizations for sequential online clustering. B. Methodology: Proposed Clustering-Based Reference Model Experimental set-up in section II highlights that there are three sensors to collect signals of the cutting process. To make these signals available for possible reference models, wavelet analysis of vibration and force signals were conducted in several scales to monitor the variations of signal energy distribution due to changes in tool’s status during destructive tests from fresh tool to worn. Since there are some moments during the milling process that there is no actual cut to let the cutter move to another line of cut, analysis starts with examining the presence of cutting signal. Just like in real world implementations, the cutting sound is a trustable indicator of an ongoing cutting process, in our research we use root mean square value of AE signal as a signature of valid cutting signal. If RMS of acoustic emission exceeds a pre-specified threshold, the collected signals are treated as a cutting signal. Then, CWT of force and vibration signals were calculated. Considering certain scales of wavelet analysis, we look for the peaks of the signals which represent the moments that tool-flutes hitting the surface of the material for cutting. After localization of flute signals, all of them are saved for later analysis and beginning time
of the signals are referred later for the corresponding wavelet analysis and energy calculations. According to the time of detected flute hits, all scales in wavelet analysis are separated. Energy contents of wavelet scales which are calculated like Eq.(2) create unique patterns to be associated with progress of tool wear and surface roughness. T 1 X E(f ) = f 2 (k) (2) T k=1 Consistency and repeatability of clustering methods can be presented by unsupervisedly grouping signal feature patterns by different clustering techniques such as K-means, K-medoids, fuzzy C-means and Gath-Geva algorithm. Techniques such as K-means and K-medoids are known as crisp where each datum can belong to only one cluster. Other clustering techniques like fuzzy C-means and Gath-Geva are known as fuzzy clustering where each data point belongs to all clusters to a membership degree. K-means clustering is a crisp clustering method which partitions n numbers of data into k groups where each point of data belongs to the cluster with nearest representative or center. This method iteratively optimizes an objective function as follows: argS min
Xk
X
i=1
xj ∈Si
kxj − µi k
2
(3)
where k is the number of clusters and S is the set of all clusters, i.e. S = {S1 , S2 , S3 , ..., Sk } and µi s are the means of corresponding Si . K-medoids clustering is very alike to the k-means. Both are partitional clusterings, i.e. they split the data space into groups and attempt to minimize squared error of the distance between points labeled to be in a cluster and its center. But, in k-medoids method the center of the cluster is chosen from the actual data points in the cluster which requires saving all the data. Gath-Geva on the other hand, is considered among fuzzy clustering techniques which has no preassumption on the size of clusters. Probabilistically, it assumes the clusters as summation of different Gaussian functions. The details on this method can be found in [23]. Fuzzy C-means technique was originally introduced by Jim Bezdek in 1981 as an improvement of their earlier clustering methods [24]. It shows how to group data points that populate a multidimensional space into a prespecified number of clusters [25]. Fuzzy C-means clustering algorithm is based on the iterative minimization of the objective function, called C-means functional defined in [24, 26, 27] as: J(X; U, V ) =
c X N X i=1 k=1
(µik )m kxk − vi k2A
(4)
6
1, then (U, V ) minimize Eq.(6) by iterating the following steps: 1 , 1 ≤ i ≤ c, 1 ≤ k ≤ N 2/(m−1) j=1 (DikA /DikA ) (7)
µik = Pc
and
PN
µm ik xk m k=1 µi,k
vi = Pk=1 N
(8)
The fuzzy maximum likelihood estimates (FMLE) clustering algorithm employs a distance norm based on the fuzzy maximum likelihood estimates, proposed by [26]: √ det(Fwi ) ... Dik (xk , vi ) = αi � � �T � �� (9) (l) (l) −1 1 exp 2 xk − vi Fωi xk − vi where PN
Fwi =
Fig. 5. Wavelet-based localization of the flute signals. Up: 3D presentation of the continuous wavelet transform (CWT) of the signal. Middle: One of scales to show the effects of wavelet on denoising the signal. Down: Peak detection of the original signal. It is highly reluctant to the frequency drift and additive noise in the signal.
where V = [v1 , v2 , ..., vc ], vi ∈ Rn is the set of all ndimensional centers, µs are the membership value of each data in a certain cluster and N is the number of data points. Also, D2ikA = kxk − vi k2A = (xk − vi )T A(xk − vi ) which is weighted second norm of the distance. The stationary points of Eq.(4) objective function is calculated by adjoining the following constraints to J by means of Lagrange multipliers: µij ∈ [0, 1], 1 ≤ j ≤ N, 1 ≤ k ≤ c c P
µij = 1, 1 ≤ i ≤ N
(5)
k=1
0
0, ∀i, k, m >
(xk − vi )(xk − vi )T PN ω k=1 (µik )
k=1 (µik )
ω
(10)
The algorithm, fuzzy maximum likelihood estimates clustering algorithm, is reported to be able to detect clusters of varying shapes, sizes and densities [23]. The cluster covariance matrix is applied in conjunction with an “exponential” distance, and the clusters are not constrained in volume. To show the consistency and applicability of the clustering methods in milling process, the above mentioned clustering methods applied on milling process signalfeatures. Note: At each time instance, an observation come to the clustering layer. Here, the input part of observation is measured for its distance with the cluster centers and membership value of the input part of observation to the clusters is calculated and plotted. Therefore if n clusters are supposed for the signal features, n distinct membership values will be calculated and n distinct curves will be formed. If these curves follow a meaningful trend that can be associated with the process health levels, the clustering results can be considered applicable for diagnosis and prognosis applications. The clustering results demonstrate that membership values and cluster numbers assigned to patterns at different time instances in fuzzy clustering/crisp clustering methods highly reflect the condition of the tool. Repeatability of the results is also verified for several cutters of the same type, section V. It is practically proved that clustering algorithms make an appropriate platform for TCM. Putting these results into practice facilitates a generalizable reference model that can lead to reliable non-intrusive prediction of cutter’s performance.
7
Fig.4 depicts that the clustering algorithms can be employed in the proposed structure as an interpreting layer in a general TCM reference model. As far as the applicability of this model in real-time TCM is concerned, since we have repeated patterns in different experiments, it means that clustering subsytem generates similar results with cutters of the same type. Therefore, it is applicable to condition monitoring after training the model and adjusting the clustering subsystem. In the final structure of our proposed structure, the output of the clustering method will be fed to the artificial intelligence block to be used with other cutting conditions and tool specifications. We hope that this combination along with the results from different experiments on the milling tools such as Best Cutting Condition Determination Test (BCCDT), etc might lead to a more flexible and generalizable modeling structure for HSM processes. This requires an independent study and will be covered in our future reports. Being motivated by the above, clustering results show that variations in membership values of patterns at different times are highly due to variations in the status of the cutter. It is also confirmed for several cutters to show that the patterns are repetitive. It is also shown that fuzzy C-means clustering can provide an appropriate pathway to TCM for cutters with similar geometry. It leads to a general reference model for tool performance prediction non-intrusively.
Many proposed methods just use these features as the inputs of artificial intelligence. Contrarily, our suggestion is to apply a clustering layer to interpret the input patterns and to identify the current state of the process. To affirm this idea, clustering of the wavelet energy features of the destructive test is tested first whether it brings forward meaningful results. Then its repeatability and robustness will be presented. First, fuzzy C-means procedure of MATLAB is utilized to cluster these features with 3 predefined target classes is applied on wavelet energy features of force signal. As presented in Fig.6, vividly the features follow a meaningful trend that marks out three different states of the tool aging. As the cluster membership values are clearly distinct and more or less noiseless, the assigned membership value of a pattern to these clusters can be regarded as a signature for tool-wear development.
V. C LUSTERING R ESULTS AND D ISCUSSIONS In the last section we presented that the wavelet analysis of valid cutting portion of the signal and the localization of flute signal Fig.5. Here, high speed milling process sensor signals are first analyzed for their CWT scales. Then, certain scales of the signal are looked into for their peaks which also represent the time location of the peaks of original cutting signal. The search is conducted on all force and vibration signals to ensure the validity of the peak locations. The details are discussed in [17, 18, 28]. Peak localization is presented in Fig.5 where continuous wavelet analysis of force and vibration in various scales is looked into for correct number of peaks according to cutting conditions, sampling rate and time duration. Using the recorded moment of the start of the peaks, all resulting signals are decomposed into flute cut signals. These signals and their energy distribution in distinct scales are utilized as blueprints to identify the different states in the tool life. From Fig.5 it is obvious that the signal peaks can be successfully captured and location of the start of flute hits can be determined even with the presence of high levels of environmental noise.
Fig. 6.
Fuzzy C-means clustering is applied on extracted features of a destructive-test force signal with preassumed 3 clusters.
Fig. 7.
Application of fuzzy C-means clustering on wavelet features of a destructive-test vibration signal with 3 clusters.
8
It is remarkable that the input data patterns are not labeled with the tool aging states for training. Therefore, the resulting cluster which is considered as a representative of “New Tool” signal patterns, marked as “Red”, is the cluster with higher membership values in the beginning of the experiment, Fig.6. The “Blue” cluster can obviously be associated with “Normal Tool” cluster, or normal condition of tool operation. Similarly the “Green” membership values represent those input patterns which are related to “Worn Tool”. Fig. 10. Four destructive-tests signal features are identified with K-means with 3 clusters. As it is crisp clustering method, distribution of presence of each individual cluster is depicted above. X-axis shows the sequence of incoming samples which can represent time.
Fig. 8. Fuzzy C-means clustering is applied on wavelet energy features of three destructive-tests vibration signals with 3 clusters.
Above mentioned analysis is performed on force rather than noisy vibration and acoustic emission signals. Force sensor might not be desirable choice for industrial platforms due to its expenses and difficult and costly installation. In contrast, the other two are more suitable for these environments while their signals are comparatively more noisy and therefore provide less quality results after clustering. Hence, since clustering results of force comply a reasonable trend, we seek an alternative for it in our TCM. Therefore, same analysis on vibration signal is performed to check if the same trends happen for vibration features. Fig.7 affirms that the noisy clustering results of vibration patterns still follow a similar trend which can lead us to a clear clue on the tool aging after denoising. To ensure that the trend will be followed by other cutters, the test is repeated again for three cutters, Fig.8. where wavelet energy features of vibration follow similar trend of force signals. In our proposed structure in Fig.4, clustering blocks are applied to modify traditional AI-based parts for more robustness toward the replacement of tools. The outputs of this clustering block are always membership values of wavelet energy features to pre-trained clusters
and these values are always between zero and one. As the result, the output level of such blocks remains within certain bounds and they can easily be replaced by another trained cluster with one successful destructive test. The weights in the AI-based block will be trained using necessary BCCD experiments and other available knowledge resources. These experiments can be easily conducted and for many cutters the results are available in handbooks and some other published studies. Our method suggests this knowledge-based method to provide a generalizable reference model that merges all benefits and information of destructive tests and best cutting condition determination tests.
Fig. 12. K-medoids (crisp) clustering is applied on extracted features of four destructive-tests signal features with 3 clusters. Distribution of presence of each individual cluster is depicted above. X-axis shows the sequence of incoming samples that can represent time.
Repeatability and consistency of the clustering results of wavelet energy features can be verified applying clustering on one cutter experiment and then examining its clustering performance on 4 more cutters of nearly the same geometry. In all these five destructive tests, ballnose milling tool is applied from the moment it is “new” till its “worn” condition. Since we apply an unsupervised learning scheme, the reasonableness of the results can be verified when the membership values assigned to each cluster vary meaningfully with the gradual change in the process’s states.
9
Fig. 9.
K-means (crisp) clustering on wavelet energy features of a destructive-tests, 3 clusters. The distribution of presence of each individual cluster is depicted.
K-means clustering (crisp) with three predefined clusters is applied on wavelet energy features of force signal. After training with the wavelet energy features from one cutter, verification is conducted on other cutters. To make the results more understandable, the distribution of the occurrence of each cluster in time is presented in Fig.9. Obviously, the clusters follow similar trends that typify the variations in conditions of the tool wear development.
represents “Worn Tool”. The last cluster that shows a bell-shaped function over time is clearly an indicator of the “Half-Worn” or “Normal” tool condition. So, in Fig.10, the cluster with“Red” resulting membership function represents the “New” tool, “Green” membership values represent the “Half Worn” tool, and “Blue” graph represents the progress of the tool toward its “Worn” condition. To check another clustering method, Fig.11 and Fig.12 present the results of K-medoids clustering method on milling signal features. Another crisp clustering algorithm which provides similar deliverables compared to k-means clustering.
Fig. 13. Fuzzy C-means clustering is trained on extracted features of one destructive-test force and vibration signal with three clusters. It is verified on the above four destructive signals. X-axis shows the sequence of incoming samples that can represent time.
As the data is not labeled before clustering (unsupervised clustering), the results can be explained as follows. If a cluster is regarded as a representative of “New Tool” wavelet energy feature patterns, it must provide higher membership values in the beginning of the destructive test when the tool is actually new. Same analogy can be followed for a cluster that shows ever-increasing membership values during the destructive test and it
Fig. 11.
Let us extend our investigations on fuzzy clustering methods such as Gath-Geva and Fuzzy C-Means (FCM) clustering. Preliminary results for fuzzy c-means method has been reported in [17]. They are proved to be repeatable and consistent among cutters with nearly similar geometry. Its results on pure vibration signal are also shown to have the same characteristics and repeatability [17]. Here, the same clustering algorithm utilizes both force and vibration wavelet energy features. As depicted in Fig.13, three clusters are able to capture the coarse variations in the tool states. Comparing to the Gath-Geva clustering results, Fig.14, Gath-Geva method has the advantage that the membership functions are normal which makes the distinction of the stages of tool degradation easier. On the other hand, considering its computational complexity, with the goal of modifiability
K-medoid (crisp) clustering on wavelet energy features of a destructive-tests, 3 clusters. The distribution of presence of each individual cluster is depicted.
10
for sequential clustering as a way toward its application for online monitoring, fuzzy c-mans appears to be the preferred method among all.
Fig. 15.
An example of constructing IF-THEN rules from input/output pairs when the input data can be grouped into limited number of clusters [29], U represents input space, V represents output j space and Ai and B k s are the fuzzy sets defined on the input and output space, respectively.
Fig. 14. Gath-Geva clustering is trained on extracted features of one destructive-test force and vibration signal with three clusters. It is verified on the above four destructive signals. X-axis shows the sequence of incoming samples that can represent time.
While it is shown that the results of pure vibration signal carry more environmental noise than force signal, yet the clustering methods on both or even vibration can be performed and delivers acceptable results [17]. Note that we do not blindly claim that clustering analysis is suitable to be placed as an interpretation layer in this case, while we know that generally it is not always a preferred choice. An exception that can be mentioned here is the case where we have uniformly distributed input samples in input space. In such cases other modeling methods can be applied to correlate the input/output pairs, i.e to model such cases using fuzzy logic, rule base can be formed based on the input/output pairs of data. In contrast, cases that the input data can be clustered properly, the rules can easily be defined for a cluster of data rather than for individual pairs of data, Fig.(15). The resulting rules can then be formulated and presented in the form of mathematical functions too using proper choices of fuzzifiers, defuzzifiers and inference engine. Please refer to [29] chapter 15 for more details on the benefits of application of clustering in fuzzy modeling. Therefore, it is important for us to show that the signal features in our study are able to be clustered using available clustering methods and application of this clustering algorithms will result into meaningful separation of the data samples in input space as well as reducing the dimension of the input space. The repeatability of clustering methods are verified by applying the same process on the wavelet energy features of three slightly dissimilar tools which only differ in their edge preparation and coating methods. In Fig.10,12,13,14 we can see the robustness of clustering results on similar-geometry cutters. It suggests that these results can be applied for tool condition monitoring purposes.
To verify such results, the clustering imperfections have to be correlated to the physical phenomena on the ball-nose face-milled surface or the tool. If there is any correlation between these two happenings, new clusters come to the knowledge database to make it more perfect for explaining the milling process. These investigations will make the future work of this study. Comparing the results of clustering algorithms with some methods from the literature which use wavelet features of the signal, the superiority of clustering methods can be shown. In all such methods we do not expect the models to provide an exact prediction of the outputs of the process, such as tool wear or surface roughness. As the output of clustering algorithms are membership values of the features to the clusters, we expect them to qualitatively compare these features. For example, in the study [30] which actually shares the same dataset as ours for one cutter, the quality of the process is shown to be reflected in standard deviation and magnitude of some levels of wavelet analysis of the cutting signal. However, the “pre-critical”, “critical” and “post-critical” stages of the cutting process were introduced based on the “average” magnitude of high frequency detail of the wavelet analysis of one cut signal. This can be in some cases unreliable as the signal might change drastically during one cut when the workpiece is hard-to-cut material. In contrast, based on the vectors of energy features of CWT of the signal, every “time window” of the signal, which is very small compared to the time for one cut, is analyzed by wavelet analysis, its features are extracted, clustered and the decision can be made on the moment. Here we claim that even without any following artificial intelligence block, clustering results and their successive classifications can be easily be used for fault diagnosis and prognosis of milling processes simply by putting yellow and red line thresholds on output membership values.
11
Another novelty in our study is to show the reliableness of use of vibration signals rather than force signals which is a very important step forward considering the fact that vibration sensors are much easier to install. For the models that apply artificial intelligence schemes directly on signal features, it is clear that clustering methods can contribute a lot for repeatability, generalizablilty, and online monitoring. Considering the above mentioned results, these clustering methods can modify traditional AI-based models in the way that they can be more robust to the change of tool conditions while incorporating the results of other tests on the tool such as BCCD experiments, etc. More details are explained in [28] and Section IV-B. However, there are some issues with the present algorithm. The first issue is misclassification of some data patterns. As the results present, any online fault diagnosis or prognosis method has to be not too sensitive to misclassification of one input signal feature pattern in order to avoid any wrong decisions based on noisy data. Luckily, the process is slow enough for the condition detection system to get enough samples before stopping the machine or reporting any alarms. However, some of the clustering imperfections might have some origins in cutting process side phenomena, like shearing, rubbing, cracking, etc. To verify such results, the clustering imperfections have to be correlated to the physical phenomena on the ball-nose face-milled surface or the tool. If there is any correlation between these two happenings, new clusters come to the knowledge database to make it more perfect for explaining the milling process. These investigations will make the future work of this study. VI. C ONCLUSION In this paper further study on the clustering block of a proposed method for AI-based modeling of ball-nose milling process is presented. Then, benefits of utilization of clustering methods in milling tool condition detection system are discussed and investigated. To apply clustering method in the proposed structure, wavelet analysis of milling signal are utilized for peak localization and energy computation of the flute cutting signals. Then, wavelet features of force and vibration are extracted to be used in the clustering method. Applying clustering methods, force and vibration signal features are checked to have consistent and repeatable patterns among several cutters. Since the results of data clustering methods are invariant in all of the experiments conducted on cutters of the same geometry, these methods can be applied in a generalizable tool condition detection structure. They also can be considered as an indication of surface roughness condition as these two factors are highly correlated. The validity of the idea
and repeatability and consistency of clustering on milling process is verified by application of these methods on five different cutters of the same geometry for training and testing. It is practically shown that the results of clustering methods are repeatable, noise-robust and meaningful. The application of these results for fault detection is also compared to state of the art papers. Among these techniques, FCM clustering is most suitable as it is easily modifiable for sequential clustering. It is also comparatively less computational complex among fuzzy clustering techniques. Future works will open the field to supplementary results based on the proposed structure on cutters of different geometry and various cutting conditions as well as investigating for dynamic fuzzy neural networks based condition monitoring of the outputs of HSM process. ACKNOWLEDGMENT This research is supported by the A*STAR Science and Engineering Research Council Singapore-Poland Program. The authors also thank the Singapore Institute of Manufacturing Technology and their staff for kindly providing the experiment set-up and data. Authors also would take this opportunity to thank the anonymous reviewers for their kind time and uplifting suggestions. Amin Torabi Jahromi is also thankful for continuous supports and encouragements he received from prof. Sajjad Dehghani, Shiraz university and members of JUPNS industrial research and development company, Shiraz, Iran. A BBREVIATIONS AND ACRONYMS .................................................................... AE . . . . . . . . . . . . . . . . . . . . . . . . . . . . . . . . . . . . . . . . . . . . . . . . . . Acoustic Emission AI . . . . . . . . . . . . . . . . . . . . . . . . . . . . . . . . . . . . . . . . . . . . . . . . Artificial Intelligence BCCD . . . . . . . . . . . . . . . . . . . . . . . . . . . . . . . best cutting condition determination CWT . . . . . . . . . . . . . . . . . . . . . . . . . . . . . . . . . . . . Continuous Wavelet Transform Dc . . . . . . . . . . . . . . . . . . . . . . . . . . . . . . . . . . . . . . . . . . . . . . . . . . . . . . . . depth of cut DWT . . . . . . . . . . . . . . . . . . . . . . . . . . . . . . . . . . . . . . . Discrete Wavelet Transform Fc . . . . . . . . . . . . . . . . . . . . . . . . . . . . . . . . . . . . . . . . . . . . . . . . . . . . . . . . . . . . feed rate FCM . . . . . . . . . . . . . . . . . . . . . . . . . . . . . . . . . . . . . . . . . . . . . . . . . . . Fuzzy C-Means HSM . . . . . . . . . . . . . . . . . . . . . . . . . . . . . . . . . . . . . . . . . . . . . . . High Speed Milling Ra . . . . . . . . . . . . . . . . . . . . . . . . . . . . . . . . . roughness profile, arithmetic average RMS . . . . . . . . . . . . . . . . . . . . . . . . . . . . . . . . . . . . . . . . . . . . . . . . Root Mean Square RPM . . . . . . . . . . . . . . . . . . . . . . . . . . . . . . . . . . . . . . . . . . . . . . Rotation Per Minute Vc . . . . . . . . . . . . . . . . . . . . . . . . . . . . . . . . . . . . . . . . . . . . . . . . . . . . . . . cutting speed TCM . . . . . . . . . . . . . . . . . . . . . . . . . . . . . . . . . . . . . . . . Tool Condition Monitoring
R EFERENCES [1] W.A. Kline, R.E. DeVor, and J.R. Lindberg. The prediction of cutting forces in end milling with application to cornering cuts. International Journal of Machine Tool Design and Research, 22(1):7–22, 1982. [2] Torabi A.J., Er M.J., X. Li, Lim B.S., L. Zhai, S.J. Phua, J. Zhou, S. Lin, S. Huang, and J.T.T. Tijo. A survey on artificial intelligence technologies in modeling of high speed end-milling processes. In Advanced Intelligent Mechatronics, 2009. AIM 2009. IEEE/ASME International Conference on, pages 320–325, 2009. [3] Torabi A.J., Er M.J., and Li X. A survey of modeling techniques for milling processes. IEEE Systems Journal, 2014. [4] Steven Y. Liang, Rogelio L. Hecker, and Robert G. Landers. Machining process monitoring and control: The State-of-the-Art. Journal of Manufacturing Science and Engineering, 126(2):297–310, May 2004.
12
[5] R. Teti, K. Jemielniak, G. O’Donnell, and D. Dornfeld. Advanced speed milling processes. In 2012 7th IEEE Conference on Industrial Electronics and Applications (ICIEA), pages 1249 –1254, July 2012. monitoring of machining operations. CIRP Annals - Manufacturing [29] Li-Xin Wang. A Course in Fuzzy Systems and Control. Prentice-Hall Technology, 59(2):717–739, 2010. press, USA, 1999. [6] K.P. Zhu, Y.S. Wong, and G.S. Hong. Wavelet analysis of sensor signals for tool condition monitoring: A review and some new results. [30] L. Y. Zhai, M. J. Er, X. Li, O. P. Gan, and L. San. Wavelet-based analysis of force signals for monitoring and prediction of cutting performance International Journal of Machine Tools and Manufacture, 49(7-8):537– in high-speed milling processes. Engineering Letters, 19(3), 2011. 553, 2009. [7] Xiaoli Li. A brief review: acoustic emission method for tool wear Amin Torabi Jahromi was born in Jahrom, Iran monitoring during turning. International Journal of Machine Tools and in 1982 and received his B.Sc and M.Sc degrees in Manufacture, 42(2):157–165, 2002. Control Engineering, Shiraz University, Iran, in 2004 [8] P. W. Prickett and C. Johns. An overview of approaches to end and 2007, respectively. He is now with Nanyang milling tool monitoring. International Journal of Machine Tools and Technological University of Singapore as a PhD Manufacture, 39(1):105–122, January 1999. student and also serves as a lecturer in Persian Gulf [9] Litao Wang, Mostafa G. Mehrabi, and Jr. Kannatey-Asibu. Hidden Univrsity of Bushehr, Iran. He worked on many markov model-based tool wear monitoring in turning. Journal of practical projects and industrial challenges during Manufacturing Science and Engineering, 124(3):651–658, 2002. his academic studies in Student Research Center [10] Karali Patra, Surjya K. Pal, and Kingshook Bhattacharyya. Application of Shiraz University, “Radio Amatory Lab” and also SIMTech, Singapore. of wavelet packet analysis in drill wear monitoring. Machining Science During his PhD studies, he worked with some authors of this paper as an award and Technology: An International Journal, 11(3):413, 2007. winning team that secured the IES Prestigious Engineering Achievement [11] Ya Wu and R. Du. feature extraction and assessment using wavelet Award 2011. His research interests include intelligent systems, fuzzy logic, packets. Mechanical Systems and Signal Processing, 10(1):29–53, 1996. linear and nonlinear control theory and their applications and also application [12] Xiaozhi Chen and Beizhi Li. Acoustic emission method for tool of intelligent systems, clustering algorithms, data analysis and data mining in condition monitoring based on wavelet analysis. The International various control, mechanical and telecommunication systems. Journal of Advanced Manufacturing Technology, 33(9):968–976, July 2007. Professor Er Meng Joo is currently a Full [13] D. Paul. Detection of change in processes using wavelets. In ProceedProfessor in Electrical and Electronic Engineering, ings of the IEEE-SP International Symposium on Time-Frequency and Nanyang Technological University, Singapore. He Time-Scale Analysis, pages 174–177, 1994. has authored 5 books, 16 book chapters and more [14] E.-G. Ng, D.W. Lee, R.C. Dewes, and D.K. Aspinwall. Experimental than 400 refereed journal and conference papers in evaluation of cutter orientation when ball nose end milling inconel his research areas of interest. His areas of research 718(TM). Journal of Manufacturing Processes, 2(2):108–115, 2000. interests are computational intelligence, robotics and [15] X. Li, S. K. Tso, and J. Wang. Real-time tool condition monitoring automation, sensor networks, biomedical engineerusing wavelet transforms and fuzzy techniques. IEEE Transactions ing and cognitive science. In recognition of the on Systems, Man, and Cybernetics, Part C: Applications and Reviews, significant and impactful contributions to Singapore’s development by his re30(3):352–357, 2000. search project entitled ”Development of Intelligent Techniques for Modelling, [16] Li Xiaoli and Yuan Zhejun. Tool wear monitoring with wavelet packet Controlling and Optimizing Complex Manufacturing Systems,” Professor Er transform–fuzzy clustering method. Wear, 219(2):145–154, September won the Institution of Engineers, Singapore (IES) Prestigious Engineering 1998. Achievement Award 2011. He is also the only dual winner in Singapore [17] Torabi A.J., M.J. Er, X. Li, B.S. Lim, Zhai L.Y., Sheng H., Lin S., IES Prestigious Publication Award in Application (1996) and IES Prestigious and Gan O.P. Fuzzy clustering of wavelet features for tool condition Publication Award in Theory (2001). Currently, he serves as the Editor-inmonitoring in high speed milling process. In Proceedings of the Annual Chief of the International Journal of Electrical and Electronic Engineering Conference of the Prognostics and Health Management Society 2010, and Telecommunications, an Area Editor of International Journal of Intelligent Portland, Oregon, USA, October 2010. Systems Science, an Associate Editor of eleven refereed international journals [18] Torabi A.J., M.J. Er, X. Li, B.S. Lim, Zhai L.Y., R.J. Oentaryo, Lin and an editorial board member of the EE Times. S., and Gan O.P. Clustering methods for tool condition monitoring, repeatability and application. In IECON 2011, Melbourne Australia, Li Xiang received her Ph.D. degree from Nanyang November 2011. Technological University, Singapore in 2000, as well [19] Zhijun Wang, Wolfhard Lawrenz, Raj B. K. N. Rao, and Tony Hope. as M.E. and B.E. degrees from Northeastern UniverFeature-filtered fuzzy clustering for condition monitoring of tool wear. sity, China, in 1987 and 1982, respectively. She has Journal of Intelligent Manufacturing, 7(1):13–22, February 1996. more than 15 years of experience in research and [20] X. Li, M.J. Er, B.S. Lim, J.H. Zhou, O.P. Gan, and L. Rutkowski. Fuzzy applications of data mining, artificial intelligence regression modeling for tool performance prediction and degradation and statistical analysis, such as neural networks, detection. International Journal of Neural Systems, 20(5):405–419, fuzzy logic systems, data clustering and multiple 2010. regression modeling. [21] M.A. Elbestawi, J. Marks, and T. Papazafiriou. Process monitoring in milling by pattern recognition. Mechanical Systems and Signal Beng Siong Lim joined SIMTech in 1987 folProcessing, 3(3):305–315, July 1989. lowing the development of an aerospace flight sim[22] Intelligent monitoring of surface integrity and cutter degradation in highulator configuration and sales engineering system at speed milling processes. Brighton University for Rediffusion Simulation at [23] I. Gath and A. B. Geva. Unsupervised optimal fuzzy clustering. Crawley. He pursued his Ph.D. with a scholarship Pattern Analysis and Machine Intelligence, IEEE Transactions on, from the University of Nottingham in the applica11(7):773780, 1989. tions of computational intelligence for component [24] J. C. Bezdek. Pattern recognition with fuzzy objective function algodesign and tool engineering. His main interest inrithms. Kluwer Academic Publishers Norwell, MA, USA, 1981. cludes the development of evolutionary computation [25] Fuzzy clustering :: Tutorial (Fuzzy logic toolbox). for performance degradation, characterisation and reference modelling. http://www.mathworks.com/access/helpdesk/help/toolbox/fuzzy/fp310.html. Gan Oon Peen is a research scientist and group [26] J.C. Bezdek and J.C. Dunn. Optimal fuzzy partitions: A heuristic manager at the Singapore Institute of Manufacturing for estimating the parameters in a mixture of normal distributions. Technology and a technical lead at the National Computers, IEEE Transactions on, C-24(8):835–838, 1975. RFID Centre Singapore. He received his Ph.D from [27] Nikhil R. Pal, James C. Bezdek, and Richard J. Hathaway. SequenNational University of Singapore in 1997. His retial competitive learning and the fuzzy c-means clustering algorithms. search interests are in the area of intelligent factory Neural Networks, 9(5):787–796, July 1996. control and prognostic health management, in partic[28] A.J. Torabi, Er Meng Joo, Li Xiang, Lim Beng Siong, Zhai Lianyin, ular, intelligent control, discrete event system modSan Linn, Gan Oon Peen, and Ching Chuen Teck. Application of eling and control, data mining, operation research, classical clustering methods for online tool condition monitoring in high and industrial automation.