POWERENG 2009
Lisbon, Portugal, March 18-20, 2009
Application of Data Mining on Fault Detection and Prediction in Boiler of Power Plant Using Artificial Neural Network Elyas Rakhshani
Iman Sariri
Kumars Rouzbehi
Islamic Azad University, Gonabad Branch, Iran
Azad University of Mashhad, Iran
[email protected],
[email protected]
[email protected]
Abstract-This paper tries to present a new applied method on detection and prediction of faults for the boiler's burner system of power plant with using data mining and artificial neural network. Boiler/Steam turbine is important equipments in the industry, especially in the electric power industry. Because of the complexity of burner management systems and particularity of its running environment, the fault rate of boiler's burner system is high. So the fault prediction is a difficult problem. The proposed approach includes data mining, data preprocessing i.e. data reduction, data clustering; learning and prediction by artificial neural networks. Boiler/turbine units constitute a critical component of a co-generation system. The operative parameters in boiler's burner system are measured and are characterized to obtain a set of descriptors. These sets are analyzed by data mining approach. Next, these preprocessed data are used as input data of two neural networks which detect and predict the faults in a boiler of power plant. Multiplayer back propagation neural network with four hidden layers, as one of the steps in data mining process is studied. The knowledge extracted by this data mining algorithm is an important component of an intelligent alarm system. Furthermore, using this method is more valuable for the further study.
I.
INTRODUCTION
Boilers are important components in oil refinery, chemical and power industries; they transform water into steam for power generation or other industrial applications. A common boiler fault is the malfunction in boiler's burner system. Early detection of such faults in operation are important; It helps in reducing possible damage to equipments and productivity loss caused by (otherwise) unscheduled boiler shut-down; it also ensures safety for operators. Boiler’s burner faults are a special type of faults in process systems that can be frequent. It is mainly the operator who detects, isolate and take action when a fault appears. It can be very hard to distinguish between normal process operation and a developing fault. Earlywarning systems can help the process operator to detect faults at an early stage and thus prevent further fault development. However, boilers are complex systems involving various disturbances, nonlinearities, and time-varying characteristics with many parameters. The values of these parameters must be recorded for each second. This recording makes large volumes of routinely collected temporal data. Unusual events are often characterized by normal parameter conditions sequenced in abnormal combinations that are hidden in large volumes of this temporal data. They may lead to a terrible system failure. The
978-1-4244-2291-3/09/$25.00 ©2009 IEEE
ability to predict and avoid these rare events is a challenge that could be addressed by an intelligence data mining approaches. So it is necessary to apply a complete method for providing a satisfactory performance in fault detection and prediction problem. Among various data analyzing and interpreting approaches, the data mining technique is considered an advanced means [1]. The core components of data mining technology have been under development for decades and various models have been developed, for example classical statistics regression analysis, decision tree [2], rough sets [3], and the machine learning based method (e.g. generic programming, artificial neural networks, etc.). These technologies have already been proven successfully in a variety of application domains, such as stock market assessment and prediction [4], medical diagnosis and protein structure discovery [5,6], analysis of insurance packages [7], detect of useful information form the power system data bases [8,9] and structural health monitoring [10,11]. However, the application of the data mining technique to handle massive nuclear power plant quake-proof information is a new attempt. In this research, an effective and applied method on detection and prediction of faults for the boiler's burner system of power plant is presented, taking into account boiler parameters. Boiler/Steam turbine is important equipments in the industry, especially in the electric power industry. Because of the complexity of burner management systems and particularity of its running environment, the fault rate of boiler's burner system is high. So the fault prediction is a difficult problem. The proposed approach includes data mining, data preprocessing i.e. data reduction, data clustering; learning and prediction by artificial neural networks. Boiler/turbine units constitute a critical component of a co-generation system. The operative parameters in boiler's burner system are measured and are characterized to obtain a set of descriptors. These sets are analyzed by data mining approach. Next, these preprocessed data are used as input data of two neural networks which detect and predict the faults in a boiler of power plant. Multiplayer back propagation neural network with four hidden layers, as one of the steps in data mining process were studied. The knowledge extracted by this data mining algorithm is an important component of an intelligent alarm system. Application of the proposed scheme to industrial case studies
shows the advantages of proposed method. Furthermore using this method is more valuable for further study. Briefly, this paper is organized as follows; Section II briefly introduces some important components of boiler model, Section III presents the proposed fault detection and prediction data mining approach, Section IV shows the results of simulation case studies. Finally, Section V offers some concluding remarks. II.
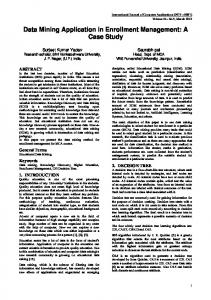
Sequence in equipments of burner system, Change on cooling fans and Condition of soot blower. Figure 1 shows elements and connections of the boiler and heating system. III. PROPOSED FAULT DETECTION AND PREDICTION METHOD The efficiency of the traditional data analysis method is impaired significantly in view of the huge volume of data and as the inaccessibility of profound information hidden inside the data limits the improvement of management level and enhancement of economic profits. The power plants need for rapid data accessing and collecting techniques to replace the tradition crude data analysis methods. So a new approach based on intelligent data mining is proposed. This method includes of four steps and the artificial network is used in one of steps of this method. One of the advantages of the data-mining approach is its ability to generate previously unknown models using essentially unlimited number of quantitative and qualitative parameters. The discovered models are then validated and tested without the need for full understanding of the process physics. This quick discovery of usable models involving qualitative and quantitative parameters with data-mining algorithms may offer an effective paradigm for combustion research. The key to successful detection of faults with a data mining approach is in parameter reduction, data preprocessing, statistical analysis, time segmentation, and event labeling. As shown in Fig. 2, this mining approach can be described as follows: Step 1: data collection, Step 2: data pre-processing, Step 3: model estimation by ANN, Step 4: test and interpretation.
DESCRIBE OF BOILER MODEL
Boiler means equipment, where fuel burns and heat is transferred from flue gas to energy transfer medium, which is heated up or phase change (boiling) happens. In order to ensure efficient combustion and compliance with the emissions standards, boilers must be operated and maintained according to the manufacturer's instructions. Boiler/Steam turbine is important equipments in the industry, especially in the electric power industry. Because of the complexity of burner management systems and particularity of its running environment, the fault rate of boiler's burner system is high. So this paper is focused on detection and prediction of faults in boiler's burner system. Basically the boiler is consisted of several components but in this research just the effective parameters on fault in burner system are recognize and applied for simulation; such as [12]: Fuel pressure, Fuel temperature, Fuel flow, Atomizing pressure, Condition of full-load generation, Output pressure of F.D.Fan, Air box pressure, Steam pressure of boiler, Steam temperature of boiler, Damper condition, Fuel filtering, Drum oscillation, Situation of pneumatic valves, Photocell condition, Smoke
Steam Economizer
A I R
E X H A U S T
DRUM
Super heater
B O X
Dry steam Turbine
Generator
Water Walls Steam
Pre-processing of steam For recycling F.D FAN Make up
Environment
Air Air re-heater by smoke
Fig. 1. Schematic viewpoint of a steam boiler in power plant.
Boiler Steam and water
Primary water (Compensator)
Step 1: In this step, after recognization of effective parameters on problem, the required data are selected to build the data set of the simulation. These data are recorded for six months of a year in boiler unit of a power plant. The most important point in this step is the attention to data selection; because these selections must be match with condition of the type of ANN. In fact these selections must be compatible with used feed-forward backpropagation networks as inputs. Step 2: Data mining is impossible without data pre-processing. This step consists of data reduction, data elimination, data normalization and data clustering. Data reduction is imperative for efficiently manipulating the massive quantity of data. On data reduction an average method is be used [1]. In fact, each 24 hours of a day, is divided to three parts. Each of these parts is about 8 hours and the same recorded data are reduced to average data for each 8 hours. But for the data elimination, the data are preprocessed to remove noise and missing values, to correct errors. Next, all of data are normalized using (1): xi − min( xi ) xi′ = (1) max( xi ) − min( xi ) Finally these data are prepared for clustering. Clustering process divides a database into different groups. The goal of clustering is to find groups that are very different from each other, and whose members are very similar to each other. Some of the common algorithms used to perform clustering include Kohonen feature maps and K-means [13]. After more computational efforts, we detect three types of cluster. In Recognize of effective parameters
Data warehouse
Data warehouse
Data collection
Data reduction Data elimination Normalization
Clustering A, B1, B2
Data Pre-processing
Data clustering
fact it is better to use these data based on these types of cluster: Cluster A: This group is included of data on normal operating condition of unit. Cluster B1: This group is included of data under immediate fault condition. Cluster B2: This group is included of data under dependent fault condition for future. In the boiler's burner system some of rare events cause of defect on components that result kind of faults immediately. Such as: mechanical defect on sequence, high decrease on pressure or temperature of fuel. But some of defect may affect on other components that cause to reduce the efficiency of boiler. So a dependent fault occurs in the future operating cycles. For example: leakage on pneumatic valve or dirty photocell. Step 3: In this step two types of neural networks are used for learning the behavior of model. Based on the clustering in previous step; in order to detection and prediction of faults, two types of networks are used for training process. The first network is used for training of B1 cluster (for immediately faults) and the second is used for training of B2 cluster (for dependent faults). Step 4: In this step some practical data are used for evaluating networks. But for more interpretation, some rule bases is assumed. Details of this step are presented in the section IV.B. A. Used networks for training of model The most successful implementations of neural networks involve very careful data learning, recognition and prediction. For instance, neural nets require that all variables be numeric. Use of ANN reduces the need for the complex modelization associated with quantitative model-based approaches, since they are inherently immune to noise and capable of extrapolating beyond their training scope. ANN can be used to process the database with satisfactory results even in their most simple forms, i.e. feed-forward Back-propagation networks using standard training algorithms. As shown in Fig. 3, the used network is included of four hidden layer. Sigmoid activation functions are used for these layers and for the output layer, a linear activation function is applied [13]. 1 2 3 4 5
True
Model estimation Training A, B1
Test
ANN1
ANN2
Test and interpretation
ANN
Fault
Training A, B2
i Output Layer
Input Layer Hidden Layer
Fig. 3. Structure of used network. Fig. 2. Flowchart of the proposed method.
IV. SIMULATION RESULTS
A.1. proposed network for fault detection: In order to detection of immediate faults, all of the prepared data of each operating cycle (for each 8 hour) is used as input of the network that is shown in Fig. 4. This network includes of four hidden layer and the number of neurons in each layer is 27, 23, 17 and 17, respectively. The number of input data of each operating cycle in this step is 20 and the Gradient descent with momentum and adaptive learning rate back-propagation method is used for training [13]. Results of this simulation are presented in section IV. Input Layer
Fuel pressure Fuel temperature Pneumatic valve
1 2
(Each cycle)
18 20 parameters Sensitivity of photocell 19 Atomizing pressure 20
True or (27-23-17-17) Fault
ANN1
In this section, to verify the performance of proposed methods, two studies have been done. The first one is based on fault detection in recent operational cycle and the second study is based on prediction of faults for each next cycle. The simulations are done using MATLAB platform and the system parameters are given in [12]. Note that each parameters that are defined in section II, must be work in acceptable operational range. So when the values of each parameter violates from this range, a type of fault may be occurs. For each case, to demonstrate effectiveness of the proposed method, the Root Mean Square Error (RMSE) is calculated by: RMSE = 1 Q 1Q
Fig. 4. Schematic figure of training process in fault detection.
A.2. proposed network for fault prediction: In this section, in order to prediction of faults, the data of each two continual cycle (each cycle include of 8 hours) are used as input of network. This process is shown in Fig. 5. So the number of input for this network is 40 and the Scaled conjugate gradient back-propagation method is used for training of this large network [14]. Minimization is a local iterative process in which an approximation to the function, in a neighborhood of the current point in the weight space, is minimized. cycle1
cycle2
∑k =1e(k ) 2 = Q
∑k =1(outputdesired (k ) − outputANN (k )) Q
(4) 2
A. Case 1: fault detection In this section, based on the information of section III, the network is trained. Next, the results of testing network are presents in Figs. 6-7 and Table I. Note that, the desired outputs for training of networks are 0 and 9. In fact, the 0 value is used for each fault and the 9 value is used for the correct condition of boiler.
1 2 20 21
ANN2
38
(131-97-77-37)
39
True or Fault Prediction for cycle3
40
Fig. 5. Schematic figure of training process in fault prediction.
Fig. 6. Total square error in learning process for case 1. 10
8
6 output values
Most of the optimization methods used to minimize functions is based on the same strategy. The Scaled Conjugate Gradient (SCG) algorithm [14] denotes the quadratic approximation to the error E in a neighborhood of a point w by: 1 (2) Eqw( y) = E(w) + E′(w)T . y + yT .E′′(w).y 2 In order to determine the minimum to Eqw(y) the critical points for Eqw(y) must be found. The critical points are the solution to the linear system defined by Moller in [15]. 1 (3) Eqw ( y) = E(w) + E′(w)T . y + yT .E′′(w).y 2 SCG belongs to the class of Conjugate Gradient Methods, which show super-linear convergence on most problems. By using a step size scaling mechanism SCG avoids a time consuming line-search per learning iteration, which makes the algorithm faster than other second order algorithms. And also we got better results than with other training methods and neural networks tested, as standard back-propagation and cascade neural network.
4
2
0
-2 0
10
20
30
40 50 60 test samples (ANN1)
70
80
90
Fig. 7. Spread of results for case 1. (0=fault and 9=true), circle: real values and star: by ANN.
TABLE I SIMULATION RESULTS IN CASE1. Q
1 2 3 4 5 6 7 8 9 10 11 12 13 14 15 16 17 18 19 20 21 22 23 24 25 26 27 28 29 30 31 32 33 34 35 36 37 38 39 40 41 42 43 44 45 46 47 48 49 50 51 52 53 54 55 56 57 58 59 60 61 62 63 64
Detection of faults in boiler of power plant: Actual Estimated by ANN1 Value Type Value Type
9 9 9 9 9 9 9 0 9 9 9 9 0 9 9 9 9 9 9 9 0 9 9 9 9 9 0 9 9 0 9 9 9 9 9 9 9 9 0 9 9 9 9 9 0 9 0 9 9 0 9 9 9 9 9 9 9 0 9 9 9 0 9 9
T T T T T T T F T T T T F T T T T T T T F T T T T T F T T F T T T T T T T T F T T T T T F T F T T F T T T T T T T F T T T F T T
9.01689 9.01711 9.01727 9.01695 9.01621 9.01954 9.01622 0.57386 9.01662 9.01612 9.01612 9.01612 0.04484 9.01703 9.01711 9.01593 9.01702 9.01741 9.01274 9.01594 0.02825 9.02359 9.01786 9.01893 9.01809 9.01707 2.73384 9.01824 9.01801 -0.03741 9.02092 9.02174 9.02017 9.02187 9.02034 9.01872 9.01758 9.01542 -0.0235 9.01515 9.02416 8.99343 9.00591 9.01332 0.67475 9.01794 1.88953 9.01631 9.01647 2.61215 9.01601 9.01564 9.01605 9.01631 9.01539 9.01606 9.01646 0.01429 9.01753 9.01768 9.01695 3.50646 9.01687 9.01708
T T T T T T T F T T T T F T T T T T T T F T T T T T F T T F T T T T T T T T F T T T T T F T F T T F T T T T T T T F T T T F T T
65 66 67 68 69 70 71 72 73 74 75 76 77 78 79 80 81 82 83 84 85 86 87 88 89 90
9 0 9 9 9 9 9 0 9 9 9 0 9 9 9 9 9 0 9 9 9 0 9 9 9 9
T F T T T T T F T T T F T T T T T F T T T F T T T T RMSE for test data =
9.01705 1.42728 9.01753 9.01685 9.01606 9.01608 9.01635 0.13446 9.01758 9.01694 9.01755 0.03024 9.01822 9.01847 9.01895 9.01671 9.01819 3.69621 9.01511 9.01774 9.01684 0.01797 9.00726 9.01911 9.01558 9.01907 0.72028
T F T T T T T F T T T F T T T T T F T T T F T T T T
B. Case 2: fault prediction In this case, based on the information in section III for fault prediction in future cycle, another simulation is done. But for more interpretation, some rule bases is assumed: IF THEN True output ANN 2 ≥ 7.65 IF
6< output ANN 2