IJMGE Int. J. Min. & Geo-Eng. Vol.50, No.1, June 2016, pp.37-48.
Application of fractal modeling and PCA method for hydrothermal alteration mapping in the Saveh area (Central Iran) based on ASTER multispectral data Mirko Ahmadfaraj1, Mirsaleh Mirmohammadi1* and Peyman Afzal2,3 1. School of Mining Engineering, College of Engineering, University of Tehran, Tehran, Iran 2. Department of Mining Engineering, South Tehran Branch, Islamic Azad University, Tehran, Iran 3. Camborne School of Mines, University of Exeter, Penryn, UK. Received 9 Nov. 2015; Received in revised form 14 Jan. 2016; Accepted 7 Feb. 2016 *Corresponding author Email:
[email protected], Tel: +989123715502
Abstract The aim of this study is determination and separation of alteration zones using Concentration-Area (CA) fractal model based on remote sensing data which has been extracted from Advanced Spaceborne Thermal Emission and Reflection Radiometer (ASTER) images. The studied area is on the SW part of Saveh, 1:250,000 geological map, which is located in Urumieh-Dokhtar magmatic belt, Central Iran. The pixel values were computed by Principal Component Analysis (PCA) method used to determine phyllic, argillic, and propylitic alteration zones. The C-A fractal model is utilized for separation of different parts of alteration zones due to their intensity. The log-log C-A plots reveal multifractal nature for phyllic, argillic, and propylitic alteration zones. The obtained results based on fractal model show that the main trend of the alteration zones is in NW-SE direction. Compared to the geological map of the study area and copper mineralizations, the alteration zones have been detected properly and correlate with the mineral occurrences, intrusive rock, and faults. Keywords: ASTER, Concentration–Area (C-A) fractal model, hydrothermal alteration mapping, Principal Component Analysis (PCA), Saveh.
1. Introduction Remote sensing technique is an effective method for mineral exploration. The remote sensing techniques are used for mineral exploration and geosciences in two usages: 1. mapping of faults, fractures, and lineaments
2. delineation of hydrothermal alteration zones [1-5]. The purpose of displaying the multispectral image should not only be to provide a visual representation of the different images; although this has been the primary objective of most conventional methods. The color palette 37
Ahmadfaraj et al. / Int. J. Min. & Geo-Eng., Vol.50, No.1, June 2016
should reflect real-world features on the ground which must be the primary objective employing remote sensing data [6]. One of the main tasks involved in image processing is to classify image values into components and to establish the relationships between these components and features on the surface. These relationships can be visualized with a proper visual illustration or analyzed by means of various quantitative methods. Nevertheless, the first view of the image with an appropriate color palette can be important, since it gives users the first perspective of the spatial distribution of multispectral image pixel values [6]. Principal component analysis (PCA) is a common method of analysis for correlated multivariable datasets, and the technique is widely used for multispectral image interpretation based on linear algebraic matrix operations. The PCA can effectively concentrate the maximum information of many correlated image spectral bands into a few uncorrelated principal components and, therefore, reduce the size of a dataset and enable effective image RGB display of its information [3, 4, 18, 35]. This links to the statistical methods for band selection that aim to select optimum band triplets with minimal inter-band correlation and maximum information content [7]. The term fractal was introduced by [8, 9] to portray objects or patterns consisting of parts (i.e., fractions) that have geometries (e.g., shape or form), except scale or size, that are more or less similar to the whole object or pattern. Fractal geometry is one of the nonEuclidian geometries widely used in different branches of geosciences since 1980s, e.g., [1013]. The C-A fractal model has been proposed by [10] and is practical for the separation of geochemical and geophysical anomalies from background [14-17]. The C-A fractal modeling is relevant not only to separate geochemical anomalies but also has found obvious capabilities for image classification [6, 18, 19]. In this paper, Advanced Spaceborne Thermal Emission and Reflection Radiometer (ASTER) images were analyzed to categorize alteration zones by the Concentration-Area (C-A) fractal model in the SW part of Saveh, 1:250,000 sheet, central Iran. In addition, the alteration zones derived via fractal modeling and PCA were correlated
with geological features including faults, intrusive bodies, and copper mineralizations. 2. Geological setting The studied area is situated in the SW part of Saveh, 1:250,000 sheet, in Markazi province, central Iran (Fig. 1). This area is located in the Urumieh-Dokhtar magmatic arc (UDMA). The UDMA, running from eastern Turkey to southeast Iran, is mainly composed of EoceneMiocene volcano-sedimentary sequences and associated plutonic rocks [20, 21]. The UDMA ranges in width from 4 to 50 km and extends over a strike length of about 2000 km from northwest to southeast and is characterized by subduction related calcalkaline rocks [22]. It represents an important metalliferous region due to the presence of Cu-Fe-Au-Mo-W deposits that are in relation to fault system and also hydrothermal alteration zones [23, 24]. Magmatism occurred principally during the Eocene but had later been reactivated, after a quiescent period, during the Upper Miocene to Plio-Quaternary. Although most of the igneous rocks of the UDMA are calc-alkaline, some volcanic rocks show alkaline or shoshonitic affinity [25, 26]. This region generally includes Eocene volcanic rocks consisting of andesites and trachyandesites, pyroclastics and andesiticdacitic tuffs, and Neogene sedimentary rocks. Oligo-Miocene metallic occurrences and deposits spread mainly in the parts of the sheet and discordantly have been situated on Eocene volcanic rocks and Cretaceous sedimentary rocks. Intrusive rocks consist of diorite, gabbro, granodiorite-monzonite, and diabasic dikes which have intersected Eocene volcanic rocks as depicted in Figure 2 [27]. The main fault system has NW-SE trend which is related to ore mineralization (Cu, Pb-Zn and Fe) in the studied area. Furthermore, faults have significance in the studied area and can be related with mineralization (Fig. 2). 3. Materials and Methods 3.1. Multispectral Characteristics of Hydrothermal Alteration by ASTER Data Multispectral data from the ASTER are acquired in 14 channels from the visible to the thermal infrared (TIR) regions of the electromagnetic spectrum. ASTER comprises three separate instrument subsystems [28]; the 38
Ahmadfaraj et al. / Int. J. Min. & Geo-Eng., Vol.50, No.1, June 2016
first sensor images data in the first three channels between 0.52 and 0.86 micrometer (green, red, and near-infrared), the second sensor images data in the next six channels between 1.6 and 2.430 micrometer in the shortwave IR (SWIR) region, and the third sensor images data in the next five channels between 8.125 and 11.65 micrometer (TIR). Several workers have used ASTER data for geological purposes in recent years [29-32]. The ASTER level-1B (radiance at sensor) data were used in this study produced by the Land Processes Distributed Active Archive Center at NASA. The level 1B data comprises level 1A data, the reconstructed unprocessed raw instrument data that has been geometrically and radiometrically corrected and converted to radiance at the sensor using the radiometric coefficients of the detectors. These data require conversion to surface reflectance before they can be used to match or classify pixels spectrally to any reference spectrum.
3.2. Principal Component Analysis (PCA) Different image-processing techniques can be applied on ASTER data, such as PCA [18, 31, 33- 35]. PCA is a widely used method for alteration mapping in metallogenic belts [18, 31, 34, 45]. The PCA can be practical to multivariate data, such as multispectral remote sensing images, with the aim of extracting specific spectral responses as in the case of hydrothermal alteration minerals [35]. If the number of input channels is reduced to elude a specific spectral contrast, the chances of defining a unique Principal Component (PC) for a particular mineral class will be increased [36]. Chavez and Kwarteng (1989) introduced a specific kind of PCA in which only two bands are used as input to PCA [37]. The PCA can be used to enhance and map the spectral differences or contrast between different spectral regions. When only two bands are used as input to PCA, the spectral contrast is mapped into the second component. The result of PCA processing is easier for visual interpretation.
Fig. 1. Location of study area in Urumieh–Dokhtar magmatic belt modified based on [44]
39
Fig. 2. Geological map of SW part of Saveh area [27], and Cu mineralizations represented by stars (vein and impregnation 1 types). Map projection: NUTM, WGS84
Ahmadfaraj et al. / Int. J. Min. & Geo-Eng., Vol.50, No.1, June 2016
1. Impregnation-type mineralization is characterized by initially hypogenic disseminations and micro-veinlets of Cu sulfide minerals in andesitic rocks, which are replaced by oxide and carbonate minerals, such as cuprite, malachite and azurite, due to supergene weathering and enrichment processes. This type of mineralization is controlled by faults in andesitic rocks and is not temporally and spatially related to intrusive rocks. Impregnation-type mineralization can be considered as Manto-type Cu mineralization in Chilean Andes.
40
Ahmadfaraj et al. / Int. J. Min. & Geo-Eng., Vol.50, No.1, June 2016
In this study, those bands that contain the most representative common spectral features of the alteration minerals in the Saveh area were selected as input bands to PCA. As the main alteration zone in the studied area is argillic, the SWIR region of the ASTER data are used for argillic mapping. The TM visible and near-infrared (VNIR) and short-wave infrared (SWIR) bands can only discriminate areas rich in iron oxides/hydroxides and clay
minerals, respectively. Most hydrothermal alteration minerals have absorption features in the SWIR region of the electromagnetic spectrum, multispectral SWIR data are commonly used for hydrothermal alteration mapping. The ASTER SWIR bands are positioned to define absorption features of popular minerals that are typically formed by hydrothermal alteration processes (Fig. 3).
Fig. 3. Reflectance spectra of common hydrothermal minerals obtained from the USGS spectral library [43]. The ASTER bandwidths are shown and the spectra are resampled according to ASTER SWIR bandwidths.
The hydrothermal zones are characterized by mineral assemblages including at least one mineral that exhibits diagnostic spectral absorption features [38]. Phyllic zone is typically characterized by illite/muscovite (sericite) and quartz. Muscovite and illite exhibit an intense Al–OH spectral absorption feature typically centered at 2.20 µm (band 6) and a less intense feature near 2.38 µm (band 8) [38]. Argillic zone typically contains kaolinite, alunite, and montmorillonite. The montmorillonite displays an Al–OH absorption feature near 2.20 µm [39, 40]. Kaolinite displays an Al–OH doublet with the primary absorption feature centered at 2.2 µm (band 6) and a secondary feature at 2.17 µm (ASTER band 5). In the propylitic zone, mineral assemblage reflectance spectra are usually characterized by Fe, Mg–OH, and CO absorption features due to molecular vibrations in epidote, chlorite, and carbonate minerals. These absorption features are situated in the 2.33–2.35 µm (band 8) [30, 38]. The clays, sericite, chlorite, epidote, and calcite show high reflectance in band 4 of ASTER data.
3.3. Application of the C-A fractal model for ASTER image interpretation The C–A fractal model was proposed by [10] for separating geochemical anomalous areas from background. The model is related not only to the separation of geochemical anomalies but also has found obvious capabilities for image classification [6, 18, 19, 41, 42]. A multispectral image is composed of an array of pixels. Each pixel is marked by a value (PV). The C–A fractal model can be used to provide visual representation of the differences in an image based on pixel values and its frequency distribution as well as spatial and geometrical properties of image patterns [6]. The purpose is to establish power–law relationships between area (A: number of pixels with PV values above a certain threshold multiplied by pixel area) and threshold PV values. This power–law relationship can be expressed as: A PV s PV
where A(PV) denotes the area occupied by pixels with the PV values greater than a 41
Ahmadfaraj et al. / Int. J. Min. & Geo-Eng., Vol.50, No.1, June 2016
certain threshold s, and the exponent α is fractal dimension [6, 10]. A log–log plot of A(PV) against PV can result in a multifractal form consisting of a series of straight lines or segments. Each segment is indicator of a population (e.g., hydrothermal alteration type) which is self-similar or self-affine for certain intervals of PV values. Every segment has upper and lower threshold values which are used for image classification. The cutoff values were calculated based on break points between the fitted segments. In this paper, we recourse to the C–A fractal model as the PV–A fractal model to
help readers focus more on its application to segmentation of satellite images. It is worth mentioning that all principles of the C–A fractal model have been considered and followed in this research. PC3 (Table 1), PC3 (Table 2), and PC3 (Table 3) can show phyllic, argillic, and propylitic alteration zones in the Saveh ASTER image, respectively. The PCA matrix for phyllic, argillic, and propylitic alteration zones are shown in Tables 1-3. The PCs were selected based on highest value for absolute of difference between reflection and absorption in index minerals of alteration zones.
Table 1. Eigenvector statistics for ASTER bands 5, 6, 7, and 8. This band set was selected for identifying spectral response from phyllic alteration, in PC3.
Eigenvector PC1 PC2 PC3 PC4
Band 5 0.496812 0.372755 -0.293393 0.726741
Band 6 0.508279 0.536977 0.537031 -0.406086
Band 7 0.49754 -0.188152 -0.672189 -0.51499
Band 8 0.497276 -0.733013 0.41675 0.204272
Table 2. Eigenvector statistics for ASTER bands 4, 5, 6 and, 7. This band set was selected for identifying spectral response from argillic alteration, in PC3.
Eigenvector PC1 PC2 PC3 PC4
Band 4 0.521407 0.833459 -0.180301 -0.031179
Band 5 0.489094 -0.260958 0.339494 -0.759889
Band 6 0.501307 -0.167562 0.56569 0.632937
Band 7 0.487456 -0.45735 -0.729541 0.144872
Table 3. Eigenvector statistics for ASTER bands 4, 5, 6 and, 8. This band set was selected for identifying spectral response from propylitic alteration, in PC3.
Eigenvector PC1 PC2 PC3 PC4
Band 4 -0.52024 -0.761907 0.385474 -0.016042
Band 5 -0.490007 0.127269 -0.440617 -0.741318
Band 6 -0.501946 0.051123 -0.548641 0.666656
Band 8 -0.487128 0.632998 0.596875 0.075897
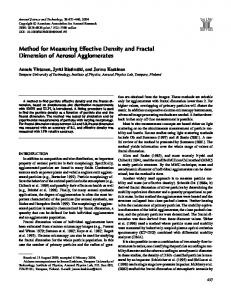
Fig. 4. Log-log graph of area versus pixel value in the studied area, C-A diagram for phyllic, argillic and propylitic alteration zones
42
Ahmadfaraj et al. / Int. J. Min. & Geo-Eng., Vol.50, No.1, June 2016
Based on the pixel values, C-A log-log plots were generated and, accordingly, the different populations were separated as shown in Figure 4. According to the log-log plot, there are four populations (three thresholds) for phyllic, argillic, and propylitic (Fig. 4). Straight lines fitted to the points on the log-log plots show a power-law relationship between the area and cutoff pixel value (thresholds values) in a specific range. Additionally, the parameters (PC values for all alteration zones) have a multifractal nature in this area. High-intensity phyllic alteration parts have pixel values higher than 191. Middle intensity phyllic alteration parts have pixel values between 124 and 191, and also a low value of the alteration was detected with pixel values between 74 and 124. Phyllic alteration parts have background pixel values less than 74
(Table 4 and Fig. 5). However, the negative data were multiple to -1 and image enhancement for the phyllic alteration. High-intensity argillic alteration parts have pixel values higher than 174. Argillic alteration parts with middle intensity have pixel values between 115 and 174, and also a low value of the alteration was detected with pixel values between 68 and 115. Argillic alteration parts have background pixel values less than 68 (Table 5 and Fig. 6). High-intensity propylitic alteration parts have pixel values higher than 170. Middle intensity propylitic alteration parts have pixel values between 126 and 170, and also a low value of the alteration was detected with pixel values between 79 and 126. Propylitic alteration parts have background pixel values less than 79 (Table 6 and Fig. 7).
Table 4. The result of PC value of the C-A fractal method for phyllic alteration zones
Alteration Zone Phyllic
Background 0-74
Low intensity 74-124
Midddle intensity 124-191
High intensity 191-255
Fig. 5. A) Phyllic alteration population distribution map based on the C-A model, B) phyllic alteration high intensity distribution map on the C-A model Table 5. The result of PC value of the C-A fractal method for argillic alteration zones.
Alteration Zone Argillic
Background 0-68
Low intensity 68-115
43
Midddle intensity 115-174
High intensity 174-255
Ahmadfaraj et al. / Int. J. Min. & Geo-Eng., Vol.50, No.1, June 2016
Fig. 6. A) Argillic alteration population distribution map based on the C-A model, B) argillic alteration high intensity distribution map on the C-A model
Table 6. The result of PC value of the C-A fractal method for propylitic alteration zones
Alteration Zone Propylitic
Background 0-79
Low intensity 79-126
Midddle intensity 126-170
High intensity 170-255
Fig. 7. A) Propylitic alteration population distribution map based on the C-A model, B) propylitic alteration high intensity distribution map on the C-A model
44
Ahmadfaraj et al. / Int. J. Min. & Geo-Eng., Vol.50, No.1, June 2016
argillic and phyllic alterations within marginal propylitic alteration zones. Furthermore, the alteration zones occurred real to the main faults and their intersections. Moreover, the shallow intrusive bodies were situated with alteration zones.
4. Correlation between C-A results and geological features Results derived via the C-A model correlated with the geological particulars obtained by geological map of the Saveh, 1:250,000 sheet, and field observations. Phyllic and argillic alterations clearly exist in the NW and central parts of the area (Figs. 8 and 9). The propylitic alteration happened in the central and SW parts of the area (Figs. 8 and 9), correlating with the results obtained by the C-A fractal model in the Saveh area since phyllic, argillic, and propylitic alteration are clearly present in the central, NW, and SE of the area; also, kaolinite, muscovite, and chlorite-epidote as the main index of argillic, phyllic, and propylitic alteration engross the NW, central, and SW parts of the Saveh, 1:250,000 sheet, respectively. According to the results and observations, there are prospects for hydrothermal mineralization in the central, NW, and SE parts of the Saveh area. There are several copper mineralizations which are correlated to
5. Conclusion The results of this study on the SW part of the Saveh, 1:250,000 sheet, reveals capability of the C–A fractal model for extracting useful information from remote sensing data. Consequently, the combination between fractal modeling and PCA method could be used for classification of different parts of alteration zones for better prospecting of ore deposits. In this study, various parts of alteration zones were separated due to intensity of these alteration zones. As a result, combination of the PCA and C–A technique can be effectively applied in image processing of suitable multispectral input bands for discovery and mapping of hydrothermal alteration zones.
Fig. 8. (A-C are a). phyllic, argillic, and propylitic alteration population distribution maps based on the C-A fractal model and Cu mineralization represented by stars
45
Ahmadfaraj et al. / Int. J. Min. & Geo-Eng., Vol.50, No.1, June 2016
Fig. 9. Correlation between iron oxide, phyllic, argillic and propylitic alterations in the field observation based on results derived via the fractal modeling as depicted in Fig. 8
Identifying areas of high economic-potential copper mineralization using ASTER data in the Urumieh-Dokhtar Volcanic Belt, Iran. Advances in Space Research, 49(4), 753–769. http://doi.org/10.1016/j.asr.2011.11.028
The advantages of this model are simplicity and easy computational implementation as well as the possibility to compute a numerical value of concentrations which is the most useful criterion for cross-examination of information with numerical data from different sources, which can be hugely used in geology, geophysics, geochemical, and remote sensing. There is a positive correlation among the alteration derived via the C-A model, with major faults, intrusive rocks, copper mineralization, and field observations in the SW part of Saveh, 1:250,000 sheet. New prospects of hydrothermal mineralization and deposits can be defined in the central, NW, and SE parts of the SW part Saveh, 1:250,000 sheet.
[3] Beiranvandpour, A., & Hashim, M. (2012b). The application of ASTER remote sensing data to porphyry copper and epithermal gold deposits. Ore Geology Reviews, 44, 1–9. http://doi.org/10.1016/j.oregeorev.2011.09.009 [4] Zoheir, B., & Emam, A. (2012). Integrating geologic and satellite imagery data for highresolution mapping and gold exploration targets in the South Eastern Desert, Egypt. Journal of African Earth Sciences, 66-67, 22–34. http://doi.org/10.1016/j.jafrearsci.2012.02.007 [5] Amer, R., Kusky, T., & El Mezayen, A. (2012). Remote sensing detection of gold related alteration zones in Um Rus area, Central Eastern Desert of Egypt. Advances in Space Research, 49(1), 121–134. http://doi.org/10.1016/j.asr. 2011.09.024
Acknowledgement The authors acknowledge comments, critical and thoughtful reviews of the anonymous reviewers which have greatly enhanced the quality of the manuscript. The authors wish to acknowledge Mr. E. Farahbakhsh for his exemplary guidance and valuable feedback throughout the manuscript. We would also like to thank Prof. F. Doulati for editorial handling of the manuscript.
[6] Cheng, Q., & Li, Q. (2002). A fractal concentration-area method for assigning a color palette for image representation. Computers and Geosciences, 28(4), 567–575. http://doi.org/10.1016/S0098-3004(01)00060-7
References
[7] Liu, J.-G., & Mason, P. J. (2009). Essential Image Processing and GIS for remote sensing.
[1] Beiranvndpour, A., & Hashim, M. (2011). Identification of hydrothermal alteration minerals for exploring of porphyry copper deposit using ASTER data, SE Iran. Journal of Asian Earth Sciences, 42(6), 1309–1323. http://doi.org/10.1016/j.jseaes.2011.07.017
[8] Mandelbrot, B. B. (1982). The fractal geometry of nature. New York: Freeman. [9] Mandelbrot, B. B. (1983). The fractal geometry of nature (updated and augmented). New York: Freeman.
[2] Beiranvandpour, A., & Hashim, M. (2012a).
46
Ahmadfaraj et al. / Int. J. Min. & Geo-Eng., Vol.50, No.1, June 2016
[10] Cheng, Q., Agterberg, F. P., & Ballantyne, S. B. (1994). The separation of geochemical anomalies from background by fractal methods. Journal of Geochemical Exploration, 51(2), 109–130. http://doi.org/10.1016/0375-6742(94)90013-2
Concentration–Area Fractal Model. Natural Resources Research, 22(3), 191–206. http://doi.org/10.1007/s11053-013-9211-y [19] Aramesh Asl, R., Afzal, P., Adib, A., & Yasrebi, A. B. (2014). Application of multifractal modeling for the identification of alteration zones and major faults based on ETM+ multispectral data. Arabian Journal of Geosciences, 8(5), 2997–3006. http://doi.org/10.1007/s12517-014-1366-2
[11] Zuo, R., Cheng, Q., & Xia, Q. (2009). Application of fractal models to characterization of vertical distribution of geochemical element concentration. Journal of Geochemical Exploration, 102(1), 37–43. http://doi.org/10.1016/j.gexplo.2008.11.020
[20] Berberian, F., Muir, I. D., Pankhurst, R. J., & Berberian, M. (1982). Late Cretaceous and early Miocene Andean-type plutonic activity in northern Makran and Central Iran. Journal of the Geological Society, 139(5), 605–614. http://doi.org/10.1144/gsjgs.139.5.0605
[12] Afzal, P., Alghalandis, Y. F., Khakzad, A., Moarefvand, P., & Omran, N. R. (2011). Delineation of mineralization zones in porphyry Cu deposits by fractal concentration–volume modeling. Journal of Geochemical Exploration, 108(3), 220–232. http://doi.org/10.1016/j.gexplo.2011.03.005
[21] Mobasher, K., & Babaie, H. A. (2008). Kinematic significance of fold- and fault-related fracture systems in the Zagros mountains, southern Iran. Tectonophysics, 451(1-4), 156– 169. http://doi.org/10.1016/j.tecto.2007.11.060
[13] Afzal, P., Alghalandis, Y. F., Moarefvand, P., Omran, N. R., & Haroni, H. A. (2012). Application of power-spectrum–volume fractal method for detecting hypogene, supergene enrichment, leached and barren zones in Kahang Cu porphyry deposit, Central Iran. Journal of Geochemical Exploration, 112, 131–138. http://doi.org/10.1016/j.gexplo.2011.08.002
[22] Berberian, M., & King, G. C. P. (1981). Towards a paleogeography and tectonic evolution of Iran: Reply. Canadian Journal of Earth Sciences, 18(11), 1764–1766. http://doi.org/10.1139/e81-163 [23] Shahabpour, J. (1994). Post-mineralization breccia dike from the Sar Cheshmeh porphyry copper deposit, Kerman, Iran. Exploration and Mining Geology, 3(1). Retrieved from http://emg.geoscienceworld.org/cgi/content/lon g/3/1/39
[14] Afzal, P., Khakzad, A., Moarefvand, P., Omran, N. R., Esfandiari, B., & Alghalandis, Y. F. (2010). Geochemical anomaly separation by multifractal modeling in Kahang (Gor Gor) porphyry system, Central Iran. Journal of Geochemical Exploration, 104(1-2), 34–46. http://doi.org/10.1016/j.gexplo.2009.11.003
[24] Dargahi, S., Arvin, M., Pan, Y., & Babaei, A. (2010). Petrogenesis of post-collisional Atype granitoids from the Urumieh–Dokhtar magmatic assemblage, Southwestern Kerman, Iran: Constraints on the Arabian–Eurasian continental collision. Lithos, 115(1-4), 190– 204. http://doi.org/10.1016/j.lithos.2009.12.002
[15] Agterberg, F. P., Cheng, Q., Brown, a., & Good, D. (1996). Multifractal modeling of fractures in the Lac du Bonnet Batholith, Manitoba. Computers and Geosciences, 22(5), 497–507. http://doi.org/10.1016/0098-3004(95)00117-4 [16] Sim, B. L., Agterberg, F. P., & Beaudry, C. (1999). Determining the cutoff between background and relative base metal smelter contamination levels using multifractal methods. Computers and Geosciences, 25, 1023–1041. http://doi.org/10.1016/S0098-3004(99)00064-3
[25] Arvin, M., Pan, Y., Dargahi, S., Malekizadeh, A., & Babaei, A. (2007). Petrochemistry of the SiahKuh granitoid stock southwest of Kerman, Iran: Implications for initiation of Neotethys subduction. Journal of Asian Earth Sciences, 30(3-4), 474–489. http://doi.org/10.1016/j.jseaes.2007.01.001
[17] Hassanpour, S., & Afzal, P. (2013). Application of concentration–number (C–N) multifractal modeling for geochemical anomaly separation in Haftcheshmeh porphyry system, NW Iran. Arabian Journal of Geosciences, 6(3), 957–970. http://doi.org/10.1007/s12517-0110396-2.
[26] Omrani, J., Agard, P., Whitechurch, H., Benoit, M., Prouteau, G., & Jolivet, L. (2008). Arc-magmatism and subduction history beneath the Zagros Mountains, Iran: A new report of adakites and geodynamic consequences. Lithos, 106(3-4), 380–398. http://doi.org/10.1016/j.lithos.2008.09.008
[18] Shahriari, H., Ranjbar, H., & Honarmand, M. (2013). Image Segmentation for Hydrothermal Alteration Mapping Using PCA and
[27] Caillat, C., Dehlavi, P., Jantin, B.-M., Nogol Sadat, A., Hushmandzadeh, A., Behruzi, A., Lotfi, M., Nazer, N. K., and Mahdavi, M.
47
Ahmadfaraj et al. / Int. J. Min. & Geo-Eng., Vol.50, No.1, June 2016
(1984). Geological map of Saveh 1:250,000 sheet. Geological Survey of Iran, Tehran.
[36] Loughlin, W. P. (1991). Principal Component Analysis for mineral alteration mapping. Photogrammetric Engineering and Remote Sensing, (April 1985).
[28] Abrams, M., & Hook, S. (2002). ASTER User Handbook Version 2. Jet Propulsion Laboratory, 135. Retrieved from Abrams2002NASA.pdf
[37] Chavez P.S, J., & Kwarteng, A. Y. (1989). Extracting spectral contrast in Landsat Thematic Mapper image data using selective principal component analysis. Photogrammetric Engineering and Remote Sensing, 55(3), 339–348. Retrieved from https://pubs.er.usgs.gov/publication/70015931
[29] Rowan, L. C., & Mars, J. C. (2003). Lithologic mapping in the Mountain Pass, California area using Advanced Spaceborne Thermal Emission and Reflection Radiometer (ASTER) data. Remote Sensing of Environment, 84, 350–366. http://doi.org/10.1016/S0034-4257(02)00127-X
[38] Mars, J. C., & Rowan, L. C. (2006). Regional mapping of phyllic- and argillic-altered rocks in the Zagros magmatic arc, Iran, using Advanced Spaceborne Thermal Emission and Refl ection Radiometer (ASTER) data and logical operator algorithms. Geosphere, 2(3), 161. http://doi.org/10.1130/GES00044.1
[30] Rowan, L. C., Schmidt, R. G., & Mars, J. C. (2006). Distribution of hydrothermally altered rocks in the Reko Diq, Pakistan mineralized area based on spectral analysis of ASTER data. Remote Sensing of Environment, 104(1), 74– 87. http://doi.org/10.1016/j.rse.2006.05.014 [31] Moore, F., Rastmanesh, F., Asadi, H., & Modabberi, S. (2008). Mapping mineralogical alteration using principal-component analysis and matched filter processing in the Takab area, northwest Iran, from ASTER data. International Journal of Remote Sensing, 29(10), 2851–2867. http://doi.org/10.1080/01431160701418989
[39] Hunt, G. R. (1977). Spectral signatures of particulate minerals in the visible and near infrared. Geophysics, 42(3), 501–513. http://doi.org/10.1190/1.1440721 [40] Hunt, G. R., & Ashley, R. P. (1979). Spectra of altered rocks in the visible and near infrared. Economic Geology, 74, 1613–1629. http://doi.org/10.2113/gsecongeo.74.7.1613
[32]Tangestani, M. H., Mazhari, N., Agar, B., & Moore, F. (2008). Evaluating Advanced Spaceborne Thermal Emission and Reflection Radiometer (ASTER) data for alteration zone enhancement in a semi‐arid area, northern Shahr‐e‐Babak, SE Iran. International Journal of Remote Sensing, 29(10), 2833–2850. http://doi.org/10.1080/01431160701422239
[41] Cheng, Q. (1999). Spatial and scaling modelling for geochemical anomaly separation. Journal of Geochemical Exploration, 65(3), 175–194. http://doi.org/10.1016/S0375-6742(99)00028-X [42] Cheng, Q., Xu, Y., & Grunsky, E. (2000). Integrated spatial and spectrum method for geochemical anomaly separation. Natural Resources Research, 9(1), 43–52. Retrieved from http://springerlink.metapress.com/openurl.asp?gen re=article&id=doi:10.1023/A:1010109829861
[33] Carranza, E. J. M., van Ruitenbeek, F. J. a., Hecker, C., van der Meijde, M., & van der Meer, F. D. (2008). Knowledge-guided datadriven evidential belief modeling of mineral prospectivity in Cabo de Gata, SE Spain. International Journal of Applied Earth Observation and Geoinformation, 10(3), 374– 387. http://doi.org/10.1016/j.jag.2008.02.008
[43]Clark, R. N., Swayze, G. A., Gallagher, A. J., King, T. V. V., & Calvin, W. M. (1993). The U. S. Geological Survey, Digital Spectral Library, 1, 0.2 to 3.0 micrometers. U.S. Geological Survey Open File Report 93-592.
[34] Honarmand, M., Ranjbar, H., & Shahabpour, J. (2012). Application of Principal Component Analysis and Spectral Angle Mapper in the Mapping of Hydrothermal Alteration in the JebalBarez Area, Southeastern Iran. Resource Geology, 62(2), 119–139. http://doi.org/10.1111/j.17513928.2012.00184.x
[44] Alavi, M. (1994). Tectonics of the zagros orogenic belt of iran: new data and interpretations. Tectonophysics, 229(3-4), 211–238. [45] Farahbakhsh, E., Shirmard, H., Bahroudi, A., & Eslamkish, T. (2015). Fusing ASTER and QuickBird-2 Satellite Data for Detailed Investigation of Porphyry Copper Deposits Using PCA; Case Study of Naysian Deposit, Iran. Journal of the Indian Society of Remote Sensing. http://doi.org/10.1007/s12524-015-0516-7
[35] Crósta, a. P., De Souza Filho, C. R., Azevedo, F., & Brodie, C. (2003). Targeting key alteration minerals in epithermal deposits in Patagonia, Argentina, using ASTER imagery and principal component analysis. International Journal of Remote Sensing, 24(21), 4233–4240. http://doi.org/10.1080/0143116031000152291
48