the way commissioned and non-commissioned officers are taught the Risk Management process and how it can affect their perceptions of risk and suggests that ...
International Journal of Computer Applications (0975 – 8887) Volume 1113– No.6, March 2015
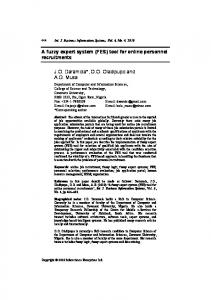
Application of Fuzzy Expert Systems in Assessing Risk Management in the US Army Charles Karels
Heath McCormick
Rania Hodhod
Columbus State University 4225 University Avenue Columbus, GA, 31907
Columbus State University 4225 University Avenue Columbus, GA, 31907
Columbus State University 4225 University Avenue Columbus, GA, 31907
Karels_charles@columbu sstate.edu
Mccormick_heath@colum busstate.edu
Hodhod_rania@columbus state.edu
ABSTRACT A risk management process is most effective when the users are properly educated on the process and the process itself promotes a uniform perception of risk. Every soldier in the US Army is expected to be capable of managing risk— eliminating it when possible or mitigating it to an acceptable level through the principles and application a formal, multistep, iterative process known as the US Army Risk Management program. This paper describes a study in which the researchers developed and used a fuzzy rule based expert system to evaluate a respondent population’s ability to assess risk using the US Army’s Risk Management program, and to determine if there were any common characteristics amongst those respondents with similar output. The results showed that while some factors such as active duty versus reserve status yielded negligible differences, there existed a significant difference between the way the commissioned and noncommissioned officer participants perceived risk. This information is one key to understanding that the differences in the way commissioned and non-commissioned officers are taught the Risk Management process and how it can affect their perceptions of risk and suggests that a better, more uniform method of risk training could be developed for the training audiences.
fundamental question which underlies the RM process: “What factors lead different individuals, presented with the same situation, to perceive hazards differently”? The Army describes RM as the process for helping organizations and individuals make informed decisions to reduce or offset risk [1]. The current model is based on four underlying principles: Integrate RM into all phases of missions and operations, Make risk decisions at the appropriate level, Accept no unnecessary risk, and Apply RM cyclically and continuously. These four principles drive the cyclical and continuous five step model as illustrated in Figure 1 below. Although each of these steps plays an important role in the process, for the purposes of this study, the scope of research is limited to the second step of the Army’s RM process, Assess the Hazards.
General Terms Expert Systems, Fuzzy Systems, Data Classification
Keywords Fuzzy Expert Management
Systems,
Hazard
Identification,
Risk
1. INTRODUCTION In 1998 the U.S. Army introduced the first doctrinal publication on managing risk, the now obsolete Field Manual 100-14, in recognition of the need to standardize a methodology for identifying, quantifying, and mitigating the risks associated with training and combat activities [1]. Though the specifics and scope of this process have changed over the intervening years, the overarching goal of this process, now known as Risk Management (RM), is still to manage the inherent risk as well as eliminate all unnecessary risk in all Army activities. RM is a five-step process which consists of identifying the hazards, assessing those hazards, developing controls and making risk decisions, implementing controls, and supervising and evaluating throughout the execution of the event. While the Army has done much to improve this process with a goal toward making it more standardized, it has not significantly addressed one
Fig. 1: The Army Risk Management Process [1] Although different systems are in use for RM, such as those used in the financial and energy sectors, none have been developed to evaluate and assess RM in the Army. The lack of a formal evaluation tool for either the process or the individuals conducting the process does not allow for direct comparison of how risk management between individuals or units. Expert systems are a good choice for these types of evaluations because they allow for comparison to either a selected expert case or to each other to determine similarities or differences in the conduct of RM. Expert systems can be seen as a good tool to provide useful information to trainers on not only how their trainees are doing but also why. For this
International Journal of Computer Applications (0975 – 8887) Volume 1113– No.6, March 2015 purpose we introduce a fuzzy expert system that compares responses of a group of Army leaders to a scenario. These responses are then evaluated to determine similarities in responses based on biographical characteristics for possible use as feedback into the Army’s RM training process. This paper first discusses RM and its conduct in the Army. Next is a description of the expert system, its development, and the results of the research. The paper follows with an evaluation of related research and then discussion of the current work.
2. RISK MANAGEMENT Risk assessment and evaluation is a complex and multifaceted task. In the Army risk is assessed in respect to both risk to people and equipment, as well as risk to mission accomplishment. In the following, each step of the Army’s RM process is explained: Step 1 – Identify the Hazards: A hazard is identified as “a condition with the potential to cause injury, illness, or death of personnel; damage to or loss of equipment or property; or mission degradation” [1]. The goal of Step 1 is to first identify all of the hazards that exist in the operation in order to effectively assess them in the next step. Step 2 – Assess the Hazards: This step focuses on quantifying the likelihood and severity of the hazards identified in Step 1. In this step the level of “initial risk” is determined for each hazard. [1] states that “Technical competency, operational experience, and lessons-learned weigh higher than any set of alpha-numeric codes. Mathematics and matrixes are not a substitute for sound judgment”. As mentioned previously, this step in the process provides the basis for this research. Step 3 – Develop Controls and Make Risk Decisions: This consists of developing a control for each identified hazard that includes information on what, when, where, why, and how the control measure will be implemented, and who will supervise it. Residual risk is determined based on the risk remaining for a hazard after the control measure has been implemented. The overall level of risk is then determined. According to doctrine, this overall risk value must be at least as high as the highest remaining level of risk. Risk decisions are made at this point in the process. The level of decision making authority is based on the level of overall risk that is determined. The decision making authority may approve, disapprove, or return the document for further evaluation.
to mitigate the most likely and dangerous hazards presented by that training. Failure to do so presents a major risk to the force as well as potential mission failure. The following section presents the design of the fuzzy expert system developed to identify trends in the trainees’ behavior and assist the trainers adapt their training sessions accordingly.
3. A FUZZY EXPERT SYSTEM TO EVALUATE RISK MANAGEMENT The researchers developed a set of 324 rules designed to reflect a wide variety of risk conditions associated with a range of possible hazard frequencies and impacts derived from multiple planning considerations as they related to a detailed training scenario. These rules were developed utilizing the levels of risk described in the Army RM process, Low, Moderate, High, and Extremely High. The rules are representative of the Army Risk Assessment Matrix shown in Table 1. Each rule was calculated to reflect the risk level presented according to current Army regulations, doctrine, and policies. Table 1. Army Risk Assessment Matrix Probability
Severity Catastrophic
Frequent
Likely
Occasional
Seldom
Unlikely
A
B
C
D
E
Extremely
Moderate
High High
Critical
Moderate
High
Negligible
Moderate
Moderate
Moderate
The rules were implemented in a MATLAB-based fuzzy system using the Centroid method to find membership values and Mamdani-style defuzzification. The fuzzy inference system is discussed in further detail in the next subsections.
Step 4 – Implement Controls: The control measures identified in the previous steps are integrated into the plan for the operation and are implemented by the appropriate individual or group to ensure that they are effective and remain in place. Step 5 – Supervise and Evaluate: During this step the controls are evaluated to determine their effectiveness at mitigating the hazards that were identified. This step also includes a feedback loop to input improvements and refinements to the process for further use. The scope of this research is intentionally focused on the second step in recognition of the necessity for all users to have a solid grasp of assessing the likelihood and impacts of any hazards present in a given situation. A leader cannot conduct training in the safest possible manner if he or she fails
Low
Fig. 2: System architecture
International Journal of Computer Applications (0975 – 8887) Volume 1113– No.6, March 2015
3.1 Fuzzy Expert System Design The scenario required the respondents to align two doctrinal Army processes, the Military Decision Making Process (MDMP) and the RM, and “crosswalk” the two in order to determine risk level as shown in Table 2. Table 2. MDMP and RM Task Crosswalk [1]
The rules focus on five primary planning considerations used when preparing for a tactical footmarch as prescribed in the Fragmentary Order (FRAGO) or set of instructions provided to the platoon leadership (the role played by each respondent) at the outset of the notional event; The first of these major areas of consideration was the available preparatory time for mission planning as it related to both time and leadership personnel available to conduct a mission analysis prior to the event. The second planning factor considered was the tactical degree of the event itself. Since this was a tactical footmarch, leaders were required to consider any elevated physical risk to the participants posed by the level of stealth and movement control required to successfully execute the assigned mission. The third consideration was the risk presented by terrain in the area of operations, including any movement challenges posed by difficult elevation changes, vegetation, or surface conditions along the route prescribed to the platoon. Physical risk as presented by outside entities like vehicular traffic along that route was also a consideration. The fourth planning consideration was soldier endurance as it related to the aggregate experience of the platoon in the given climate conditions and the aggregate experience of the platoon in executing a similar training event. The fifth and final planning consideration pertained to the risk posed by the ambient temperature range and humidity level as predicted in the FRAGO throughout the length of the footmarch and the duration of time those soldiers would be exposed to those conditions while conducting the training. The five areas of consideration discussed above were categorized and then assigned numerical values based on a range of -0.5 to 9.5. External inputs into the process consisted of the results of the respondents’ completed RM worksheet based on the scenario provided, as well as biographical data collected from the respondents for subsequent use in the datamining process. Respondents combined Army doctrine, policies, and their experience to identify risks associated with the provided scenario and judged the likelihood and severity of those risks occurring to determine individual and, subsequently, aggregate initial risk level. This project focused on collecting
and analyzing the initial risk level as assessed by the respondents. This was based on the concept that initial risk assessment is often a result of training received by an individual, while residual (or post-mitigative) risk is often assessed by an individual based off of their experience and practical knowledge. Individual responses of Low, Moderate, High, and Extremely High were represented by numerical values of 1.05, 3.95, 6.6, and 8.7 respectively, based on the center score of each risk category on a -0.5 to 9.5 scale. Those planning factors that received multiple scores in a single respondent’s RM worksheet were weighted with a graduated system of adding a cumulative 0.1 score to each occurrence to account for the increased level of recognition by that respondent. Those planning factors that were not addressed in an individual respondent’s input were represented with a mean of the other planning factors addressed by that respondent. These scores were then totaled and applied to a scale that resulted in an individual Risk Level ranking of Low, Moderate, High, or Extremely High. These ranges assigned to each of the Risk Level rankings mirrored the doctrinal proportion of each ranking as prescribed in the Risk Assessment Matrix.
4. FUZZY EXPERT SYSTEM DEVELOPMENT 4.1 Input Variables and Fuzzy Sets The first input variable is Preparatory Time which represents the level of planning guidance and planning time available to the organizational leadership prior to the training event as well as the use of internal unit operating procedures and control measures. It was inclusive in the range of -0.05 to 9.5. The parameters were OPTIMUM (-0.5, 1.75, 2.25, 4.5), ADEQUATE (2, 4.5, 4.75, 7), and MINIMAL (4.5, 6.75, 7.25, 9.5). A membership function plot illustrative of those used for each input variable is depicted below in Figure 3.
Fig. 3: Membership function for “Preparatory time” The second input variable is Event which represents the operational conditions (i.e. tactical, low visibility, administrative, etc) under which the training event was executed. It was inclusive in the range of -.05 to 9.5. The parameters were NON-TACTICAL (-0.5, 1.75, 2.25, 4.5)
International Journal of Computer Applications (0975 – 8887) Volume 1113– No.6, March 2015 DAY TACTICAL (2, 4.5, 4.75, 7), and NIGHT TACTICAL (4.5, 6.75, 7.25, 9.5). The third input variable is Trafficability which represents the geographical and terrain conditions experienced by the platoon throughout the duration of the training event as well as those potential risks posed by vehicular traffic. It was inclusive in the range of -.05 to 9.5. The parameters were OPTIMUM (-0.5, 1.75, 2.25, 4.5), ADEQUATE (2, 4.5, 4.75, 7), and MINIMAL (4.5, 6.75, 7.25, 9.5). The fourth input variable is Exposure Duration which represents the climatic conditions and length of time that the platoon members were exposed to them during the training event. It was inclusive in the range of -0.05 to 9.5. The parameters were < 8 HOURS (-1.75, 1.583, 2.417, 5.75), 8-24 HOURS (-0.1167, 2.95, 3.783, 7.383), 24-72 HOURS (1.503, 4.167, 4.893, 8.037) and OVER 72 HOURS (3.166, 5.834, 6.5, 9.167). The fifth and final input variable is Soldier Preparation that represents the level of physical acclimatization and collective experience level of the platoon members to the assigned task. It was inclusive in the range of -.05 to 9.5. The parameters were OPTIMUM (-0.5, 1.75, 2.25, 4.5), ADEQUATE (2, 4.5, 4.75, 7), and MINIMAL (4.5, 6.75, 7.25, 9.5).
4.2 Output Variable The system used a Mamdami style fuzzy inferencing system in order to map the input values to a set of membership values which are then evaluated based on the on the natural language rules previously developed. The output variable was Risk Level. It represented the aggregate initial risk level as assessed by the respondent. It was inclusive in the range of .05 to 9.5. The parameters were LOW (-3.5, -0.833, 1.433, 3.1), MODERATE (2.1, 3.698, 4.39, 5.8), HIGH (4.8, 6.26, 6.974, 8.4) and EXTREMELY HIGH (6.99, 8.606, 9.9, 10). The membership function plot is depicted in Figure 4. .
Fig. 4: Membership function for “Risk level”
5. EVALUATION The goal of the research was to use the developed fuzzy rule based expert system to determine if there are characteristics common within the respondent population that could be used as feedback for possible modification or improvement of the Army’s system for RM instruction. Each leader selected as a
respondent was evaluated on several biographical characteristics including, commission status, rank, age, experience level, deployment history, and Army component.
5.1 Material and Methods The research was conducted using a military training scenario to survey 13 cadets and Army leaders by asking them to complete an RM worksheet in accordance with US Army doctrine and their experience. The respondent pool was selected from all levels of Army leaders, ranging from junior non-commissioned officers to general officers. Participation in the project was based off a voluntary response to a request for responses. The reason for the request, a description of the research being conducted, and a privacy notification was provided to all participants. The participants were requested to complete an RM worksheet based on the previously described footmarch scenario. The RM worksheet is a tool that the Army uses to quantify risk evaluation based on the doctrinal tenants discussed earlier. When completing the RM worksheet each step is performed in an attempt to fully identify and address each of the hazards associated with the event. The expert system evaluated the consistency of the responses and compared those outputs to the researchers’ outputs relating to the provided training scenario. These outcomes were then data mined to identify any trends in the responses related to experiential and biographical factors.
5.2 Results The results of the study revealed that officers viewed the scenario as higher risk than did the enlisted respondents. Overall risk level evaluations ranged from 1.01(low) to 7.23(high). The average overall risk level identified by the six enlisted respondents was 2.81 and the overall risk level identified by the seven officers was 4.37. The data was viewed in tree form using entropy and information gain calculations to determine the most effective attributes to split the population at each level. The attribute “Above Median Risk” was selected as the class with the intent to see what attributes had the largest impact on how risk was viewed and assessed by the respondent population. The first division was calculated on the attribute of “Is Soldier an Officer”. This attribute had entropy of .558429 and divided the population into seven respondents on the TRUE value and six respondents on the FALSE value. The TRUE value had a calculated entropy of .59173 and the FALSE value had a calculated entropy of .65008. This resulted in an information gain of .91558 for the division on attribute “Is Soldier an Officer”. For the OFFICER TRUE value, the attribute “Combat Deployment” was selected. This division resulted in entropy of 0 for both TRUE and FALSE values. This resulted in a leaf node containing six officers with one or more combat deployments on the TRUE value and a leaf node of one officer with no combat deployments on the FALSE value. For the OFFICER FALSE value, the attribute “Greater Than 8 Years Time in Service” was selected. This division resulted in entropy of 0 for both TRUE and FALSE values. This resulted in a leaf node containing six enlisted soldiers with greater than 8 years time in service on the TRUE value and a leaf node of one enlisted soldier with less than 8 years time in service on the FALSE value.
International Journal of Computer Applications (0975 – 8887) Volume 1113– No.6, March 2015 Based on this population the researchers determined that the most significant attribute in determining how an Army leader is likely to view risk is whether they are an officer or an enlisted soldier. The other significant attributes were number of years time in service and whether the soldier had deployed or not. The decision tree depicting entropy and information gains is depicted below in Figure 5.
hazards identified in these areas, especially Exposure Duration, being coded to another area such as planning if it was identified and mitigated by a planning or other factor. Further research with an expanded pool of respondents could confirm or deny this. This is reflected below in Figure 7.
Fig. 7: Risk Identification by all participants
6. DISCUSSION Fig. 5: Decision tree used for classification The chart Risk Values by Respondent shows how each respondent categorized risk for each of the variables in the scenario. Of particular interest from this visualization is the consistent level of emphasis that the respondents placed on the planning phase of the operation. A risk factor was coded to the Preparatory Time or Mission Planning factor if the Hazard Identification and Control was mitigated by a planning factor, Standing Operating Procedure (SOP), or other preexecution control measure. One factor for this result could be the overall senior level of the respondents and their generally high level of military experience. Further research with more junior respondents could confirm or deny this hypothesis. See Figure 6 below.
The research provided very interesting initial findings. The finding that the officer respondents identified higher scenario risk was surprising since the officers surveyed have a great deal of variation in their background and biographical data. A minor correlation exists between the higher risk identified by the officers based on grade. The only junior officer respondent viewed risk below the median risk level. These results create a number of questions to be further investigated. We believe that one of the most likely conclusions is that there exists a difference in the training received by the officer and NCO respondents. Since most training for Army leaders is conducted in peer groups there may exist a distinction between the training provided to the officers and NCO’s. The comparatively small pool of respondents prevents the drawing of definitive conclusions from these results, and further research should focus on a larger respondent pool including more junior officers to confirm or deny these results. Another interesting finding was that there was no significant difference between the level of risk identification between Active Duty and Reserve component officers and enlisted soldiers. This is probably due to the high operational tempo level that the Reserve component has maintained for the past 10 years. This hypothesis receives some support due to the number of combat deployments experienced by the Reserve component respondents.
7. CONCLUSION
Fig. 6: Trends in the participants’ responses There were two variables which were not specifically discussed by more than 50% of the respondents. The variable Environment was not discussed by seven respondents, four officers and three enlisted. The risk variable Exposure Duration was not specifically discussed by seven respondents, three officers and four enlisted. Some of this may result from
The use of fuzzy system to evaluate the level of risk identification by Army leaders provided interesting results. The fact that officers viewed risk at a substantially higher level than enlisted leaders may provide useful input into the tasks and scenarios used RM training. Most military training separates officers and enlisted leaders into different courses. This segregation of leaders during training may have bearing on the fact that they view risk for the same task at such a different level. These results should be taken into account when evaluating training development. Participants in this research consisted of large proportion of senior leaders. There is a significant difference in the training and background between leaders at the General Officer level compared to the junior officers and NCO’s in this study.
International Journal of Computer Applications (0975 – 8887) Volume 1113– No.6, March 2015 Further studies containing participants with such varied backgrounds may yield less useful results than research using leaders with more similar backgrounds.
[9] Liwang, H., Ericson, M., Bang, M. (2014). An examination of the implementations of risk based approaches in military operations. Journal of military studies, 5(2), 1-26.
The researchers recommend conducting further studies with the same or similar scenario on a larger respondent pool. In addition to an increase in size, research conducted on a longitudinal pool of officers or NCO’s of the same grade may provide some insight into what biographical or experiential commonalities exist among leaders who view risk similarly.
[10] Karmperis, A., Sotirchos, A., Tatsiopoulos, I., Konstantinos, A. (2014). Risk assessment techniques as decision support tools for military operations. Journal of computations & modeling (online), 4(1), 67-81.
Examination of further research would benefit from an expansion of the types of analysis tools used. Studies conducted with larger participant pools may choose to evaluate their results with the use of neural network clustering tools like those found in MATLAB. Viewing the clusters would provide the researchers an opportunity to evaluate leaders with like responses for biographical similarities. Other evaluations tools like case based reasoning should also be considered. The results from this further research should be reviewed by Army training developers for inclusion into future RM training courses. As studies provide more in depth analysis into pools of respondents of similar rank these results will provide the Army training community with information that can be used to evaluate and develop targeted training packages.
8. REFERENCES [1] Field Manual 5-19 Composite Risk Management (2006). Headquarters, Department of the Army. Washington, DC. [2] Department of the Army Form 7566, US Army Composite Risk Management Worksheet (2005). Headquarters, Department of the Army. Washington, DC. [3] VanVactor, J. D. (2007). Risk Mitigation Through A Composite Risk Management Process: The US Army Risk Assessment. Organization Development Journal, 25(2). [4] Prokop, J., Pfeifer, D. (2013). How do you deal with operational risk? A survey of risk management practices in the German insurance sector. Journal of Risk Management in Financial Institutions, 6(4), 444-454. [5] Rotar, L. J., Kozar, M. (2012). Exploring the mechanisms for implementing a risk management process: overall approach and practical example. Performance Management, 223. [6] Samvedi, A., Jain, V., Chan, F. T. (2013). Quantifying risks in a supply chain through integration of fuzzy AHP and fuzzy TOPSIS. International Journal of Production Research, 51(8), 2433-2442. [7] Gates, S., Nicolas, J. L., Walker, P. L. (2012). Enterprise risk management: A process for enhanced management and improved performance. Management accounting quarterly, 13(3), 28-38. [8] Army Techniques Publication 5-19 Risk Management (2014). Headquarters, Department of the Army. Washington, DC.
[11] Karmperis, A., Sotirchos, A., Tatsiopoulos, I., Konstantinos, A. (2013). Decision support models for solid waste management: review and game-theoretic approaches. Elsevier, 33(5), 1290-1301. [12] Costa-Font, J., Mossialos, E., Rudisill, C. (2009). Optimism and the perceptions of new risks. Journal of risk research, 12(1), 27-41. [13] Gang, H. (2014). Individual differences in risk-taking tendency and framing effect. Social Behavior & Personality: An International Journal, 42(2), 279-284. [14] Nicholson, N., Soane, E., Fenton-O'Creevy, M., Willman, P. (2009). Personality and domain-specific risk taking. Journal of Risk Research, 8(2), 157-176. [15] Weber, Elke U., Ann-Rene Blais, and Nancy E. Betz (2002). A domain-specific risk-attitude scale: ´ measuring risk perceptions and risk behaviors. Journal of behavioral decision making, 15, 263–290. [16] Dohmen, T., Falk, A., Huffman, D., Sunde, U., Schupp, J., & Wagner, G. G. (2011). Individual risk attitudes: measurement, determinants, and behavioral consequences. Journal of the european economic association, 9(3), 522-550. doi:10.1111/j.15424774.2011.01015.x