7 MODELING OF OPERATIVE RISK USING FUZZY EXPERT SYSTEMS Santiago Medina Hurtado PhD. Minas Faculty - National University of Colombia, e-mail:
[email protected]
Abstract
This study is focusing on the modeling of operative loss exposure of the allowances and Retirement Funds with the use of a Fuzzy Expert System, which evaluates the environmental and managerial factors, this allow obtain a qualification about the possibility that the company incurs in operative losses. The system can be very useful either when the quantitative information is limited due to the discrete character of the risk events or when the information about the risk factors are associated to expert’s knowledge, for these reasons the modeling using formal statistical tools is difficult. We propose too, a simple methodology to complete the knowledge matrix of the Fuzzy Expert System which combines the scoring method with the expert knowledge that allows obtain the rules of system in a simple and quick way. This extraction method saves time in the modeling of complex systems where many variables interact and where there are restrictions with the expert interactions. These systems allow having a structured vision of the sources of operational risk and where the manager should concentrate efforts to diminish the exposure. The Fuzzy Expert System can help to complement the operative risk analysis carried out with quantitative methods as Extreme value theory or Montecarlo simulation.
7.1 INTRODUCTION The growing necessity to give appropriate solution to socio-economic, administrative and financial problems, starting from human perceptions and that as such we don't have enough information to apply conventional mathematical models, forcing us to search alternative models that allow obtain conclusions starting from linguistic variables. The Fuzzy Logic appears like a tool that allows us to make this transformation and provide a different answer to many real world problems where the information is incomplete, vague and subjective.
136 Every day companies and institutions must face different kinds of risks, according their activities or environment. The financial literature classifies the risks in three big groups which are not independent, the market risks, the credit risks and the operative risks (Basel II 2004). However the risks are wider than these classifications (for example: regulatory risk, tributary risk, politics risk, social risk, legal risk, etc). On the other hand, the operative risk includes a great quantity of risk factors whose modeling is difficult for two aspects, first the information relative with the factor is in many cases of qualitative type and second the scarce quantity of data due to discreet character of the events that make it difficult to modeling the risk using formal statistical tools. Most of the methodologies that address the risks have a statistical foundation and they are centered in the modeling of market and credit risks, however, for the modeling of operative risk the statistical approaches are centered in simulation processes and extreme value theory, this one fix a distribution to the tail lost. This would not have bigger difficulty if the quantitative information is enough but that is not the case . For this reason in the last years, the interest of experts and investigators has been directed toward the development of methodologies that treat the subjective characteristics. Actually we are applying methodologies like Bayesian Analysis, Fuzzy Inference Systems and the Fuzzy Expert Systems to treat problems with incomplete information, in order to guide the make decisions process. The first time that the financial community spoke of “Operative risk” was probably in 1995 when the English Baring Bank PLC, crashed, due to the transactions carried out by an operator which consumed the capital stock of the company. This event reveled to the financial market the existing risks that could not be classified as market or credit risks and could still affect the results considerably. In the context of the financial institutions the operative risk refers to the range of possible losses associated to risks of the environment, by human fault, processes or technology. The operative risk is a wide concept. In some cases it is difficult to make a clear distinction among the operative risk and the normal risk that institutions face in their daily operations; in some cases it is difficult to distinguish the limits. For example if a customer fails to pay their loan, it can either be due to the normal credit risk that institution face or it can also be due to the human error that occurred when the analyst studied the client’s solvency. The administration program of the operative risk should clearly define that be included as operative risk to diminish the grade of ambiguity with other risk types. Many managers of financial institutions believe that the operative risk losses could be more significant than the market risks or the credit risks losses (although this isn’t clearly demonstrated). The importance of risk measure and control were considered when the Norte American banks divided and qualified its risk into 50% in credit risks, 15% for the market and liquidity risks, and 35% operative risks (Cruz 2002).
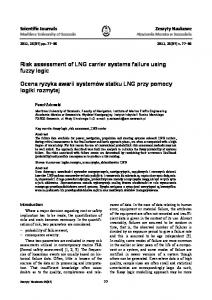
137 The first step toward a stricter administration of risk to financial institutions was the agreements signed at the end of 1988 by the central banks group of industrialized countries (Basel I 1988). These agreements have led the proposal of risk management that has evolved from credit risks, to the market risk and now the operative risks. In this sense they demand the implementation of administration models with the goal of diminishing the probabilities of loss and to have an adequate technical capital to cover the potentials loss. The BASLE is the main international agreement that regulate and propose methods that are still in evolution process to treat the risks of financial institutions, however any type of business are exposed to risks. For this reason schemes referencing to risks management have been proposed like COSO, ISO, Australian Standard, PMI, etc. The operative risk is subdivided in two main components, first the operative risks due to internal causes and second the strategic risk due to external causes, and this is indicated in the Figure 1.
Figure 1. Operative Risk classifications. The internal operative risks are associated to people, processes or technology used in the normal business course, anyone of these factors can experience some fails and produce financial loss. The external operative risks arise of environment factors such as new competitors, political and regulatory environments, climatic factors, technology, but they also can arise of strategic plans; for example a new business line. These factors are outside of the company control. A proportion of this loss can be estimated and they should be covered, the other however can’t be estimated. In both cases forecast the impact and the frequency loss is a difficult task to achieve. In the operative risks analysis is important to quantify the potential loss expected with the purpose of covering them. The potential loss is the product of the probability that the event happens and its associated cost (severity), however, both quantities are difficult to quantify because these events don't occur frequently, that is, they are dis-
138 creet events that are difficult to register and are time requires. For this reason is difficult to apply, in some cases, statistical analysis to make an objective valuation of the operative risk (Vose 1996, Cruz 2002, Moscadelli 2004, Reiss 2001, Cornalba 2004, Chernobai 2006, Chavez 2006 et all). However the difficulty in the valuation doesn't imply that the risk should be ignored, but rather, we should look for methods that allow us to model this reality. The impact (severity) of a financial loss can be divided in two categories, the expected, and the unexpected. In turn the unexpected loss can be classified as “severe” or “catastrophic”. The expected losses should be covered with a proportion of the profits, while the severe or catastrophic losses will be covered with a proportion of the company’s economic capital, insurance contracts or derivatives (Hull 2008). The lack of historical data doesn't allow the application of statistical models; however there are people with knowledge that understand and manage its processes. In this sense the qualitative information is very important because it allows, starting from a systematic process, to identify the factors that expose the company or business line to operational loss with the purpose of treating these sources of risk in an opportune way. Actually many researches apply Fuzzy Logic (FL), to treat problems where the information is subjective and vague. The potential use of FL is extended to the entire field of the social sciences (Kaufman 1990, Kulkarni 2001, Medina 2008, Glykas et al. 2004, Xirogiannis et al. 2008). In the case of the operative risk, the FL allows to the analysis of the risk with a smaller cost and a structured vision of the operational risk to be carried out when the quantitative information is limited. This doesn't mean that the Fuzzy Logic can replace the statistical methods that measure the operational risks; however it can provide a rigorous theoretical scheme for the treatment of many problems and to help make decisions. FL is an administrative tool that allows measuring the state of a process and helps us to make better management. This article is organized in the following way. The numeral 2 describes the operation of a FIS. In this numeral a method to extract the base of knowledge in an easy and quick way is proposed; this is the critical part of the FIS. The numeral 3 formally defines the Fuzzy Expert Systems FES. The numeral 4 expose an application of modeling of operative risk. The last numeral presents the summations.
7.2 FUZZY LOGIC SYSTEMS The Classic Logic isn’t appropriate when we try to describe facts that are not completely true or completely false, because it completely excludes the possibilities among these two values. The Fuzzy Logic on the other hand, allows us to use relative con-
139 cepts of reality, defining the grades of membership and following the reasoning patterns similar to the human thought (Kosko, 1995). The Fuzzy Logic formalized by Zadeh in 1965 is based on the theory of the Fuzzy Set. It indicates the grade of membership of an element to the group determined by its membership function that takes values in the interval [0, 1] (Jang, 1997, Kulkarni, 2001, Kasabov, 1998 and Kosko, 1995, Buckley 2002). This way, while in the framework of classic logic, for example, the utility of a company takes only two values, it is low with grade zero value (0) or it is high with one value (1), for the Fuzzy Logic is possible also all intermediate conditions of utility like “very low”, “relatively high”, “middle”, “lightly low”, etc. with values in [0, 1]. The extreme values assumed by the classic logic are only a particular case inside the universe of the Fuzzy Logic, because it allows being relatively imprecise to represent problems and to arrive to adequate solutions (Kosko, 1995). The Fuzzy Logic opens the possibilities, by giving solution to problems that are expressed from the human perspective and for this simple condition, they can’t have an unique solution from the “false” or “true”, since it can take intermediate conditions to give satisfactory solutions to the problems. The Mamdani Fuzzy Inference Systems FIS, (Mamdani, 1977, 1981) was the first system proven in a practical way as universal approximator of functions. Later in 1992 Kosko and Wang formally settled that any relationship among input and output variables can be approximated by means of FIS, built in linguistic terms with a high grade of accuracy (universal approximator). To build a FIS the steps to follow are indicated in the Figure 2.
Figure 2. Steps to building a FIS. Next, we explain the steps to build a FIS: Fuzzyfication. The first step to build a FIS is to define the inputs and outputs of the system (linguistic variables), their linguistic terms (fuzzy sets) and their membership functions. The “linguistic variable” can take ambiguous or inexact values, for example the linguistic variable “Profitability” can take the linguistic terms “lower”, “middle”
140 and “high” and has a semantic meaning for the analyst. These terms are represented by means of fuzzy sets. The Figure 3 presents three fuzzy sets lower, middle and high (linguistic terms) for the Operative Margin variable.
Figure 3. Fuzzy sets assign to Operative Margin Formally, a fuzzy Set is defined by: Let, X the universe of discourse x is an element anyone of X and A is a collection of elements x X and they have a defined characteristic (A X). A is a fuzzy set in X and define the group of orderly couples
A [(x, µ A (x)) / x X]
(7.1)
Where µA (x) is a membership function of fuzzy set A. The membership function assigns to each element of X a real number among [0, 1], denominated “grade of membership” of the element to the fuzzy set A. The types of membership functions commonly utilized are: Triangular, Trapezoidal, Gaussiana, Sigmoidal and Generalized of Bell. They are chosen to reach an appropriate correspondence among the inputs and output spaces of a system. Construction of the rule base: to build a FIS we should define the fuzzy rules Ifthen: These rules specify the relationship among input and output variables of the system. The fuzzy relationships determine the grade of association between elements of two or more sets. The IF – THEN Rules type Mandani has the shape: “IF X1 is A1 and X2 is A2 and.......and Xk is Ak THEN Y is B” Where A1, A2,…., Ak, B are linguistic terms defined by mean of fuzzy sets to each linguistic variable in the universe of discourse X1,X2,…..,Xk and Y. “Xi is Ai and…” is called the antecedent of the rule or premise and “Then Y is B” it is called the consequent or conclusion. The previous rule, defines a fuzzy relationship in the dimensional
141 space k+1, characterized by a function of membership µAkB (X1,X2,….., Xk,Y) [0; 1]. The set of fuzzy rules (also call “base of knowledge”) are obtained by knowledge experts through interviews, questionnaires or panel technical, however, in many occasions the access to experts isn’t available but a numeric database of input and output variables is available. This database allows obtaining the set of fuzzy rules applying some extraction algorithms. [Hammell and Sudkamp 1994, Wang et al. 2001, Wang and Mendel 1992, Tsang and Yeung 1997, Wang and Hong 1999, Männle e 1999, Herrera and Verdegay 1995, Chin et al. 2003, Espinosa and Vandewalle 2000]. To represent causal relationships among input and output variables of systems can be a very useful use fuzzy cognitive maps which give us a complete representation of the situation and their relationships (Kosko 1994, Xirogiannis and Glykas 2004, Xirogiannis and Glykas 2007). For example suppose that an analyst tries to measure the effect of the slowness of the system in the level of operative risk. As a first step some causes and effects are identified and bounded to the event of “slowness of the system.” A slow system is caused by the reduction of the satisfaction of the employees, which redounds in a reduction of procedural transactions; this satisfaction commits to other events that increase the operative risk of the business just as it is shown in the Figure 4 (Cruz 2002). Later this representation should be expressed in form of IF-THEN fuzzy rules. The Figure 4 also represent the effect of factors like electric risk, regulatory policy, socio-political risks over the energy spot prices and the decision of load deal for a trader company of electrical energy. The fuzzy rules can be represented by means of matrix arrangements like in the example indicated in the figure 5. The inputs are located in the columns or row of the matrix and show the linguistic labels of their fuzzy set. The levels of the output variable (Low, Middle or High organizational Administration) are located in the central part of the matrix. This matrix represent the fuzzy rules in a concise form. The matrix should be completed following the procedures like panel sessions, interviews or surveys, etc. In this article we suggest a method to capture the expert opinion by means of scoring method which allows us to obtain the rules quickly, as it is indicated next:
142
Figure 4. Examples of Fuzzy cognitive maps ORGANIZATIONAL MANAGEMENT Strategic managements
Exposure to process factor Risk Managements
Low
Middle
High
wrong
HIGH
HIGH
HIGH MIDDLE
Inadequate Adequate
wrong
MIDDLE
MIDDLE
Inadequate
moderately good
MIDDLE
HIGH
HIGH
Adequate
moderately good
LOW
MIDDLE
MIDDLE
Inadequate
Good
MIDDLE
MIDDLE
HIGH
Adequate
Good
LOW
LOW
MIDDLE
Figure 5. Matrix arrangements for Organizational management
The first step is pondering each input Xi, according to importance or effect that each Xi has on output Yj. Let Pi
weights assign to each input. i=1,.,n. Pi 0,1 and
n
P i 1
i
1
Where n = number of input variables to the FIS. To higher weight (Pi), more relative importance of the input variable (is bigger the effect over the output variable) Example: If we are evaluating the variable: “Exposition to External Factors”, we can use three input variables and these are qualified with the following weight according to their importance by the expert’s opinion: Other Entities dependence Legal norms Knowledge Regulatory stability
(24%) (29%) (47%)
143 Ponder the importance of each fuzzy set (linguistic label) assigned to each input “Xi”. Then “Cij” is the weight assigned to each fuzzy set of the input Xi, and indicates the effect on the output Yj. Where: i=1,…,n j=1,…,m m
And
C j 1
ij
n is number of input variables to the FIS. m is each fuzzy set defined to input i.
1
i 1 ,.., n
Example: the input “Regulatory stability” has assigned three fuzzy set (three levels: very low, low and middle). The expert should assign weights to each level according to importance or effect that this one has over the output variable: Very low weight (50%) Low weight (39%) Middle weight (11%) The expert must qualify any scenarios of the knowledge matrix, that is, the experts should define a set of reference rules, that allows to later, validate the FIS output. In general extreme and middle scenarios are evaluated easier for qualifying when the system is very big. The rules are expressed by: If X1 is A1 and X2 is A2 and...... and Xk is Ak Then Y is B Example: “IF Regulatory stability is Very Low And Legal norms Knowledge is Low And Other Entities dependence is middle Then Exposition to External Factors are High” The score for each cell of matrix knowledge is calculated by means of the relationship:
K ij Where:
n
C i 1
i j
. Pi
For all j=1,…,m
(7.2)
i=1,2, n number of input variables. j=1,..m number of fuzzy set assign to each input variables.
The next step is correlating all scores in each cell of the score matrix with the fuzzy sets assign to output variable Yj. This procedure is carried out by obtaining the maximum and minimum value of the scores matrix, be these Kmax and Kmin respectively. Kmax and Kmin determine the scores range that can take the output Yj, therefore, the fuzzy sets must be assigned to this range. The score on the intersection of fuzzy sets determine the score from which is assigned a fuzzy set to each cell of the matrix (Compared the score of each cell with the score on the intersection). The Figure 6 shows an example of three triangular fuzzy sets assigned to output Yj. These are distributed on the range Kmax and Kmin. The scores on the intersections
144 are L1 and L2, they determine the points from which for a specific score, a fuzzy set should be assigned. For example to scores smaller than L1 assigned Low, between L1 and L2 medium and high on other cases (bigger than L2).
Figure 6. Triangular fuzzy set to output Yj The system response can be modified by changing the position of the limits L1 and L2 such that the system response is adjusted to the referenced fuzzy rules qualified by the experts previously. This process permits us to obtain the fuzzy rules matrix.
Then, a validation process should begin with the fuzzy rules matrix suggested on
the previous step to adjust the system. All cells are evaluated, first it needs to be verified that the reference rules are obtained and then it needs to be verified that all other rules are consistent, otherwise, the limits L1 and L2 must be moved to adjust the system response.
Composition operations. The basic operations carried out with fuzzy sets are Union, Intersection, Complementation, the Cartesian product and the Cartesian Coproducts. These operations are carried out by means of binary operators, classified as T-norms (for intersection operations) or S-norms (for operations of union). (Kaufman 1990, Kaufman 1982, Jang and Mizutani 1997, Kulkarni 2001, Kasabov 1998) The fuzzy rules define a fuzzy relationship in the space dimensional k+1, characterized by a membership function µ AkB (X1,X2,…..,Xk,Y) [0; 1], the basic operations with fuzzy sets are utilized like implication relationships and used to derive membership functions of fuzzy set n-dimensional. Inference Mechanisms (Approximate Reasoning): The Approximate Reasoning is an inference procedure to derive conclusions from fuzzy rules type IF-THEN and values that take the inputs Xi of systems, applying composition relationships Max-Min or Max-product. These permits to infer a fuzzy value B´ if we have fuzzy inputs into kdimensional space (A´k) and we have defined the implications relationships: R : Ak B, then B´ = A´k ° (Ak B)
(7.3)
For example if the system is defined by the following two fuzzy rules (the rules defined fuzzy relationship): Rule 1: IF x is A1 AND y is B1 Then z is C1, or Rule 2: IF x is A2 AND y is B2 Then z is C2
145 Figure 7 represents the approximate reasoning. The systems response C´ is obtained from the inputs: “x” is A´ and “y” is B´ (A´ and B´ can be fuzzy Sets) and the previous fuzzy rules. Each rule is expressed by:
R1 = (A1xB1)→C1 and R2 = (A2xB2) → C2.
(7.4)
The composition max-min can be used to infer µC´(z). The composition operator “°” is distributed on the union of two fuzzy relations by:
C´ = (A´ x B´)°(R1 U R2) C´ = {(A´ x B´)°R1} U {(A´ x B´)°R2} C´ = C1´ U C2´
(7.5) (7.6)
Where C1´ y C2´ are fuzzy sets derivate of fuzzy rules 1 and 2 respectively. This result can be extended for n-rules. Aggregation. In this step the outputs of each rule (C1´, C2´,...,Cn´ activation strength of each rule) are combined to obtain only one fuzzy set C´. The inputs of the aggregation process are the truncated membership functions obtained by approximate reasoning for each n-rule. The aggregation method is commutative; it doesn't care the order in which the output of each rule is added. This process defines a method to find C´= (C1´ U C2´ U…….U Cn´). Where C1´, C2´,...,Cn´ are fuzzy sets inferred by rules 1,2,…, n. and C´ is a fuzzy set or output system with membership function µC´(z).. The Maximum operator is the aggregation operator that is most utilized. The output C´ is defined by: C´ = [(z, µC´ (z)/ z Z]
(7.7)
Where Z is the discourse universe of output variable and their membership function is given by: µC´ (z)=Max (C1´,C2´,…,Cn´) (7.8) The fuzzy set C´ = C1´ U C2´ aggregate the truncated fuzzy set of each rule. See Figure 7 Defuzzyfication: In this last step, is obtained a crisp value (K) from the fuzzy set C´ that provides the solution to the output system (see Figure 7) and to permit to make decisions. The concretion methods mostly used are gravity (center of area), Bisector, Middle of maxima, More small of maximum and bigger of maxima (Jang and Mizutani 1997, Kasavov 1998).
146 The center of area is the concretion method most utilized, because it is similar to calculate the expected value of a distributions probability. The crisp value Zc´, is obtained by integrating the output membership function µC´ by the means of the following relationship:
ZC´
z z dz C´
z
z dz z
C´
(7.9)
Figure 7. Approximate reasoning
7.3 FUZZY EXPERT SYSTEMS (FES) The interrelation of FIS allows the configuration of an FES and can be used to model complex decision making systems. A FES is a system that uses Fuzzy Logic instead of Boolean Logic to deduce conclusions from input variables. FES is different from conventional expert systems which are applied to domains well defined, where the knowledge phenomenon is wide however, problems where inaccuracy, ambiguity
147 and bad definition exists, the development of a conventional expert system will be more difficult. The treatment of uncertainty is an important aspect in the evolution of expert systems. In the domain of an expert system there are different sources of uncertainty and this implies that there are not exact solutions, there are approximate solutions (making decisions about management and economics, psychological, medicine etc.). For example, if a problem can be solved in different ways, the expert system should be able to recognize the possible solutions, whose answers should be overlapped; therefore the solution is also inaccurate and uncertain. The expert system should be able to accept questions that incorporate uncertainty and provide an interpretation or reasoning appropriate to this uncertainty. The following characteristics of decisioning problems are inherent to the process of human reasoning: The learning process or acquisition of knowledge is imprecise The knowledge of the expert contains uncertainty. The process of the expert's reasoning is imprecise. The knowledge represented in natural languages introduces uncertainty. The information isn’t totally defined. The previous characteristics limited the use of conventional expert systems. The incorporation of fuzzy logic in the expert systems allows their potential use in many areas of knowledge due to the treatment of characteristics associated to learning processes and human reasoning. Let xi = (x1 , x2 , x3 ,….., xn) the inputs to FES, these will feed j-Fuzzy Inferences Systems (FIS1j), that is, each FISj is integrated by n+1-tupla (x1 , x2 , x3 ,….., xn.,yj) and they have a fuzzy sets by output variable (Yj), which allow to obtain a crisp values Z(Cj`) after apply a defuzzyfication method. See Figure 8. The output Yj will be the input for the following level of the FES with crisp values Z(Cj`), that is, the variable Yj will feed again k-new FISk, each one will be formed for j+1-tuplas [Z(C1`), Z(C2`),…..,Z(Cj`), Wk], and they have a fuzzy sets by output (Wk), which allow obtained crisp values Z(Dk`) after apply a defuzzyfication method. Repeating this process successively can reach the output Z(Et`) of the fuzzy expert systems. (Medina 2007)
148
Figure 8. FES structure A formal expression for this process is shown below: Level Level 1
Level 2
Fuzzy Set Y1 Y2 …………. Yj
Crisp Value (Defuzzyfication) Z(C1)=f1(x1 , x2 , x3 ,….., xn) Z(C2)=f2(x1 , x2 , x3 ,….., xn) ………….. Z(Cj)=fj(x1 , x2 , x3 ,….., xn)
W1 W2 …………. Wk
Z(D1)= f’1 (Z(C1), Z(C2),…..,Z(Cj)) Z(D2)= f’2 (Z(C1), Z(C2),…..,Z(Cj)) …………... Z(Dk)= f’k (Z(C1), Z(C2),…..,Z(Cj))
Level 3 Outputs
Z(E1)= f’’1 (Z(D1), Z(D2),…..,Z(Dk)) Z(E2)= f’’2 (Z(D1), Z(D2),…..,Z(Dk)) …………… Z(Et)= f’’t (Z(D1), Z(D2),…..,Z(Dk))
The output Z(Et) can be written as: Z(Et)= f’’t (Z(D1), Z(D2),…..,Z(Dk))
Z(Et)= f’’t {f’1 [Z(C1), Z(C2),…..,Z(Cj)],….., f’k [Z(C1), Z(C2),…..,Z(Cj)]} Z(Et)= f’’t {f’1 [f1(x1,..,xn),…., fj(x1,..,xn)],….., f’k [f1(x1,..,xn),…., fj(x1,..,xn)]}
(7.10)
149
The functions f are FIS that transform the initial input (x1 , x2 , x3 ,….., xn). The equation 7.10 is a highly not lineal function. FES also allows the incorporation of information that come from models of the financial economy (such as a valuation model of companies) or forecasting models (such as a neuronal network or ARIMA model). These structures combine the entire information that comes from the expert knowledge and the mathematical or statistical models that are necessary in the analysis of complex problems. Figure 9.
Figure 9. FES that incorporate financial economic models The following section shows an application of the operational risk analysis.
7.4 MODELING OPERATIONAL RISK FACTORS In this paragraph apply the methods described above to the operational risk modeling of a financial institution associated with the pension Funds and layoffs 7.4.1 FUZZYFICATION The first stage that should be carried out is the fuzzyfication process of a system. We should identify and define clearly the input and output variables, their relationships, the number and type of fuzzy sets assigned to all variables. This generally is done by the entity's executive staff at all levels. After carrying out the consultation regarding the factors that expose the entity to operative loss or factors that can reduce their exposure, we proceeded to analyze each ideas expressed. The result of the identification and grouping of variables is shown in Figure 10.
150 The first level is composed by the input variables of the systems that will be qualified by experts when the systems is operating. These are: Regulatory stability knowledge of regulations Dependency of other entities Knowledge Management Management of human talent Problems of the technological platform Planning Design and Development Standardization of processes Supply Management Information security Risk Management Strategic Management Then we must define higher level variables, these ones correspond to clusters of the inputs variables which have a clear meaning to the experts. These higher level variables define the number of FIS that contains the expert system; in this case seven FIS should be completed. These are: Exposure to External Factors Exposure to Human factor Exposure to process factor Risk Management Organizational Management Exposure to internal factors Exposure to Operational Loss
151
Figure 10. FES for Operative Risk measurement This model allows the evaluation of the level of exposition to operative loss to the company. Each variable in each level was clearly defined for experts to avoid difficulties with the interpretation. Then, the complete FES model can be used how audit tool and integrated with the other process of risks management. Then, fuzzy sets must be assign to each input and output variables of the system. These are defined by a range [0,1]. For example the “Exposure to Operational Loss” variable, has assigned three fuzzy sets with linguistic label of low, medium and high. The Figure 11 shows triangular fuzzy sets used for the FES. All fuzzy sets are defined in the universe of discourse [0,1]. The Figure 12, shows all fuzzy variables and their fuzzy sets defined by the fuzzy Expert System.
Figure 11. Triangular Fuzzy sets
152 INPUT AND OUTPUT VARIABLE Regulatory stability Knowledge of regulations Dependency of other entities Knowledge Management Management of human talent technological platform Problems Planning Design and Development Standardization of processes Supply Management Information security Risk Administrations Strategic Management Exposure to External Factors Exposure to Human factor Exposure to process factor Risk Management Organizational Management Exposure to internal factors Exposure to Operational Loss.
LINGUISTIC LABELS very low very low low inadequate inadequate low inadequate low inadequate regular regular inadequate low low low wrong low low low
low low middle adequate adequate moderate adequate middle adequate good good adequate middle middle middle regular middle middle middle
middle middle high high high high high high good high high high
Figure 12. Fuzzy variables and fuzzy sets of systems 7.4.2 KNOWLEDGE MATRIX In this stage we should defined the fuzzy rules that allows forecast the behavior of the systems (output variable) if we have different levels of input variables. It basically corresponds to the definition of the underlying relationships among the input and output variables which are expressed in IF-THEN statements. The group of statements IF-THEN, conforms the set of fuzzy rules and are the explicit representation of the experts knowledge about the specific process which we wants to evaluate, therefore, the participation of experts in the building of the knowledge matrix is an important issue for both the validity and acceptability of the model.
The fuzzy rules take the form: “IF X1 is A1 and X2 is A2 and.......and Xk is Ak THEN Y is B” From the operative point of view, the process begins with the identification and definition of input and output variables from expert opinion. Then the knowledge matrix should be completed which incorporates the information from the input variables, fuzzy sets and the output variable. The matrixes define the relationships between variables and are completed by using the algorithm presented in Section 2. Seven FIS should be the developer to measure the "operational loss exposure". For example, to complete the FIS related with "Organizational Exposure Factor" the experts defined the six rules of reference shown in the following matrix (Figure 13). The missing fields must be completed with the proposed procedure:
153
Figure 13. Organizational management matrix knowledge. Could be thought that it's an easy job to complete the system matrixes from the experts directly, however when the number of input variables as well as the number of fuzzy sets is very large (modeling a complex problem with many chained FIS), the number of cells in the matrix increases exponentially, therefore, it takes a long time for the experts analysis to complete the matrixes. To complete the scoring matrix (see figure 14), we used the previously proposed procedure and calculate the scores for each cell from weights given to each input variable and the weight given to the fuzzy sets of each variable. For example, the scores in the first cells are calculated as follows (see : 0.4549 = 0.32x0.81 + 0.29x0.5 + 0.39x0.13 0.5212 = 0.32x0.81 + 0.29x0.5 + 0.39x0.30 0.2565 = 0.32x0.19 + 0.29x0.5 + 0.39x0.13 0.3228 = 0.32x0.19 + 0.29x0.5 + 0.39x0.30
Figure 14. Scoring matrix for organizational management exposition. The next step is to relate the scores for each cell in the matrix with the fuzzy sets assigned to the output variable of the FIS. To make this we must first determine Kmax and Kmin and then assign the fuzzy sets defined for the output variable in this range. In our case Kmax = 0,59750 and Kmin = 0,14050. We have assign three fuzzy sets to the output variable “Exposition to organizational factor” (low, medium, high), then we must define the position of these fuzzy sets into the interval [0,14050 ; 0,59750]. We
154 can make a symmetric partition of interval, in this case we must only determine the amplitude of each interval dividing the rank by three, that is, Rank = 0,5975 – 0,1405 = 0,4570 Amplitude = 0,4570/3 = 0,15233 Then, the limits L1 and L2 are determined by adding this amplitude starting from Kmin. For our case L1 = 0,29283 and L2= 0,44517, this is shown in Figure 15.
Figure 15. Fuzzy sets for Exposition to organizational factors. The system response can be modified by varying the position of limits L1 and L2 in a way that the assignment of fuzzy sets is in accordance with all rules described by experts. Through this procedure will be determined all the rules of system. 7.4.3 FES VALIDATION PROCESS The inference system must be validated through tests, that is to say, we must give values to the input variables of FES and then we must compare the results of system with the expert opinions. The results must be consistent. The following validations can be carried out: Validation each knowledge matrix (each FIS) that compose the expert system. The fuzzy surfaces allows the validation of the relationships among input and output variables and their consistency. An example of a fuzzy surface is shown in the Figure 16. If the behaviors are not consistent we must review the rules, suggest the use of another fuzzy set to the input or output variables or move the fuzzy sets in the universe of discourse of each variable.
Validation of the shape and position in the universe of discourse of the fuzzy sets defined to the input and output variables in order to improve the system response Platform Validation, that is to identifying the programming problems that make the system not respond adequately. This process is done through the use of reference cases for which the analyst knows the answer. If the system does not reproduce these predefined answers it must be revised.
155
Figure 16. Fuzzy Surface 7.4.4 PLATFORM FOR MEASUREMENT EXPOSURE TO OPERATING LOSSES The proposed model was programmed with the fuzzy logic functions available in MATLAB. The platform developed to measure the exposure of the operational risk as a result of measuring the factors identified from experts, this in turn gives us the evaluation of higher level variables of system, using color coding to give warnings about the state of these variables, as shown in Figure 17.
Figure 17. FES Platform for measure the exposition to operative risk With the model developed, executive staff was asked to qualify the defined aspects related with the exposition of the operative risk and characterized by the inputs previously identified. The survey yielded the following results (figure 18):
156 Input Variables Regulatory stability Knowledge of regulations Dependency of other entities Knowledge Management Management of human talent technological platform Problems Planning Design and Development Standardization of processes Supply Management Information security Risk Administrations Strategic Management
1 0.7 0.7 0.5 0.9 0.7 0.7 0.7 0.8 0.8 0.6 0.7 0.7
2 0.3 0.5 0.5 0.95 0.95 0.5 0.9 0.95 0.8 0.99 0.99 0.95
3 0.5 0.5 0.5 0.7 0.8 0.7 0.8 0.7 0.9 0.6 0.8 0.9
4 0.3 0.3 0.3 0.65 0.3 0.6 0.8 0.7 0.8 0.6 0.7 0.7
5 0.5 0.2 0.4 0.2 0.2 0.4 0.4 0.4 0.2 0.3 0.3 0.1
6 0.5 0.7 0.6 0.9 0.9 0.5 0.7 0.8 0.8 0.9 0.9 0.9
prom. 0.47 0.48 0.47 0.72 0.64 0.57 0.72 0.73 0.72 0.67 0.73 0.71
Figure 18. Input Qualification by Executive staff 7.5 CONCLUSIONS The previous model can be applied to measure the executive staff’s perception about factors that expose the company to operative loss such as human factors, technologic factors, and processes factors, etc. That is, FES allows us to evaluate the activities of corporate structure in all aspects. FES allows the desegregations of detailed factors associated with activities of processes or sub processes in such a way that lets the manager improve the process of management control. Qualitative variables associated with operative risk can be identifying by expert opinions that manage and understand their process in all ranges of organizational structure. This information is modeling by FES. Therefore, the development of support systems to make decisions has more acceptances of the people, since the developed models are participative and intuitive. (The experts are building). All companies are exposed to risks, some of these are easy to avoid and measure, for others however, their quantification is more difficult; for this reason, the appropriate management should be search new methodologies to improve the management toward competitive results. FES presented in this article, will allow identifying and measuring factors that generate a bigger or lower exposition to operational risk and prioritize the necessary resources to improve the management. The manager can develop strategic activities that allow getting accepted levels of operative loss. With the purpose of lowers the possibility of operative loss, the companies can improve the risk management systems to promote the continuous improvement that allow to detect and to prevent the potential risks appropriately, also can be used insurance policy to cover the operative losses that can be materialized, the third alternative is transfer the risk through outsourcing agreement (transfer activities that bigger vulnerability and don't have a high added value), lastly the company can avoid carry out risks activities and that they don't affect the normal operation. An appropriate combination
157 of previous alternatives can be employees with the purpose of minimize the exposition levels to operative losses and guarantee the survival and growth of company. Future works that can be explored is the relationship between the statistical models used to measure operative value at risk VaR (POT Peak over threshold or Monte Carlo Simulation) and the FES model as proposed in this article. ¿How these models can be integrated? ¿how arrive to economic losses starting from the FES system?, is yet a question to be solved. Other subject that can be explored is the relationship between the Net Bayesian and a FES, both models capture the expert's knowledge by inputs but the Net Bayesian obtain as output a probability and the FES obtain a possibility, which is the relationship between both in a real problem, could be investigated.
REFERENCES Basel Committee on Banking Supervision (BASEL I). International convergence of capital measurement and capital standards. Julio de 1988. Basel Committee on Banking Supervision (BASEL II). Convergencia internacional de medidas y normas de capital. Junio de 2004. Basilea – Suiza. P – 228. Basel Committee on Banking Supervision (BASEL II).Sound practices for the management and supervisión of operational risk. Febrero de 2003. Basilea – Suiza. P – 12. Buckley J. Eslami E. (2002). An introduction to Fuzzy Logic and Fuzzy set. Physica Verlang. 2002 CHAVEZ-DEMOULIN, V.; EMBRECHTS, P. y NESLEHOVÁ, J. Quantitative models for operational risk: Extremes, dependence and aggregation. En: Journal of baking & Finance. 2006, pp. 2635 – 2658. CHERNOBAI, ANNA y RACHEV, Svetlozar. Applying robust methods to operational risk modeling. En: The Journal of operational risk. Vol. 1. Number 1. 2006. Chin K.S, Pun K.F, Lau H. Development of a knowledge-based self-assessment system for measuring organizational performance. Expert Systems with Applications 24 (2003) 443–455 Cornalba C, Giudici P.. Statistical models for operational risk management. En: Physica. 2004; pp. 166 – 172. Cruz G, Marcelo. Modeling, Measuring and heading Operational Risk. Estados Unidos: John Wiley & Sons, Ltd. 2002. 330 Pág. Cruz G, Marcelo. Operational Risk Modeling and Analyst: Theory and practice. London: Incisive Media Investments Limited –Book Risk-. 2004. Page 360.
158 Espinosa J, Vandewalle J. Constructing Fuzzy Models with Linguistic Integrity from Numerical Data-AFRELI Algorithm. IEEE TRANSACTIONS ON FUZZY SYSTEMS, VOL. 8, NO. 5, OCTOBER 2000 Glykas, M. and Xirogiannis, G. A soft knowledge modeling approach for geographically dispersed financial organizations, Soft Computing, Springer Berlin Heidelberg, vol. 9, no. 8, pp. 579-593. (2004) Hammell R, Sudkamp T. . Interpolation, completion, and learning fuzzy rules. IEEE transaction on systems. Man and cybernetics. Vol. 24 No.2 pg. 332-342 February 1994. Herrera F, Lozano M, J. L Verdegay. Generating Fuzzy Rules from Examples using Genetic Algorithms. Proc. IPMU'94 (5th Int. Conf. on Information Processing and Management of Uncertainty in Knowledge-Based Systems) 1995. Hull C. John. Options, Futures, and Other Derivatives, Seventh Edition. McGraw Hill. 2008. International Organization for Standardization (ISO). Draft: Risk management – Principles and guidelines on implementation (ISO 31000). 2008. P- 18. Jang, J., Mizutani, E. y Sun, C. (1997). Neuro-Fuzzy and Soft Computing: A Computional Approach to Learning and Machine Intelligence. Estados Unidos: Prentice Hall, 1997. 600p. JIMÉNEZ RODRIGUEZ, Enrique José y MARTÍN MARÍN, José Luis. El nuevo acuerdo de Basilea y la gestión del riesgo operacional. En: Universia Business Review – actualidad económica. Tercer trimestre del 2005, pp. 54 – 67. Kasabov, N. (1998). Foundations of Neural Networks, Fuzzy Systems and Knowledge Engineering. Estados Unidos: The MIT Press. 1998 Kaufman A, Gil Aluja J. (1990). Las matemáticas del azar y la incertidumbre. Elementos básicos para su aplicación en economía. Editorial Ramon Areces. Madrid 1990. Kaufman A. (1982) Introducción a la teoría de los subconjuntos borrosos. Elementos teóricos de Base. CECSA 1982 Kosko, B. (1994). Pensamiento Borroso. La nueva ciencia de la lógica borrosa. ed. Critica. Barcelona. (1994). Kulkarni, A. 2001. Computer Vision and Fuzzy-Neuronal Systems. Prentice Hall., 2001. Mamdani E. Gaines B. (1981). Fuzzy Reasoning and its applications. Publ. Academic Press. 1981 Mamdani E. H. (1977). Application on Fuzzy Logic to approximate reasoning using linguistic synthesis. IEEE Transactions on computers C26. Dic. 1977 pp.11821191. Männle M. Identifying Rule-Based TSK Fuzzy Models. Proceedings of EUFIT, p. 286f, Aachen, Germany, September 1999; Medina S. Diseño de un sistema de soporte para la negociación de contratos de energía eléctrica. Tesis de doctorado. Universidad Complutense de Madrid. Madrid enero 2007
159 Medina, S y Jaramillo, J. “Riesgo Financieros y Económicos” editorial Universidad de Medellín- Medellín -Colombia. 2009. P – 49-80 MOSCADELLI, Marco. The modeling of operational risk: experience with the analysis of the data collected by the Basel Committee. Julio de 2004. P – 72. REISS, R Y THOMAS, M. Statistical analysis of extreme values. 2001. 2a edition, Basel, Birkhauser. THE COMMITTEE OF SPONSORING ORGANIZATIONS OF THE TREADWAY COMMISSION (COSO). Administración de riesgos corporativos – Marco integrado. Diciembre de 2005. USA. P – 135. Trillas E. (1980). Conjuntos Borrosos. Ed. Vicens vives. 1980 Tsang E.C.C., Yeung D.S.. Modeling Fuzzy Production Rules with Fuzzy Expert Networks. Expert Systems With Applications, Vol. 13, No. 3, pp. 169-178, 1997 Vose, David. Quantitative Risk Analysis: A Guide to Monte Carlo Simulation Modeling. United States: John Wiley & Sons, Ltd. 1996. 328 Pág. Wang L. (1992). "Fuzzy systems are universal approximators. Proc. Of Int. Conf. On Fuzzy Engineering". (1992), 471-496. Wang L.X., Mendel J.M.. Generating Fuzzy Rules by learning from examples. IEEE Trans. Systems Man Cybernet. 22:1414-1427,1992 Wang X.Z., Wang Y.D, Xu X.F, Ling W.D, Yeung D.S. A New approach to Fuzzy Rule Generating: fuzzy extension matrix. Fuzzy Set and Systems 123 (2001) 291306 Wang Xizhao, Hong Jiarong. Learning Optimization in simplifying fuzzy rules. Fuzzy Set and Systems 106 (1999) 349-356 Xirogiannis, G. Chytas, P. Glykas, M. and Valiris, G. Intelligent impact assessment of HRM to the shareholder value. Expert Systems with Applications, Volume 35, Issue 4, , Pages 2017-203 November 2008 Xirogiannis, G. and Glykas, M. Intelligent Modeling of e-Business Maturity, Expert Systems with Applications, Vol 32/2 pp 687-702. (2007) Xirogiannis, G. and Glykas, M. Fuzzy Cognitive Maps in Business Analysis and Performance Driven Change. Journal of IEEE Transactions in Engineering Management, Volume 13, Issue 17. (2004) Zadeh L.A. (1968). Probability Measures of Fuzzy events. J. Math. Anal. Appl. 23, (1968) 421-427