Apr 12, 2013 - parts of the language generation problem. ...... WEATHER: Mainly cloudy with light rain showers becoming overcast around midnight. VIS(NM): ...
U NIVERSIDADE DE S ANTIAGO DE C OMPOSTELA Centro Singular de Investigaci´on en Tecnolox´ıas da Informaci´on
Tesis doctoral
APPLICATION OF FUZZY SETS IN DATA-TO-TEXT SYSTEMS
Presentada por: Alejandro Ramos Soto
Dirigida por: Alberto J. Bugar´ın Diz Sen´en Barro Ameneiro
16 de Junio de 2016
´ Alberto J. Bugar´ın Diz, Catedr´atico de Universidad del Area de Ciencias de la Computaci´on e Inteligencia Artificial de la Universidad de Santiago de Compostela ´ Sen´en Barro Ameneiro, Catedr´atico de Universidad del Area de Ciencias de la Computaci´on e Inteligencia Artificial de la Universidad de Santiago de Compostela
HACEN CONSTAR: Que la memoria titulada APPLICATION OF FUZZY SETS IN DATA-TO-TEXT SYSTEMS ha sido realizada por Alejandro Ramos Soto bajo nuestra direcci´on en el Centro Singular de Investigaci´on en Tecnolox´ıas da Informaci´on de la Universidad de Santiago de Compostela, y constituye la Tesis que presenta para optar al t´ıtulo de Doctor. 16 de Junio de 2016
Alberto J. Bugar´ın Diz
Sen´en Barro Ameneiro
Director de la tesis
Director de la tesis
Alejandro Ramos Soto Autor de la tesis
En memoria de Jos´e Soto Pereira Gracias por tus expectativas
Only those who will risk going too far can possibly find out how far one can go T.S. Eliot
Agradecimientos En primer lugar me gustar´ıa agradecer enormemente el trabajo que mis directores de tesis, Dr. Alberto J. Bugar´ın Diz y Dr. Sen´en Barro Ameneiro, han invertido a lo largo del desarrollo de esta tesis doctoral. Sin su implicaci´on a todos los niveles, estos cuatro a˜nos no habr´ıan llegado a tan buen puerto. As´ı mismo, me veo tambi´en en la obligaci´on de agradecer con la misma intensidad la confianza que han depositado en m´ı y la flexibilidad y libertad que me han brindado. He tratado de abusar de ella lo menos posible... A un nivel m´as general, me gustar´ıa agradecer al Departamento de Electr´onica y Computaci´on (especialmente al Grupo de Sistemas Inteligentes) y al Centro Singular de Investigaci´on en Tecnolog´ıas de Informaci´on (CiTIUS) la oportunidad que me han dado de formar parte de un grupo y centro de investigaci´on de excelencia conformados por profesores e investigadores del m´as alto nivel. Querr´ıa agradecer tambi´en la financiaci´on que me ha permitido primero empezar y posteriormente continuar y finalizar esta tesis doctoral. En primer lugar, los proyectos TIN200800040, TIN2011-29827-C02-02 y TIN2014-56633-C3-1-R del Ministerio de Econom´ıa y Competitividad. En segundo lugar, el programa de Formaci´on de Personal Investigador 2012, que, a trav´es de la beca BES-2012-051878, ha supuesto la base principal de financiaci´on de la presente tesis. Finalmente, incluyo en esta menci´on los proyectos EM2014/12 y CN2012/151 financiados por la Xunta de Galicia. A nivel acad´emico y profesional, mi m´as sincero agradecimiento a mis talentosos compa˜neros del Laboratorio S2, que propiciaron un entorno de trabajo muy agradable y divertido, sin que ello haya supuesto perjuicio alguno en el desarrollo de mi actividad. Me gustar´ıa tambi´en dar las gracias de forma expl´ıcita al Dr. F´elix D´ıaz Hermida, por su ayuda y por ser en parte el responsable de que ahora mismo escriba estas l´ıneas, as´ı como a Juan Taboada y Vicente P´erez por su inter´es, implicaci´on y ayuda. Por u´ ltimo, querr´ıa incluir en este agra-
10 decimiento acad´emico a los Prof. Ehud Reiter, Kees van Deemter y Somayajulu Sripada, y a todo el grupo de “Computational Linguistics” de la Universidad de Aberdeen (CLAN) por su fant´astica acogida y exquisito trato durante mi estancia de investigaci´on. Desde un punto de vista m´as personal, me gustar´ıa agradecer a mi familia todo el apoyo que me ha brindado durante este camino que decid´ı emprender en su momento. El hecho de que no sepan muy bien qu´e he estado haciendo durante todo este tiempo (me responsabilizo de esto) supone sin duda un enorme m´erito a˜nadido a este apoyo. Me gustar´ıa incluir en este agradecimiento personal a mis amigos Ad´an, Miguel, Jos´e Manuel (de latitudes m´as bajas), Dami´an, Lydia y, por extensi´on, a todos aquellos que pueda omitir y que han contribuido de forma positiva a esta etapa. Finalmente, termino dedicando este trabajo y agradeciendo de coraz´on a Diana, verdadera coautora en las sombras de esta tesis doctoral, su cari˜no y comprensi´on, as´ı como su inconmensurable esfuerzo en todas las facetas de la vida, ayud´andome en cada instante a alcanzar esta meta. Gracias por estar siempre ah´ı. 16 de Junio de 2016
Resumen Vivimos sumergidos en una cantidad ingente de datos procedentes de muy diversos a´ mbitos. No s´olo gobiernos y empresas, sino incluso hasta los m´as diminutos dispositivos que nos rodean son capaces de generar gran cantidad de datos que requieren una interpretaci´on para ser u´ tiles como informaci´on y poder generar conocimiento. Sin embargo, en muchas ocasiones dicha interpretaci´on no es sencilla. En este sentido, la ciencia computacional, y lo que hoy se conoce como ciencia de datos (“Data Science“) ha utilizado tradicionalmente m´etodos anal´ıticos y t´ecnicas de visualizaci´on para la interpretaci´on de grandes vol´umenes de datos. Los analistas de datos (“data scientists”), se apoyan en t´ecnicas como la estad´ıstica tradicional, procesado de se˜nal, reconocimiento de patrones, miner´ıa de datos o aprendizaje autom´atico, entre otros, para extraer informaci´on relevante a partir de los datos. Sin embargo, la comunicaci´on de la informaci´on extra´ıda en el proceso de an´alisis se hace normalmente a trav´es de gr´aficos o t´ecnicas de visualizaci´on que obligan a un esfuerzo interpretativo por parte de los usuarios, y que en ocasiones requieren incluso de un conocimiento acad´emico y/o experto avanzados para dicha comprensi´on. Este problema motiva la b´usqueda de otro tipo de t´ecnicas descriptivas complementarias que permitan cubrir el espacio que actualmente existe entre datos y usuarios de un modo mejor adaptado a las necesidades de las personas, de tal forma que la informaci´on obtenida en la fase de an´alisis pueda ser entendida por un conjunto m´as amplio de usuarios, independientemente de su nivel de conocimiento y pericia. En concreto, la comunicaci´on de informaci´on en lenguaje natural a los usuarios finales surge como una de las v´ıas m´as apropiadas para la consecuci´on de este objetivo. Dicha tarea se investiga actualmente desde la disciplina de generaci´on de lenguaje natural (NLG), aunque tambi´en es tratada en menor medida y con una perspectiva m´as cercana a los datos desde la teor´ıa de conjuntos borrosos y su aplicaci´on en la generaci´on de las denominadas “descripciones ling¨u´ısticas de datos” (LDD).
12 El campo de generaci´on de lenguaje natural (NLG) [101] trata el problema de la creaci´on autom´atica de informaci´on en forma de textos en lenguaje natural desde un punto de vista ling¨u´ıstico-computacional. Durante las u´ ltimas tres d´ecadas (1980-2010) han surgido numerosos sistemas NLG para prop´ositos muy distintos (por ejemplo, narraci´on de historias [52], di´alogo en sistemas interactivos [60], resumen de datos [134, 88], y resumen de texto [80], entre otros); y en dominios de aplicaci´on muy diversos (salud [103, 88, 58], sistemas de informaci´on ambiental [19], meteorolog´ıa [26], industria [134], gesti´on de proyectos [127], educaci´on [53], etc.). Entre las diversas aproximaciones existentes dentro de la NLG, destaca especialmente la rama especializada en la generaci´on de textos a partir de conjuntos de datos num´ericos, conocida como “data-to-text” (D2T) [98], que en los u´ ltimos tiempos est´a experimentando un importante auge cient´ıfico y comercial debido a la cada vez mayor cantidad de datos que los expertos deben manejar e interpretar en sus respectivos dominios. A pesar de resultar una tarea mundana en ocasiones, la producci´on de textos que resuman en unos pocos p´arrafos lo que anteriormente eran enormes conjuntos de datos es una necesidad habitual en cualquier empresa u organizaci´on. En este sentido, los sistemas D2T ayudan a los analistas, expertos y usuarios a un ahorro importante de tiempo y esfuerzo mediante la combinaci´on de an´alisis de datos y la generaci´on de informaci´on textual relevante a partir de los mismos. Uno de los principales retos en la investigaci´on en NLG y D2T es el modelado de imprecisi´on e incertidumbre inherente al lenguaje humano. Resulta certero adem´as apuntar que no existe ning´un sistema comercial NLG que incluya t´ecnicas que administren este tipo de situaciones [98], si bien el problema de la vaguedad en el lenguaje es algo que s´ı se ha investigado desde NLG [119, 120, 89, 87]. En paralelo a la NLG, el uso de t´ecnicas derivadas de la teor´ıa de conjuntos borrosos para la obtenci´on de informaci´on ling¨u´ıstica relevante que al mismo tiempo permite administrar la imprecisi´on e incertidumbre en el lenguaje dio lugar a un conjunto relativamente extenso de trabajos de investigaci´on agrupados en lo que se conoce como descripci´on ling¨u´ıstica de datos (LDD). Este tipo de procesos pueden definirse como una tarea de obtenci´on de informaci´on ling¨u´ıstica basada en expresiones compuestas por t´erminos imprecisos, cuya definici´on viene dada por conjuntos borrosos. Dichos conjuntos permiten representar la imprecisi´on e incertidumbre inherente al lenguaje humano a trav´es de un marco l´ogico en el que el valor de verdad de un t´ermino o expresi´on dado no se limita al “Verdadero” o “Falso” de la l´ogica booleana, sino que puede tomar valores reales dentro del intervalo num´erico [0,1].
13 En este sentido, el uso m´as extendido de este tipo de t´ecnicas para extraer informaci´on ling¨u´ıstica se centra en las sentencias cuantificadas borrosas, “Q Xs son A” [141], tales como “La mayor parte de los d´ıas fueron lluviosos”. Este tipo de expresiones se han utilizado para resumir y describir series de datos num´ericos. Sin embargo, D2T cubre todo el proceso de generaci´on de lenguaje natural desde los datos al texto final, mientras que en LDD se genera informaci´on que, si bien abstrae los datos en forma de expresiones interpretables, est´a lejos del nivel de refinamiento que requiere un lenguaje adaptado al usuario final. En este escenario, surge el inter´es de integrar el uso de t´ecnicas borrosas y NLG [64]. Esta idea viene motivada precisamente por la necesidad en LDD de poder adaptar las expresiones ling¨u´ısticas extra´ıdas para un uso aplicado y real, lo que ha llevado a una gran mayor´ıa de investigadores en esta l´ınea de trabajos a adoptar t´ecnicas sencillas de generaci´on de lenguaje natural basadas en plantillas [74, 22, 122, 107]. Al mismo tiempo, el inter´es de NLG en el tratamiento de la imprecisi´on y vaguedad hace que las t´ecnicas borrosas resulten a priori adecuadas para esta tarea. En cierto modo resulta sorprendente que estas disciplinas no hayan interaccionado con anterioridad, pero dicha separaci´on puede ser explicada, al menos parcialmente, por la oposici´on entre la naturaleza m´as te´orica de los conjuntos borrosos, mucho m´as centrada en t´opicos de ´ındole l´ogica, y la naturaleza m´as aplicada de NLG, centrada en problemas ling¨u´ısticos de perfil m´as emp´ırico. En este contexto, el estado actual de ambos campos ha conducido a un clima de inter´es mutuo. Las aproximaciones LDD pueden beneficiarse de las t´ecnicas de NLG para convertir proto-expresiones en informaci´on completamente textual y entendible. Del mismo modo, NLG y D2T pueden aprovechar el potencial de las t´ecnicas borrosas para tratar el problema de la vaguedad e imprecisi´on a distintos niveles dentro de las diferentes tareas involucradas en el proceso de generaci´on de lenguaje. [101, 98]. La presente tesis doctoral tiene como objetivo el estudio de la integraci´on de t´ecnicas borrosas (en concreto, aquellas utilizadas en LDD) en sistemas D2T-NLG, de modo que abra la posibilidad a mejorar las aproximaciones actualmente existentes en D2T-NLG mediante la introducci´on del manejo de informaci´on imprecisa en dicho campo. Concretamente, en esta tesis se plantean los siguientes objetivos:
a) Estudiar la viabilidad de usar t´ecnicas borrosas para extraer informaci´on ¨ ıstica en casos de uso reales. lingu´ En particular, estudiar la aplicaci´on de t´ecnicas como sentencias cuantificadas para ex-
14 traer informaci´on y determinar hasta qu´e punto pueden ser suficientes para proporcionar informaci´on a usuarios finales.
b) Determinar c´omo los conjuntos borrosos pueden usarse en contextos D2TNLG. Dado el inter´es de usar conjuntos borrosos para modelar imprecisi´on e incertidumbre en NLG, debe realizarse una profunda exploraci´on de ambos campos que incluya: • Un estudio concienzudo del estado del arte actual, tanto para LDD como NLG. • Identificar problemas e inconvenientes de NLG y LDD, con una mayor incidencia en LDD debido a su menor recorrido y desarrollo. • Identificar y estudiar en qu´e puntos NLG puede beneficiarse del uso de conjuntos borrosos y LDD.
c) Aplicaciones. Desarrollar aplicaciones pr´acticas que hagan uso de t´ecnicas borrosas de LDD y que proporcionen informaci´on como textos en lenguaje natural. Esto involucra: • Identificar casos de uso donde exista una necesidad real de uso de soluciones D2T/NLG. • Identificar aspectos concretos de dichos casos de uso donde resulta viable usar conjuntos borrosos. • Evaluar las estrategias usadas para cada dominio de aplicaci´on de forma exhaustiva, con el fin de asegurar la validez de cada aproximaci´on y su despliegue.
d) Un modelo para la creaci´on de aproximaciones de LDD en un contexto de NLG. Otro objetivo importante de esta tesis doctoral reside en la consecuci´on de un marco gen´erico y modelo que considere y abarque las t´ecnicas borrosas m´as comunes y u´ tiles para extracci´on de informaci´on ling¨u´ıstica. En particular, el modelo deber´ıa: • Ser capaz de caracterizar cualquier aproximaci´on LDD en un contexto de generaci´on de lenguaje natural.
15 • Considerar toda la expresividad presente en las t´ecnicas LDD, lo cual incluye las sentencias cuantificadas tipo-I y tipo-II, pero tambi´en extensiones que soporten expresiones temporales y espaciales. • Considerar c´omo se construyen las descripciones ling¨u´ısticas de datos en la literatura, incluyendo tipos de algoritmos y criterios de evaluaci´on. • Incorporar elementos extra´ıdos de la experiencia acumulada en el desarrollo de las aplicaciones D2T enmarcadas en el trabajo de tesis. • Ser incremental y extensible, permitiendo la incorporaci´on de nuevos tipos de expresiones construidos a partir de elementos m´as simples. • Ser implementable como una herramienta software que pueda ser usada en la creaci´on de soluciones LDD aplicadas. Dichos objetivos se materializaron en varias contribuciones importantes, que dieron lugar a tres publicaciones en revistas JCR (una de ellas, en la revista IEEE Transactions on Fuzzy Systems, actualmente 1/130 en el JCR 2015, Categor´ıa: CS/AI) y varios trabajos en congresos CORE A y B. Esta memoria de tesis doctoral recoge las contribuciones m´as importantes del trabajo de investigaci´on y desarrollo llevado a cabo en el contexto de la integraci´on de LDD en NLG, que comprende los cap´ıtulos descritos a continuaci´on. En primer lugar, una revisi´on exhaustiva del estado del arte, proporcionada en el cap´ıtulo 2, que cubre tanto el campo de generaci´on de lenguaje natural como la aplicaci´on de conjuntos borrosos para la descripci´on ling¨u´ıstica de datos. La disciplina de NLG se describe desde distintas perspectivas, que incluyen una explicaci´on de conceptos b´asicos y arquitecturas, ejemplos de sistemas de NLG, su orientaci´on comercial, y otros conceptos relevantes tales como las tareas de evaluaci´on y el manejo de incertidumbre e imprecisi´on en el lenguaje. Este u´ ltimo elemento motiva y sirve de enlace a la revisi´on de LDD, en la que se describen los conceptos y las ideas originales que condujeron a la aplicaci´on de la teor´ıa de conjuntos borrosos para la extracci´on de informaci´on ling¨u´ıstica que permite modelar la imprecisi´on e incertidumbre en el lenguaje, as´ı como casos de uso propuestos en la literatura. Finalmente se proporcionan algunos posibles puntos de convergencia entre ambos campos, que permiten resaltar la importancia de la contribuci´on del resto de cap´ıtulos al objetivo de esta tesis. El cap´ıtulo 3 describe un modelo computacional basado principalmente en experiencia pr´actica (descrita en los cap´ıtulos 4 y 5), t´ecnicas generales de LDD y la idea de percepci´on computacional. Dicho modelo permite el dise˜no y la realizaci´on de tareas de determinaci´on
16 de contenido NLG en un contexto data-to-text. Los conceptos y la terminolog´ıa usada se inspiran en ideas filos´oficas sobre el problema de la percepci´on. Dicho modelo permite construir expresiones incrementales que cubren las protoformas borrosas est´andar “Q Xs son A”, pero tambi´en proporcionan un marco de trabajo que caracteriza c´omo las aproximaciones de LDD pueden estructurarse y ser implementadas. Adicionalmente, se incluye un caso de uso ilustrativo del modelo, en el que un problema de determinaci´on de contenido es modelado utilizando los elementos definidos en la propuesta descrita. Los cap´ıtulos 4 y 5 presentan dos aplicaciones D2T desarrolladas en el marco de esta tesis doctoral, que adem´as sirvieron como experiencias pr´acticas para la concepci´on del modelo descrito en el cap´ıtulo 3. El cap´ıtulo 4 describe en detalle la concepci´on, dise˜no, implementaci´on y evaluaci´on del sistema GALiWeather, una aplicaci´on D2T que es capaz de generar predicciones meteorol´ogicas textuales para varias variables de inter´es. Dicha soluci´on fue desarrollada para cubrir una necesidad real del servicio gallego de meteorolog´ıa (MeteoGalicia), que requer´ıa de un medio para proporcionar predicciones escritas a los 314 ayuntamientos gallegos, debido a la imposibilidad, por razones de esfuerzo y tiempo, de elaborarlas por parte de los meteor´ologos. GALiWeather es un caso de aplicaci´on real en el que el uso de t´ecnicas de la teor´ıa de conjuntos borrosos permiti´o cerrar el proceso de modelado del dominio. Concretamente, los expertos meteor´ologos no dispon´ıan de una definici´on exacta del lenguaje ni el conocimiento requeridos para describir la variable meteorol´ogica de cobertura nubosa. Para ello, GALiWeather utiliza conjuntos borrosos para modelar etiquetas temporales y computar expresiones cuantificadas borrosas, con el fin de obtener informaci´on cualitativa que describe la cobertura nubosa mediante distintas aproximaciones. El resto de variables meteorol´ogicas se procesan de forma similar, pero utilizan definiciones n´ıtidas (intervalos num´ericos y categor´ıas de s´ımbolos). Este conjunto de operadores borrosos y n´ıtidos permiten obtener una descripci´on ling¨u´ıstica de las variables de entrada. En una fase posterior, las descripciones ling¨u´ısticas intermedias son convertidas en textos mediante el uso mixto de plantillas y l´ogica espec´ıfica que realiza tareas de agregaci´on para acortar las sentencias generadas y proporcionar textos de predicci´on breves, concisos y precisos. GALiWeather fue evaluado por un meteor´ologo experto mediante el uso de t´ecnicas de evaluaci´on que miden la calidad de los textos, tanto en lo que respecta a su contenido como a la calidad ling¨u´ıstica de los mismos. Este sistema fue desplegado en Mayo de 2015 en
17 MeteoGalicia y lleva en servicio desde entonces, generando diariamente predicciones meteorol´ogicas textuales a corto plazo para todos los ayuntamientos gallegos. En este sentido, GALiWeather es la primera aplicaci´on D2T desplegada en un entorno real que utiliza t´ecnicas borrosas. El cap´ıtulo 5 detalla un servicio D2T denominado SoftLearn Activity Reporter (SLAR), desarrollado como complemento a una plataforma de anal´ıticas de aprendizaje (learning analytics). Dicho servicio genera peque˜nos informes sobre la actividad de los estudiantes en SoftLearn, una plataforma de aprendizaje en l´ınea. SLAR utiliza una estrategia similar a GALiWeather, en la que un conjunto de operadores extrae informaci´on ling¨u´ıstica y num´erica relevante a partir de series temporales de datos de actividad. Dicha informaci´on es utilizada para generar informes textuales mediante el uso de plantillas de texto. SLAR fue probado con datos reales generados por 72 estudiantes del curso de Tecnolog´ıa Educativa del Grado en Pedagog´ıa de la Facultad de Educaci´on de la Universidad de Santiago de Compostela. Posteriormente se llev´o a cabo una evaluaci´on del sistema en la que una pedagoga experta evalu´o la calidad de 20 informes producidos por el servicio de forma autom´atica sobre datos de estudiantes con perfiles de actividad heterog´eneos. Los resultados muestran que los informes generados autom´aticamente por SLAR con una herramienta complementaria valiosa para explicar tanto a profesores como estudiantes la informaci´on comprendida en un panel de mandos de anal´ıticas de aprendizaje. Finalmente, el cap´ıtulo 6 resume las principales contribuciones de esta tesis doctoral retrospectivamente y proporciona reflexiones adicionales sobre posibles extensiones al trabajo presentado, que abren varias propuestas prometedoras de l´ıneas de investigaci´on en el contexto del uso de conjuntos borrosos en D2T-NLG. En este sentido, y teniendo en cuenta las distintas perspectivas de ambas disciplinas, la l´ınea de investigaci´on seguida en esta tesis puede expandirse por muchas v´ıas. Concretamente, desde un punto de vista LDD, adem´as de la importancia y el claro beneficio de NLG para poder convertir la informaci´on ling¨u´ıstica imprecisa en textos aptos para el consumo humano, aparecen otros posibles aspectos mejorables que, mediante la adopci´on de metodolog´ıas y t´ecnicas est´andar en NLG, permitir´an acercar todav´ıa m´as a LDD a un uso generalizado en aplicaciones reales. Entre ellos destacan el uso de t´ecnicas emp´ıricas para la definici´on de los t´erminos y expresiones a utilizar en cada aproximaci´on que se deba llevar a cabo, lo que implica que, en el caso de LDD, deben buscarse f´ormulas y m´etodos que permitan, por ejemplo, definir conjuntos borrosos en base a experimentaci´on o determinar qu´e
18 operadores de agregaci´on son los m´as id´oneos para generar expresiones m´as complejas. As´ı mismo, LDD puede inspirarse en las relaciones de discurso utilizadas en NLG, tales como las relaciones de contraste o enf´aticas, para proponer nuevos tipos de expresiones que puedan ser modeladas y computadas mediante t´erminos y operadores de naturaleza borrosa. Desde una perspectiva de D2T/NLG, en la tesis queda claramente reflejado que el uso de t´ecnicas borrosas en esta disciplina responde principalmente a un uso pegado a la extracci´on y tratamiento de contenido. Sin embargo, el uso de t´erminos y expresiones cuya sem´antica no s´olo viene determinada por el propio t´ermino, sino que incluye adem´as un grado de verdad en [0,1], tiene ciertas implicaciones que pueden afectar a todo el proceso de generaci´on de lenguaje, lo que conlleva a considerar un uso de t´ecnicas borrosas todav´ıa m´as extenso de lo que cabr´ıa considerar inicialmente. Entre estas posibles v´ıas de estudio se incluyen: • La lexicalizaci´on (elecci´on de t´erminos y palabras en NLG), en la que el estudio de la influencia de los grados de pertenencia borrosos aparece como un problema interesante. • La agregaci´on de expresiones ling¨u´ısticas con el fin de evitar repetitividad y proporcionar textos m´as fluidos, que en NLG se realiza desde una perspectiva sint´actica, puede ser tratada en contextos D2T a nivel de contenido mediante el uso de operadores de agregaci´on borrosos, abriendo una v´ıa importante de estudio. • La generaci´on de expresiones de referencia, que trata el problema de identificar ciertas entidades en el discurso generado, aparece como una extensi´on natural del uso de conjuntos borrosos en tareas de determinaci´on de contenido, en el que el uso de propiedades borrosas requerir´a la adaptaci´on de algoritmos y m´etricas est´andar de generaci´on de expresiones de referencia. El prop´osito final de la integraci´on de t´ecnicas borrosas en D2T-NLG es proporcionar sistemas que, en el contexto de la ciencia de datos, generen informaci´on mejor adaptada a las necesidades de las personas en forma de textos en lenguaje natural, administrando al mismo tiempo la vaguedad e imprecisi´on incluida en la sem´antica subyacente en dicha informaci´on. En este sentido, los sistemas D2T, tanto de forma aut´onoma como utilizados complementando sistemas de visualizaci´on, permitir´an mejorar la interpretaci´on de grandes conjuntos de datos en multitud de dominios de aplicaci´on, reduciendo de este modo la gran distancia actualmente existente entre datos y personas.
Contents
1
2
3
4
5
Introduction
1
1.1
Motivation . . . . . . . . . . . . . . . . . . . . . . . . . . . . . . . . . . . .
1
1.2
Objectives . . . . . . . . . . . . . . . . . . . . . . . . . . . . . . . . . . . .
6
1.3
Contributions . . . . . . . . . . . . . . . . . . . . . . . . . . . . . . . . . .
8
1.4
Dissertation structure . . . . . . . . . . . . . . . . . . . . . . . . . . . . . .
13
State of the art
15
2.1
Natural Language Generation . . . . . . . . . . . . . . . . . . . . . . . . . .
16
2.2
Linguistic Descriptions of Data . . . . . . . . . . . . . . . . . . . . . . . . .
33
2.3
General remarks about the integration of fuzzy techniques into NLG . . . . .
41
A model based on computational perceptions for content determination in data-to-text contexts
43
3.1
Preliminary considerations . . . . . . . . . . . . . . . . . . . . . . . . . . .
44
3.2
Model description . . . . . . . . . . . . . . . . . . . . . . . . . . . . . . . .
46
3.3
An illustrative example . . . . . . . . . . . . . . . . . . . . . . . . . . . . .
52
3.4
Remarks about the model . . . . . . . . . . . . . . . . . . . . . . . . . . . .
56
GALiWeather: A textual weather forecast generation system
59
4.1
Short-term web forecasts for Galicia . . . . . . . . . . . . . . . . . . . . . .
60
4.2
Application description . . . . . . . . . . . . . . . . . . . . . . . . . . . . .
62
4.3
Evaluation and results . . . . . . . . . . . . . . . . . . . . . . . . . . . . . .
78
4.4
GALiWeather as a real service . . . . . . . . . . . . . . . . . . . . . . . . .
85
SLAR: A data-to-text service for verbalizing a learning analytics dashboard
87
ii
6
Contents 5.1
Complementing learning analytics with textual information . . . . . . . . . .
87
5.2
The SoftLearn platform . . . . . . . . . . . . . . . . . . . . . . . . . . . . .
89
5.3
SLAR: D2T in SoftLearn . . . . . . . . . . . . . . . . . . . . . . . . . . . .
91
5.4
Report Examples and Evaluation of SLAR . . . . . . . . . . . . . . . . . . .
98
5.5
SLAR for LDD+D2T . . . . . . . . . . . . . . . . . . . . . . . . . . . . . . 104
Conclusions 6.1
107
Beyond this PhD thesis . . . . . . . . . . . . . . . . . . . . . . . . . . . . . 108
Bibliography
115
List of Figures
131
List of Tables
135
C HAPTER 1
I NTRODUCTION 1.1
Motivation
Nowadays data is more accessible than ever and floods all aspects of our daily lives. For instance, governments and agencies from many countries have increasingly focused their efforts on improving the accessibility of their citizens to public data, i.e., all the data that public bodies in a given country produce, collect or pay for, which is widely known as the Open Data paradigm [31]. These resources, which come from many different fields of knowledge, offer a high potential for re-use in new products and services. Likewise, business companies and organizations have to deal with vast volumes of data produced or obtained from many different sources. However, in many occasions such data is hard to interpret. In this regard, Data Science has traditionally relied on analytics and visualization techniques to make sense of large volumes of data. Data scientists employ different techniques such as statistics, signal processing, pattern recognition, data mining or machine learning among others to extract relevant information from such amounts of data. Nevertheless, communication of the extracted information after the analytics process is usually made through graphics or visualization techniques which usually demand interpretation efforts from the user side and sometimes require a rather extensive academic development or expertise for its actual comprehension. This issue motivates the interest of using other kind of complementary descriptive techniques which help fill the gap between data and users in a more human-friendly way, so that the obtained information can be grasped by a wider range of people regardless of their expertise. Such techniques are focused on delivering linguistic information to end users, and are
2
Chapter 1. Introduction
encompassed by the field of natural language generation and the application of fuzzy sets for producing linguistic descriptions of data.
1.1.1
Natural language generation
Natural language generation (NLG) addresses the process of generating information in the form of natural language texts. This discipline emerged as a feasible complement which, while still exploiting the full potential of standard Data Science analytics, allows for a better understanding of what underlies in such data. In this regard, a recent study [112] indicates that non-specialized users actually strongly demand textual descriptions of data as a means for better understanding of graphics and visualizations. Many NLG systems emerged over the last three decades for very different purposes (e.g. narrate stories [52], dialog in interactive systems [60], data summarization [134, 88], and text summarization [80], among others) and application domains (health [103, 88, 58], environmental information systems [19], industry [134], project management [127], education [53], etc.). Particularly, NLG systems focused on generating texts from numeric data, commonly known as data-to-text (D2T) systems [98], are currently experiencing a bursting scientific, technical and commercial expansion due to the rise of the Big Data era. The more data is available, the more time experts and users need to make sense of it and, while it may often be a mundane task, the creation of reports that describe in a few paragraphs what in origin were huge amounts of data is usually necessary in any organization. In this regard, D2T solutions help analysts, experts and users in general in saving time by performing data analysis and delivering relevant information as high quality texts. In a general sense, an NLG system converts some kind of input source (numeric data, text, images, video, audio, etc.) into an output text. Different architectures have been proposed in the literature to characterize this process [101, 75, 98], although the pipeline architecture proposed by Reiter and Dale in [101] is the most widely known and accepted, as it depicts NLG as composition of different subtasks which interact among them to address different parts of the language generation problem. In this regard, the D2T architecture [98] adapts the standard NLG architecture to problems where raw numeric data is the input source of the system. Thus, D2T clearly fits into the problem of Data Science, as it distinguishes domaindependent tasks related to processing and analyzing data to extract relevant information from more generic tasks related to the problem of actually generating the output texts.
1.1. Motivation
1.1.2
3
Linguistic summarization or description of data
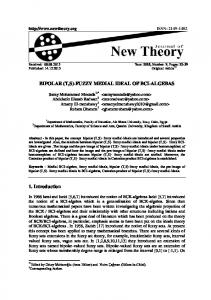
In parallel to natural language generation, the use of fuzzy sets and fuzzy logic as tools for obtaining meaningful linguistic information from data which also supports uncertainty management allowed the emergence of an extensive research work focused on the generation of what are commonly known as “linguistic descriptions of data” (LDD) [74]. The creation process of a linguistic description can be defined as the task of extracting the relevant information from some input data by producing an abstraction composed of linguistic imprecise terms, which are defined by means of fuzzy sets. Fuzzy sets allow to represent the uncertainty and imprecision in human language, and provide a logic framework where the truth value of a given concept or expression is not limited to the classical boolean logic “True” or “False” values, but is rather given by a function (membership function) which assigns real values in the numeric interval [0,1] (Fig. 1.1).
Figure 1.1: Fuzzy sets allow to numerically model imprecise definitions of linguistic concepts.
The main elements used to create linguistic descriptions include: • Linguistic variables, which are defined on the numeric domain of the input variables as a set of fuzzy sets which label or categorize that domain. For example, for an input variable “temperature” an associated linguistic variable can be defined as a fuzzy set partition “very cold”,“cold”,“mild”,“warm”,“hot”. Each label in a linguistic variable
4
Chapter 1. Introduction is associated to a mathematical fuzzy definition in the form of a membership function [138] (see Fig. 1.1). • Fuzzy quantifiers, in both absolute and relative terms, such as “a few”, “most”, “several”, “about ten”, etc. These are also defined via fuzzy membership functions. • Aggregation operators, which allow to compose linguistic terms to create more complex expressions (e.g. “cold and wet” or “young or tall”). • Evaluation criteria. The use of linguistic variables and quantifiers allows to produce different combinations which produce a certain number of candidate descriptions. In order to discriminate the most appropriate descriptions several criteria can be applied, such as the data coverage degree, the sentence fulfillment degree, the relevance and the description length. These elements permit the construction of linguistic descriptions, which in the litera-
ture usually adopt the form of fuzzy quantified statements [132]. These are classified using Zadeh’s notion of protoform [141]. In this regard, two basic protoforms are distinguished “Q Xs are A”
(1.1)
“Q DXs are A”
(1.2)
where Q is a fuzzy quantifier, A is a summarizer and D is a qualifier (both A and D can be a fuzzy label or a composition of fuzzy labels through the use of aggregation operators). These protoforms are also a representation of fuzzy quantified statements commonly referred to as type-1 (Eq. 1.1, “a few researchers are young” or “some of the humidity values were high”) and type-2 (Eq. 1.2, “most of the cold days were very humid”). Such quantified sentences can be computed through the use of a fuzzy quantification model [40]. From this base, the complexity of the linguistic descriptions can be increased by considering the relationship between two or more variables or adding elements such as spatio-temporal references. Other approaches are based on the use of type-2 fuzzy sets [81, 82]. These allow to define single linguistic labels using different membership functions (e.g. to model divergent opinions from different experts), although the complexity of this kind of approaches is higher from both a conceptual and computational point of view.
1.1. Motivation
5
In order to handle the imprecision defined in the linguistic variables and quantifier partitions, the algorithms employed in LDD approaches generate all possible sentence combinations to create candidate descriptions. Then, candidates are ranked and accepted or discarded according to previously defined evaluation criteria (at least, the truth value or fulfillment degree of each candidate). In this sense, this process can be deemed as a goal-driven search problem, where only the fittest descriptions are considered in the end. Consequently, both heuristic (e.g. [92], [22]) and meta-heuristic (e.g. [24], [44]) approaches can be used to address the linguistic description search process. Content Q Xs are A Most of coming days are cloudy Most of the coming days will be cloudy The skies will be predominantly cloudy for the coming short-term period Language
Figure 1.2: Contrast between protoform-like linguistic information and an actual natural language text ready for human comsumption by general public.
Fuzzy quantified statements in the literature have been used to a great extent as a means to summarize and describe time series of data [74]. In this sense, the application of fuzzy sets for generating linguistic descriptions of data bears a strong resemblance to what D2T approaches do: to provide an understandable interface between the data and the human users in the form of information expressed in terms of natural language. However, data-to-text is aimed at the production of actual texts, while linguistic description of data remains in a more conceptual level. Figure 1.2 illustrates this contrast between both fields: while it is feasible to obtain a linguistic description which summarizes a data set properly, it is arguably useful for a human user if such linguistic information is not given in a way that matches the language used in the user’s specific application domain.
6
Chapter 1. Introduction
1.1.3
D2T-NLG and LDD
Both NLG and fuzzy sets theory fields were developed in a parallel and independent way, totally unaware of each other until recent times, when interest in a potential relationship between these disciplines was raised by researchers from the fuzzy sets field focused on linguistic descriptions of data [64]. This was mainly motivated by the need for a means to use effectively the fuzzy techniques developed for generating linguistic descriptions in practical application domains. As a result, many researchers that follow this research line have proposed practical cases where text generation has also been considered [74]. However, it is also safe to assume that current D2T solutions do not include any uncertainty or vagueness management [98]. In fact, although NLG (and D2T by extension) excels in terms of generating texts whose quality is optimal from a linguistic perspective, the problem of how to address vagueness is still an open issue which is being actively researched in this discipline [119, 120, 89, 87]. In this regard, fuzzy sets and derived applications such as linguistic description of data are intuitively appropriate for this task. It is not clear why such approaches have not been explored thoroughly yet, but this unawareness may be partially explained by the opposition between the traditional theoretical nature of the fuzzy field, more focused on its logical aspects, and the more applied nature of NLG, focused on linguistic problems of a more empirical weight. In this context, the current state of both fuzzy sets and NLG fields has led to a climate of mutual interest. LDD approaches may use NLG techniques to convert linguistic protoforms into information in an even more human-friendly state, which allows the delivery of high quality texts. Likewise, NLG systems may use fuzzy-related techniques to address the problem of vagueness and imprecision at different levels within the distinct tasks involved in an NLG process [101, 98].
1.2
Objectives
The objectives encompassed by this PhD thesis dissertation share the aim of researching and encouraging a potential integration between LDD and D2T:
a) Studying the feasibility of using LDD techniques in applied use cases. In particular, studying the application of fuzzy set techniques to extract linguistic information and also studying to which extent these alone may suffice to provide proper
1.2. Objectives
7
information to end-users. Additionally, analyzing knowledge representation needs in some application domains for building grammars or style guidelines that describe the syntax and semantics of the descriptions of interest.
b) Determine how fuzzy sets can be used in D2T-NLG. Given the interest of using fuzzy sets to model vagueness and imprecision in NLG, a proper exploration of this problem should be performed. This includes: • Exploring thoroughly the current state of the art of both LDD and NLG research fields. • Identifying current issues with the sole application of LDD in real problems. • Identifying and studying how NLG can benefit from the use of fuzzy sets.
c) Applications. Develop practical applications that make use of fuzzy techniques and deliver information in the form of natural language texts. This involves: • Identifying use cases where there is an actual need of using D2T/NLG solutions. • Identifying aspects of the problems to address where using fuzzy sets/LDD is feasible. • Evaluating the strategies used for each application domain addressed should also be considered and performed in an exhaustive way, to ensure the validity of each approach.
d) A model for the creation of LDD approaches in an NLG-aware context. Another important objective of this thesis is to achieve a generic framework and model, which considers and encompasses the most useful LDD techniques. Particularly, the model should: • Be able to characterize LDD aproaches in an NLG-aware context. • Consider all the expressiveness LDD techniques currently allow. This includes type-I and type-II quantified sentences, but also extensions involving time and space features.
8
Chapter 1. Introduction • Consider how LDD are produced in the literature, including algorithms and evaluation criteria. • Incorporate elements taken from the experience accumulated in the development of applied approaches. • Be incremental and extensible, so that new types of expressions can be incorporated based on simpler elements. • Be implementable as a software tool which can be used in the creation of applied LDD solutions.
1.3
Contributions
The main contributions of this PhD dissertation are as follows: • A thorough state-of-the-art exploration of the current state of the task of generating easily understandable information from data for people using natural language [91], including both natural language generation and linguistic descriptions of data field, which includes: 1. A methodological revision of both fields including basic concepts and definitions, models and evaluation procedures. 2. The most relevant systems, use cases and real applications described in the literature. 3. A discussion of potential convergence points. • A general model for building LDD solutions [96]. The elements in the model aim to consider the richness and complexity that real LDD processes are endowed with and their actual role in data-to-text natural language generation (D2T-NLG) systems. In this regard, the model considers and addresses: – How LDD can be used to extract linguistic information from data sets, with a special focus on time and spatial series data. – How real-life concepts should be considered in an LDD process, including the application context, the entities which are the objects of description, and the actors which produce the descriptions.
1.3. Contributions
9
– A general and flexible methodology which can be followed to implement linguistic descriptions of data algorithms. – An incremental hierarchical model of generic linguistic expressions which can be used to extract different kinds of linguistic information. Such model is based on standard fuzzy linguistic protoforms, but provides a more general framework which can be easily extended with different expressions. – A knowledge base model which can be used to define the domain knowledge in LDD approaches, which is not limited to fuzzy definitions of linguistic terms, but also considers other kind of crisp definitions such as numeric intervals or categories. • GALiWeather [94, 95, 93], a textual weather forecast generator which is currently in operation as a public service for the Galician Weather Agency (MeteoGalicia). This real application generates daily textual short-term weather forecasts for every municipality in Galicia (NW Spain), which are available to the general public. This solution was developed in collaboration with expert meteorologists and, among others: – Generates textual short-term weather forecasts which include information about cloud coverage, precipitation, fog, wind, temperatures and air quality state trends. – Extracts relevant information as intermediate codes through the use of several operators (content determination), and converts this intermediate codes into actual texts (realization). – Includes fuzzy techniques which extract linguistic information related to cloud coverage. These were used to address some gaps were the experts were imprecise about how to describe this specific weather variable. – Uses advanced template-based natural language generation to generate actual texts in Galician and Spanish languages, as well as specific logic to address aggregation tasks. – The texts generated by GALiWeather were supervised and evaluated by an expert meteorologist through a quality assessment methodology which covers two key dimensions of a text: the accuracy of its content and the correctness of its form.
10
Chapter 1. Introduction – Was deployed for actual service in May 2015 and has been producing 315 daily weather forecasts since then, which are publicly published by MeteoGalicia in its website. • The SoftLearn Activity Reporter (SLAR) [124, 97], a data-to-text service which automatically generates on-demand textual reports about the activity developed by students within the SoftLearn virtual learning environment. This service was integrated in the SoftLearn e-learning environment as a complement to the learning analytics dashboard, and provides textual feedback about the participation of the students in several activities, including blogs, bookmarks, files or twitter-like comments, among others. SLAR follows the same text generation strategy used in GALiWeather (a similar content determination approach and realization through templates). The reports generated by SLAR were evaluated by an expert pedagogue. Results show that the automatically generated reports are a valuable complementary tool for explaining teachers and students the information comprised in a learning analytics dashboard. The contributions of this PhD dissertation are included among the following publications,
which encompass the whole scientific production during the PhD development period: Journal Papers – A. Ramos-Soto, A. Bugar´ın, S. Barro and J. Taboada. Linguistic Descriptions for Automatic Generation of Textual Short-Term Weather Forecasts on Real Prediction Data. IEEE Transactions on Fuzzy Systems, vol. 23, no. 1, pp. 44-57, Feb. 2015. DOI: 10.1109/TFUZZ.2014.2328011. IMPACT FACTOR (JCR 2015): 6.701 Category: COMPUTER SCIENCE, ARTIFICIAL INTELLIGENCE. Order 1/130. Quartile 1. Category: ENGINEERING, ELECTRICAL & ELECTRONIC. Order 2/255. Quartile 1. – A. Ramos-Soto, A. Bugar´ın, S. Barro. On the role of linguistic descriptions of data in the building of natural language generation systems. Fuzzy Sets and Systems. Volume 285, 2016, Pages 31-51, ISSN 0165-0114, DOI: 10.1016/j.fss.2015.06.019.
1.3. Contributions
11
IMPACT FACTOR (JCR 2015): 2.098 Category: COMPUTER SCIENCE, THEORY & METHODS. Order 13/105. Quartile 1. Category: STATISTICS & PROBABILITY. Order 13/123. Quartile 1. Category: MATHEMATICS, APPLIED. Order 12/254. Quartile 1. – A. Ramos-Soto, B. V´azquez-Barreiros, A. Bugar´ın, A. Gewerc, S. Barro. Evaluation of a Data-To-Text System for Verbalizing a Learning Analytics Dashboard. International Journal of Intelligent Systems. Wiley-Blackwell, 2016. Accepted. IMPACT FACTOR (JCR 2015): 2.050 Category: COMPUTER SCIENCE, ARTIFICIAL INTELLIGENCE. Order 37/130. Quartile 2. Conference Papers – Alejandro Ramos-Soto, Nava Tintarev, Rodrigo de Oliveira, Ehud Reiter, Kees van Deemter. Natural Language Generation and Fuzzy Sets: An Exploratory Study on Geographical Referring Expression Generation. IEEE International Conference on Fuzzy Systems. Vancouver (Canada). 2016. Accepted. Conference Ranking (CORE 2014): A – A. Ramos-Soto, A. Bugar´ın, S. Barro. Fuzzy sets and natural language genera˜ tion. What to make out of it? Proceedings of XVIII CONGRESO ESPANOL SO´ ´ BRE TECNOLOGIAS Y LOGICA FUZZY, pp. 240-241. San Sebasti´an (Spain) 2016. – A. Ramos-Soto, A. Bugar´ın, S. Barro, N. Gallego, C. Rodr´ıguez, I. Fraga and A.D. Saunders. Automatic Generation of Air Quality Index Textual Forecasts Using a Data-To-Text Approach. 16o Conferencia de la Asociaci´on Espa˜nola para la Inteligencia Artificial, pp. 164-174. Albacete (Spain). 2015. – Alejandro Ramos, Alberto Jos´e Bugar´ın Diz, Sen´en Barro. Las descripciones ling¨u´ısticas de datos en los sistemas “Data to Text”. 16a Conferencia de la Asociaci´on Espa˜nola para la Inteligencia Artificial, pp. 623-631. Albacete (Spain). 2015. – Alejandro Ramos-Soto, Manuel Lama Pen´ın, Borja V´azquez-Barreiros, Alberto Bugar´ın, Manuel Mucientes and Sen´en Barro. Generacion autom´atica de in-
12
Chapter 1. Introduction formes en lenguaje natural en una plataforma de e-learning. 16a Conferencia de la Asociaci´on Espa˜nola para la Inteligencia Artificial, pp. 633-643. Albacete (Spain). 2015. – M. Fresquet-Rius, A. Ramos-Soto, A. Bugar´ın, S. Barro. GALiWeatherApp: applicaci´on m´ovil para predicci´on meteorol´ogica individualizada en lenguaje natural. 16a Conferencia de la Asociaci´on Espa˜nola para la Inteligencia Artificial, pp. 885-893. Albacete (Spain). 2015. – A. Ramos-Soto, M. Pereira-Fari˜na, A. Bugar´ın, S. Barro. A Model Based on Computational Perceptions for the Generation of Linguistic Descriptions of Data. IEEE International Conference on Fuzzy Systems, pp. 1-8. Istanbul (Turkey). 2015. DOI: 10.1109/FUZZ-IEEE.2015.7337923. Conference Ranking (CORE 2014): A – Alejandro Ramos-Soto, Manuel Lama, Borja V´azquez-Barreiros, Alberto Bugar´ın, Manuel Mucientes, Sen´en Barro. Towards Textual Reporting in Learning Analytics Dashboards. 15th IEEE International Conference on Advanced Learning Technologies, pp. 260-264. Hualien (Taiwan). 2015. DOI: 10.1109/ICALT.2015.96. Conference Ranking (CORE 2014): B – Borja V´azquez-Barreiros, Alejandro Ramos-Soto, Manuel Lama, Manuel Mucientes, Alberto Bugar´ın, Sen´en Barro. Soft Computing for Learner’s Assessment in SoftLearn. 17th International Conference on Artificial Intelligence in Education, pp. 925-926. Madrid (Spain). 2015. Conference Ranking (CORE 2014): A – J. Janeiro, I. Rodriguez-Fdez, A. Ramos-Soto and A. Bugar´ın. Data Mining for Automatic Linguistic Description of Data - Textual Weather Prediction as a Classification Problem. 7th International Conference on Agents and Artificial Intelligence, pp. 556-562. Lisboa (Portugal). 2015. Conference Ranking (CORE 2014): C – A. Ramos-Soto, A. Bugar´ın, S. Barro. Computing with perceptions for the linguistic description of complex phenomena through the analysis of time series data. 7th International Conference on Agents and Artificial Intelligence. Lisboa (Portugal). 2015.
1.4. Dissertation structure
13
– A. Ramos-Soto, A. Bugar´ın, S. Barro. Generaci´on autom´atica de predicciones meteorol´ogicas a corto plazo: Metodolog´ıa y validaci´on. Proceedings of XVII ´ ˜ CONGRESO ESPANOL SOBRE TECNOLOG´IAS Y LOGICA FUZZY, pp. 405410. Zaragoza (Spain). 2014. – A Ramos-Soto, A Bugarin, S Barro, J Taboada. Automatic Generation of Textual Short-Term Weather Forecasts on Real Prediction Data. 10th International Conference on Flexible Query Answering Systems, pp. 269-280. Granada (Spain). 2013. Conference Ranking (CORE 2013): C – A. Ramos-Soto, A. Bugarin, S. Barro, F. D´ıaz-Hermida. Automatic Linguistic Descriptions of Meteorological Data. A soft computing approach for converting Open Data to Open Information. Proceedings of 8th Iberian Conference on Information Systems and Technologies, pp. 728-733. Lisbon (Portugal). 2013. – Alejandro Ramos Soto, Alberto Bugar´ın Diz, F´elix D´ıaz Hermida, Sen´en Barro Ameneiro. Validation of a linguistic summarization approach for time series meteorological data. 5th International Conference of the ERCIM Working Group on Computing and Statistics. Oviedo (Spain). 2012. – A. Ramos-Soto, F. D´ıaz-Hermida, A. Bugar´ın. Construcci´on de res´umenes ling¨u´ısticos informativos sobre series de datos meteorol´ogicos: informes clim´aticos de temperatura. XVI Congreso Espa˜nol sobre Tecnolog´ıas y L´ogica Fuzzy, pp. 644-649. Valladolid (Spain). 2012. Patents – GALiWeather. Registered under the Spanish Intellectual Property Registry Number 03 / 2014 / 1259. – Monitor-SI-Text. Applied for registration in the Spanish Intellectual Property Registry. Application identifier SC 104 16.
1.4
Dissertation structure
This PhD dissertation is composed of four pieces of work, which encompass the main aforementioned contributions and the most relevant publications included in the previous section.
14
Chapter 1. Introduction Chapter 2 continues this introductory chapter with an exhaustive state-of-the-art review
which covers both NLG and the application of fuzzy sets for generating LDD. In this regard, NLG is depicted from different perspectives, including a more general and structural description, many examples of actual NLG systems, its business and commercial side, and other relevant concepts such as evaluation tasks and imprecision handling. This last concept serves as link to introduce LDD and its application of fuzzy sets theory as a tool for extracting linguistic information dealing with uncertainty and imprecision. Some ideas are also given in the context of using fuzzy and LDD techniques in NLG systems, which allow to highlight the importance of the contribution of the rest of the chapters in relation to the aim of this thesis. Chapter 3 describes a computational model which, based on practical experience, LDD techniques and the idea of computational perception, allows to perform NLG-D2T content determination tasks. Its terminology and concepts are inspired by philosophical ideas about the problem of perception. Such model allows to build incremental expressions which cover the standard “Q Xs are A” fuzzy protoforms used in LDD, but also provides a framework which characterizes how LDD approaches can be structured and implemented. An illustrative use case where such model is used to characterize and address a content determination task in the form of a linguistic description is also presented. Chapters 4 and 5 present two different applications developed in the context of this PhD, which served as practical experiences that helped inspire the model described in Chapter 3. Chapter 4 describes GALiWeather, a textual weather forecast generation system which was developed for the Galician Weather Agency (MeteoGalicia). This solution includes content determination tasks based on standard fuzzy techniques, as well as a textual realization engine based on advanced templates. Chapter 5 depicts SLAR, a data-to-text tool developed for the SoftLearn e-learning environment, which generates brief reports about the participation of students in several course activities. Chapter 6 summarizes the main contributions of this PhD dissertation in a retrospective way and provides additional insights and reflections, which open several promising future research lines in the context of the integration of fuzzy sets in D2T-NLG.
C HAPTER 2
S TATE OF THE AR T Nowadays, the task of generating easily understandable information for people using natural language is being addressed by two fields which, independently until now, have researched the processes this task involves from different perspectives: the natural language generation (NLG) field [101] and the fuzzy sets theory field and its application in generating linguistic descriptions of data (LDD) [138, 132, 74]. This chapter provides an extensive review of the state of the art of these two research fields which, despite having different origins, are currently on a path which may (and should) lead to their convergence. The natural language generation field consists in the creation of texts which provide information contained in other kind of sources (numerical data, graphics or even other texts), with the aim of making such texts indistinguishable, as far as possible, from those created by humans. On the other hand, the application of fuzzy sets for generating linguistic descriptions of data, allows to provide summaries or descriptions from data sets using linguistic concepts defined as fuzzy sets and partitions, which deal with the imprecision and ambiguity of human language. The NLG field has been in development since the 1980s (although there are systems which date from even before this period, e.g. [115]), when the first applications which translated data into legible texts appeared (e.g., [67], [17]). Since then, the complexity of the developed systems has increased notably and there are several techniques and methodologies which guide the building of these solutions [101], [75], [98]. Even so, this research field is still open in many respects and there is no unique and well defined approach to address NLG problems. The linguistic descriptions (or summaries) of data aim to obtain informative, brief and
16
Chapter 2. State of the art
concise descriptions from numeric datasets and cover a group of soft computing-based techniques, such as linguistic variables or fuzzy quantifiers and operators. It is a young fuzzy research line when compared to the NLG domain, whose solutions provide information in the form of linguistic terms. Specifically, although preliminary ideas appeared early in the 1980s [132], [133], it started to develop in the second half of the 1990s, when the advances in the field of fuzzy sets (namely computing with words [138] and the computational theory of perceptions [139], [140]) provided new potential applications in the descriptive side of data mining. Due to its short career and its formal background, many approaches in this line are on the theoretical side, although in some cases practical examples and real life based problems are given. This chapter is organized in three main sections. Section 2.1 provides a thorough review on the NLG field, with a special focus on its data-to-text specialty, which deals with the generation of text from raw (usually numeric) data. This includes an overview about the motivations and objectives of this field, followed by an explanation of the most popular architectures and general models, a review of some of the most relevant NLG systems, a discussion on NLG evaluation methodologies and some general reflections about this research field. Section 2.2 follows a similar structure as Section 2.1, where an overview on LDD is provided, with an introduction in Section of its basic concepts and elements, a review of both theoretical and applied LDD approaches and some considerations about the current state of the application of fuzzy sets for generating LDD. Finally, in Section 2.3 some insights on potential points of interest and convergence for both fields are described.
2.1
Natural Language Generation
Natural language generation (NLG) is described by John Bateman in [11] as the branch of natural language processing which deals with the problem of how texts in human natural language can be automatically created by a machine. This may be seen as the inverse of the problems addressed by natural language understanding but, actually, the NLG field emerges from a very different set of motives and objectives, both theoretical and practical. In this sense, on the theoretical side it explores how language is grounded in non-linguistic information and how it is produced. From a practical point of view, NLG tries to provide solutions for text generation problems in real life application contexts. The demand of natural language texts which provide all kinds of information is currently
2.1. Natural Language Generation
17
increasing. Thus, it is likely that NLG will be a key information technology in the future (a good indicator of this is the considerable number of NLG companies which have emerged in recent years). As a consequence, many NLG systems have found a practical use, while the demand of real life applications is having a growing impact in the approaches and questions contemplated in the NLG field. Examples of well established NLG applications include the generation of weather reports from meteorological data in several languages [55] [26], the creation of custom letters which answer customers’ questions [28], the generation of reports about the state of neonatal babies from intensive care data [88], and the generation of project management [127] and air quality reports [19]. Bateman also states that, usually, it is hard for a casual user to distinguish between hand made texts, texts built using simple techniques or a complete natural language generation using NLG technology. This is, in fact, what any NLG solution should achieve in order to be considered successful. It should be simply a perfect text production which ideally fulfills the necessities and the knowledge of the reader/listener. This duality directly translates into two quite different research issues within NLG: i) producing texts which are humanlike, and ii) producing comprehensible texts to fulfill certain needs. The fact that an user is incapable of distinguishing between texts however they are produced is also a problem for the research and development of NLG in the sense that it implies that the required effort to build a successful NLG system is hard to be perceived by users. Since users are not frequently aware of it until something goes wrong, there is little appreciation of the possibilities and complexities of a full natural language generation. In fact, users and application developers who could see the utility of providing automatically produced flexible texts in natural language are not aware of the complexity it might imply, the available range of technological solutions and the effort level required to create scalable solutions. In this sense, the complete range of possible applications has not been broadly explored. Given this potential as well as the wide range of interests involved, it should not come as a surprise that NLG has experienced a fast growth since the 1990s. This makes providing an exhaustive revision of the field rather complicated. Until the end of the 1980s it was almost possible for a revision to enumerate the most significative systems in NLG. This, however, is not currently feasible: the most extensive list of NLG systems is [12], which currently contains near 400 systems and is regularly updated as new systems appear. It must also be noted that NLG can be divided into several sub-fields depending on the type of communicative tasks they perform and the kind of input they receive (e.g., NLG in
18
Chapter 2. State of the art
interactive systems, narrative NLG or data-to-text NLG, among others). Although many of the concepts and ideas in this discussion are made on a general sense, for this review datato-text will be the main focus, which strongly resembles the linguistic descriptions of data field. Furthermore, data-to-text has allowed the emergence of the most successful applied NLG systems and is the most commercially-oriented NLG sub-field.
2.1.1
Design of an NLG system
The design of NLG systems is an open field where a broad consensus does not exist. Instead, there is a diversity of architectures and implementations which depend on the developer and the problem for which the NLG system is created. In this sense, it is hard to identify common elements and to provide a complete abstraction which is applicable to most NLG systems. However, there does exist a certain agreement about the tasks that an NLG system usually performs. E. Reiter and R. Dale [101],[100] proposed a generic description of an NLG system based on their own experience and the structure of many other systems in the literature until year 2000. They argue that, in general terms, the main task of a natural language generation system can be characterized as the conversion of some input data into an output text. However, as in most computational processes, this task can be splitted into a number of substages or modules which then can be further specified. In this context they present a sequential pipeline architecture for NLG divided into general three stages (Fig. 2.1): • Text planning. • Sentence planning. • Linguistic realization. This architecture is then further decomposed into six basic activities (see Fig. 2.1): • Content determination. It is the process of deciding which information shall be communicated in the text. It can be perceived as the creation of a set of messages from the system input. Those messages are the data objects used in the subsequent tasks. In general terms, the message creation process consists in filtering and summarizing the input data. The messages are expressed in some kind of formal language which labels and distinguishes the entities, concepts and relations determined by the application domain.
2.1. Natural Language Generation GOAL
19
TEXT PLANS TEXT PLANNING
SENTENCE PLANS SENTENCE PLANNING
SURFACE TEXT
LINGUISTIC REALIZATION
REFERRING EXPRESSION GENERATION
CONTENT DETERMINATION
SENTENCE AGGREGATION
DISCOURSE PLANNING
LEXICALIZATION
Figure 2.1: Generic NLG system activity and architecture diagram as depicted by Reiter and Dale in [101].
• Discourse planning. It is the process by which the set of messages to be verbalized is given an order and structure. A good structuring can make a text much easier to read. In the general architecture, text planning combines the tasks of content determination and discourse planning. This reflects the fact that in many real applications it is hard to separate these activities. • Sentence aggregation. This process groups several messages together in a sentence. This task is not always necessary (each message can be expressed in a separate sentence), but in many cases a good aggregation significantly improves the fluidity and readability of a text. • Lexicalization. In this process it is decided which words and specific expressions must be used to express the concepts and relationships of the domain that appear in the messages. In many cases this task can be performed trivially, assigning a unique word or phrase to each concept or relationship. In others, however, the fluidity can be improved allowing the system to vary the words used to express the concepts and relationships. • Referring expression generation. This task selects words or expressions which identify entities from the domain. Although this task seems similar to the previous one, in this case the referring expression generation is characterized as a discrimination activity, in which the system needs to provide enough information to differentiate one domain entity from the rest. In the general architecture, sentence planning combines the sentence aggregation, lexicalization and referring expression generation processes.
20
Chapter 2. State of the art • Linguistic realization. This task, which directly matches the one defined in the general architecture, applies grammatical rules to produce a text which is syntactically, morphologically and orthographically correct. Although, in general, Reiter and Dale consider these six tasks as essential in a complete
NLG system, the way in which they are structured allows many variants, depending on the specific language generation problem and its associated complexity. This, in fact, implies that an NLG system does not necessarily need to be composed of six modules, since in many cases some of these activities can merge into a single module or are not needed if the language generation complexity is low. For instance, template-based NLG addresses several of these tasks at once, although this usually comes at the cost of flexibility due to the use of relatively fixed templates. An interesting discussion about the use of standard and templated-based approaches is given by van Deemter et al. in [121], where the authors suggest that there is no such a gap between both approaches. While the model provided by Reiter and Dale in [101] can be considered the de facto standard classically, other authors have also explored and reviewed the complexity and variety of tasks and architectures in NLG. In this sense, Mellish et al. show in [75] that i) there is a very broad variety of tasks; ii) most NLG systems adopt some of these tasks, but not all; iii) the architectures of such systems often do not follow the pipeline described by Reiter and Dale. In order to respond to this reality, Mellish et al. propose the RAGS framework, which relaxes the “architectural” requirement to a point where it is sufficiently inclusive of actual systems to be relevant, yet still sufficiently restrictive to be useful. To achieve this, Mellish et al. characterize at a quite abstract level the data types, functional modules and protocols for manipulating and communicating data that most modular NLG systems seem to embody. For this, the RAGS proposal considers the following elements: • A high-level specification of the key (linguistic) data types that NLG systems manipulate internally. This uses abstract type definitions to give a formal characterization independent of any particular implementation strategy; • A low-level reference implementation specifying the details of a data model flexible enough to support NLG systems. • A precise XML specification for the data types, providing a standard “off-line” representation for storage and communication of data between components.
2.1. Natural Language Generation
21
• A generic view of how processing modules can interact and combine to make a complete NLG system, using data formats “native” to their particular programming languages which are faithful to the high- and low-level models and exploiting agreed instantiations of the high-level data types. • Several sample implementations to show how the development of a range of concrete architectures can be achieved. In order to show the usefulness and applicability of RAGS, several already existing NLG systems were re-implemented (partially in some cases and totally in other) following the components and guidelines described in [75]. These reconstructions include the Caption Generation System (CGS) [79], and also two projects derived from the ILEX system [84]. Finally, the RICHES system [20] was developed as a new implementation based on RAGS. Other architectures for more specific purposes within NLG have also been proposed. For instance, the data-to-text architecture proposed by Reiter in [98] extends the proposal in [101] to address the production of texts from numeric data, with a special focus on time series data involving several variables. It supports several NLG systems, including the SumTime family of projects [111], [88], [134] (these will be reviewed in Section 2.1.2). Another interesting architecture approach addressing time series data is given by Jin Yu et al. in [136]. Finally, regarding the design of NLG systems, it is also worth mentioning that in spite of the open discussion about general architectures and tasks in NLG, more recent developments have adopted data-driven approaches, where the boundaries between specific tasks have become somewhat blurred. In fact, a number of approaches, given a parallel corpus of data and corresponding text 1 , have explored the learning of mappings between data and text, that cut across such tasks as lexicalization, realization, and even document structuring. An extensive review of such systems is given by Dethlefs in [41]. For instance, Barzilay and Lapata propose in [10] a method to automatically learn content selection rules from a database and its corresponding corpus. This approach was tested using sport statistics from the American National Football League and their corresponding summaries written by Associated Press journalists. Another interesting approach is given by Varges and Mellish in [123], who propose an overgeneration-and-ranking approach which generates many possible candidate output sentences through a rule-based grammar and then 1 The corpus texts are a set of human-made texts and, if available, corresponding data, usually produced by the application domain experts, from which the output texts of an NLG system are conceived and designed.
22
Chapter 2. State of the art
selects the fittest one. Gkatzia et al. present in [54] a methodology that treats content selection as a multi-label classification problem. This approach was applied to the generation of student feedback reports based on data for several factors. Recent approaches cover the use of natural language generation in interactive spoken dialogue systems through models which dynamically adapt to the users’ level of expertise [60], a fully data-driven generation method that treats the language generation task as a search for the most likely sequence of semantic concepts and realization phrases [71], and a domainindependent approximation that performs content determination and surface realization in a joint unsupervised fashion through the use of a probabilistic context-free grammar [70]. Other approaches are mainly based on statistical methods, such as the pCRU framework proposed by Belz in [13] or the NLG system described by Kondadadi et al. in [69], which aggregates planning and realization by automatically deriving a bank of templates from a corpus of texts for a target domain.
2.1.2
NLG systems
There are many kinds of NLG systems, developed for a wide variety of purposes, such as dialogue systems, description of catalogue sets, letters for customers, etc. This review focuses on the most relevant NLG systems (especially those that follow data-to-text approaches), grouped by application domains. Additionally, some general approaches to NLG are included, as well as a list of companies which currently provide commercial NLG solutions. Meteorology One of the domains in which NLG systems have been deployed is the meteorology domain, where several data-to-text systems have been developed and deployed to issue weather forecast reports. For example, FoG [55], which was a pioneer in the NLG field, automatically generates textual marine weather forecasts in both English and French for Canada by using rules and formal grammars which generate an intermediate language, which is then translated to both output languages. An example of a forecast generated by FoG is shown in Fig. 2.2. Years later, MultiMeteo [26], [27], [29] was developed for several European weather agencies, including Instituto Nacional de Meteorolog´ıa (Spain), M´et´eo-France (France), Institut Royal M´et´eorologique (Belgique) and Zentralanstalt fur Meteorologie und Geodynamik (Austria). Consequently, its most remarkable feature is its multi-language support. Figure 2.3 shows a forecast example generated by MultiMeteo .
2.1. Natural Language Generation
23
FROBISHER BAY. WINDS SOUTHWEST 15 DIMINISHING TO LIGHT LATE THIS EVENING. WINDS LIGHT FRYDAY. SHOWERS ENDING LATE THIS EVENING. FOG. OUTLOOK FOR SATUDAY... LIGHT WINDS. EAST BREVOORT EAST DAVIS. GALE WARNING CONTINUED. WINDS SOUTH 30 TO GALES 35 DIMINISHING TO SOUTH WINDS 15 EARLY FRIDAY MORNING. WINDS DIMINISHING TO LIGHT FRIDAY EVENING. RAIN TAPERING TO SHOWERS THIS EVENING AND CONTINUING FRIDAY. FOG DISSIPATING THIS EVENING. OUTLOOK FOR SATURDAY...LIGHT WINDS. Figure 2.2: Example of a weather forecast generated by FoG, as shown in [55].
Figure 2.3: Example of weather forecasts generated by MultiMeteo.
Another well established NLG system which generates weather forecast reports is SumTimeMousam [111], which provided marine weather forecasts, originally for oil extraction platforms (Fig. 2.4). It included support for generating texts with different detail level and style depending on the final user profile. This approach was further developed and commercialized [2], and is currently used by UK’s national weather service, Met Office [4], [112] to automatically issue natural language forecasts for every location in the UK. RoadSafe [118] [117] automatically generates advice for deploying road maintenance vehicles and the deployment routes they must follow, taking into account both meteorological and geographic data (see Fig. 2.5). It allows the experts to edit the automatically generated texts to improve the system performance.
24
Chapter 2. State of the art 2. FORECAST 6 - 24 GMT, Wed 12-Jun 2002 WIND(KTS) 10M: W 8-13 backing SW by mid afternoon and S 10-15 by midnight. 50M: W 10-15 backing SW by mid afternoon and S 13-18 by midnight. WAVES(M) SIG HT: 0.5-1.0 mainly SW swell. MAX HT: 1.0-1.5 mainly SW swell falling 1.0 or less mainly SSW swell by afternoon, then rising 1.0-1.5 by midnight. PER(SEC) WAVE PERIOD: Wind wave 2-4 mainly 6 second SW swell. WINDWAVE PERIOD: 2-4. SWELL PERIOD: 5-7. WEATHER: Mainly cloudy with light rain showers becoming overcast around midnight. VIS(NM): Greater than 10. AIR TEMP(C): 8-10 rising 9-11 around midnight. CLOUD(OKTAS/FT): 4-6 ST/SC 400-600 lifting 6-8 ST/SC 700-900 around midnight.
Figure 2.4: Example of a weather forecast generated by SumTime-Mousam, as shown in [111].
Road surface temperatures will reach near critical levels on some routes from the late evening until tomorrow morning. Rain will affect all routes during the afternoon and evening. Road surface temperatures will fall slowly during the mid afternoon and evening, reaching near critical levels in areas above 500M by 21:00. Figure 2.5: Example of a road maintenance text generated by RoadSafe, as shown in [118].
The system TEMSIS [19] generates reports about the air quality state from environmental data, as shown in Fig. 2.6. This application is characterized by a small and simple language, but it fulfills the experts’ requirements, which in this case are the final users of the application. This solution supports French and German languages.
Figure 2.6: Example of an air quality state report generated by TEMSIS, as shown in [19].
2.1. Natural Language Generation
25
Health Another domain where NLG technology has been applied is health, where several systems have addressed a number of different tasks. The STOP system, by Reiter et al. [103], [102], produces custom letters to help smokers who try to escape their addiction (Fig. 2.7 shows a full example of a letter generated by this system). This letters are automatically generated from the patient’s basic data and a questionnaire which the smoker must fill in previously. Its authors state that this system was a failure, in the sense that the automatically generated letters do not actually improve the percentage of smokers who kick the habit over the manually produced letters. However, the real causes of the pointed failure are unclear and may reside in the nature of the problem that is being addressed (to use letter to encourage smokers to quit) rather than in the system itself.
Figure 2.7: Example of a letter generated by STOP, as shown in [103].
The SUREGEN-2 system [58] generates medical documents such as clinical findings, procedure reports or referral letters. This system uses a hybrid approach, combining predefined sentences (with variables) with a bottom-up generation, which includes aggregation of sentences and lexical choice.
26
Chapter 2. State of the art The BABY TALK family of systems [57, 88], such as BT-Nurse, generate textual reports
from physiological data from the state of babies in the neonatal intensive care unit (see Fig. 2.8). Apart from NLG, its architecture includes techniques from different fields, such as signal processing, medical reasoning or knowledge engineering. Consequently, they are complex systems which aggregate heterogeneous information and data from different sources.
Figure 2.8: Example of a textual report generated by BT-Nurse, as shown in [57].
Business and Industry The previous domains show how NLG systems can be useful in important human knowledge areas. However, there are many other domains which may benefit from NLG techniques, in-
2.1. Natural Language Generation
27
cluding business and industry, which may help workers and experts in daily tasks such as generating documents, letters or monitoring industrial processes. For instance, Project Reporter [127], [30] is a tool used to monitor the state of a project. From information obtained from a project management database, Project Reporter automatically generates natural language reports which describe task progress, staff, work expenditures and project costs. Additionally, the reports come with graphical information as Gantt diagrams. Another example of how NLG solutions can lighten tedious tasks is the AlethGen engine [28], [25], which was used to automatically generate letters to answer customer issues and questions for the French largest mail order company, La Redoute. The developed system used data introduced by a human operator, a customer database and knowledge bases to generate an answering text for a customer request. Also in the sense of lightening repetitive tasks, Patent Claim Expert [108], [109] generates patent descriptions from textual predefined templates and data introduced by the system user, who must specify the descriptive structure of the patent. The generated texts are used as a draft which, once revised, can be included in the patent request. Figure 2.9 shows a patent description example generated by this NLG system.
A cassette for holding excess lengths of light waveguides in a splice area comprising a cover part and a pot-shaped bottom part having a bottom disk and a rim extending perpendicular to said bottom disk, said cover and bottom parts are superimposed to enclose jointly an area forming a magazine for excess lengths of waveguides, said cover part being rotatable in said bottom part, two guide slots formed in said cover part, said slots being approximately radially directed, guide members disposed on said cover part, a splice holder mounted on said cover part to form a rotatable splice holder. Figure 2.9: Example of a patent description generated by Patent Claim Expert, as shown in [109].
In [68], Kobayashi et al. propose a specific application oriented to the economic domain. Nikkei data time series are used, from which several pattern profiles which take into account the curvature and trend of the data series are detected to produce summaries about the evolution of the market at a given date. These descriptions were checked against news reports about that evolution. The obtained descriptions are more complex, composed by simple sentences
28
Chapter 2. State of the art
such as “At the end of the session the prices decreased”. M-PIRO [9] is a system which allows the administrators of a museum to generate textual descriptions from the collections of their catalogue. This system is provided with an application which includes a user interface, allowing to inspect and edit the automatic texts. Start at Parbury Lane. Follow Parbury Lane until you reach the end. Take a right. Follow Lower Fort Street for 30 metres. Turn to the left at George Street. Follow George Street until you reach your destination. Figure 2.10: Example of a instruction list generated by Coral, as shown in [35].
The Coral system, by Dale et al. [34], [33], [35], employs NLG techniques to provide richer descriptions of route instructions from basic information provided by geographical information systems. This approach was conceived to create texts that could be displayed in mobile devices (to be used as input to a voice generation system) and includes several NLG techniques which guarantee that the obtained instruction texts are easy to follow and remember. The system validation was performed through a small scale test with the participation of experts in navigation systems (see Fig. 2.10 for an example of the output instructions generated by Coral). SumTime-Turbine [134, 135] emerges as a solution to automatically generate texts which analyze monitoring data from gas turbines (see Fig. 2.11). Due to the constantly increasing huge amount of available data, a human made analysis was not feasible. This task was performed by the system by providing a textual analysis by detecting and abstracting relevant patterns from the time data series. General purpose approaches Although in the vast majority of cases NLG systems are built for a specific text generation task, some of them have been designed as engines or as generic subtasks which can be reused in other systems. For instance, as mentioned in the previous subsection, the SumTime systems follow the data-to-text architecture proposed by Reiter in [98]. Other efforts in this sense include TREND, a system which generates time series descriptions [16], XtraGen [114], which
2.1. Natural Language Generation
29
Figure 2.11: Example of a gas turbine analytic report generated by SumTime-Turbine, as shown in [135].
is an NLG generic system based on sophisticated templates, NaturalOWL [47], which creates descriptions from catalogues of objects, or SimpleNLG [51], a Java framework which can be used to implement linguistic realization tasks. Companies Many systems have been developed in the NLG field over the course of its existence. However, the commercial viability of these approaches has been very limited for many years, since most of them were originated in academic institutions as a result of research projects or PhDs, which were not further developed. It was not until recent times that some solid NLG companies have emerged: • ARRIA [2] is backed up by two of the most prominent researchers in NLG, Ehud Reiter and Robert Dale. Consequently, many of their case studies include some of the systems previously described, i.e., weather forecast report generation (see Fig. 2.12), gas and oil machinery analytic report generation or neonatal state report generation. • Automated Insights [1] started also from sports-related report generation to emerge as a company with its own authoring platform, namely WordSmith. This company offers NLG solutions for a wide range of application domains, including finance, health and fitness, sports, etc. • CoGenTex [3] is a small technological company founded in 1990 which can be considered the first one dedicated to provide NLG solutions. Among the commercial systems they have developed, FoG and Project Reporter stand out.
30
Chapter 2. State of the art • NarrativeScience [5] emerged from a university project named StatsMonkey, in which a system which automatically generated baseball match reviews was developed. Since then, this company has developed a text author platform named Quill and nowadays offers solutions such as text reports from Google Analytics websites data. • YSEOP [7] is a French company also located in the USA, offering several kinds of NLG solutions, adapted to the customers’ needs. Among the available demos at their website a executive report generator from graphical and numerical data can be found, as well as an automatic biography generator from LinkedIn data.
Figure 2.12: Data2Text weather forecast by Arria NLG and the British Met Office, as shown in [4].
2.1.3
Evaluation methodologies
Most of the described systems in this paper offer a full solution to the problems they address. Some of them are complex and merge techniques from different research fields (i.e. BabyTalk [88]) to provide detailed high quality output texts which are hardly distinguishable from human-produced ones. However, to achieve this is not easy and evaluation methodologies play an important role in improving an NLG system.
2.1. Natural Language Generation
31
In fact, an important aspect in the evaluation of an NLG system is the focus of the evaluation itself, i.e., what aspect of the NLG system the evaluation is focusing on. Adopting terminology defined by Sparck-Jones and Galliers in [61], one can distinguish between intrinsic evaluation (focused on the quality of the texts produced by the NLG system) and extrinsic evaluation (focused on the success of the system in its impact on users, which is usually much costlier to assess). In this sense, at first it might seem both evaluation types are directly tied to one another, i. e., humanlikeness implies task effectiveness and viceversa (a system producing proven high quality texts should have a successful impact on its target users). However, recent work on comparative evaluation [49] has shown that the two methods often produce divergent results. For instance, the extrinsinc evaluation performed on the STOP system [103] showed that the system was not effective in motivating people to cease their smoking habits, but no mention was made in this sense regarding the quality or comprehensibility of the produced texts. Regardless of the type of evaluation (intrinsic or extrinsic) to be performed, how to perform a good evaluation is another debate subject within the NLG field, and there are several alternatives which can be considered for this task. In general, the majority of evaluation methods used in the NLG are quantitative [14], that is, they try to obtain some kind of numeric score which measures how well an NLG system performs in one or several aspects. For example, some methods ask human experts to rate generated texts on a Likert-like scale or compare the similarity of generated texts to corpus texts using automatic metrics such as BLEU [85]. Another approach, which has usually been relegated to a complement to quantitative evaluations, are qualitative evaluations, such as free-text comments from the experts who perform the quantitative evaluation. This kind of evaluation methodologies can be very helpful in identifying and correcting issues which otherwise could not be detected. Among them, content analysis and discourse analysis have recently been considered and performed in some systems such as the BT-Nurse [105], [99]. An interesting example of both qualitative and quantitative evaluations is described in [112], where Sripada et al. detail the extrinsic evaluation process of the weather forecast NLG system by ARRIA NLG after successfully assessing the output quality internally (intrinsically), which consisted in a questionnaire for end-users that use weather information for decision-making. The questionnaire had three questions related to quality assessment (quantitative), but also asked for free text comments (qualitative). In most cases, the selection of a evaluation methodology for an NLG system will depend
32
Chapter 2. State of the art
on the circumstances of the system development (for example, if corpus texts have been used, if there are available domain experts and in that case how much time they can spend in the evaluation task, among others). In spite of this, an ideal evaluation scenario would comprise an intrinsic quantitative evaluation together with a qualitative one and, after the system has been deployed in its target domain, an extrinsic evaluation. If successful, the intrinsic evaluations would guarantee that the NLG system is ready to perform in a real environment producing high quality texts. Otherwise, this evaluation process would provide enough information about the issues and errors in the system, potentially reducing the required testing time and eliminating the need for further intrinsic evaluations. Finally, the extrinsic evaluation would shed light on the task effectiveness level of the NLG system.
2.1.4
Remarks
It can be stated with certainty that, in general, although NLG systems generate texts with words which can be imprecise or ambiguous, those following a data-to-text paradigm do not use (at least explicitly) imprecise management techniques to perform this task. Actually, it is hard to determine which techniques these systems employ to perform data abstraction and information extraction, since, as commented before, the systems are vaguely described in the literature, especially in what concerns the content determination stage. However, some notable exceptions to the previous statement show that there is a high interest by some researchers in NLG to handle imprecise information. These include, for instance, the proposals by van Deemter, where the use of referring expressions involving gradable properties [119] and the practical implications of vague expressions in NLG are explored [120]; an approach by Power and Williams which deals with numerical approximations to describe proportions at different levels of precision [89]; and the extension of the data interpretation and microplanning stages in the BABY TALK family of systems to deal with uncertainty in temporal relations, by Portet and Gatt in [87]. Given its long career, the number of existing systems and the diversity of domains in which these systems are applied, NLG can be considered a mature and well established research field. However, its main downside resides in the fact that the techniques used to build NLG systems do not follow a specific standard, and there is not an established methodology which determines how they should be developed. In fact, it is accurate to state that the problem to solve and, more specifically, the application domain texts and their complexity, are the ones which usually determine how the natural language system must be designed.
2.2. Linguistic Descriptions of Data
33
Another problem, possibly associated to the lack of standardization, is the scarce detail with which these systems are described in the literature. The upshot is that on most occasions an external reader, outside of the natural language field, can only understand how these systems work at a high level of abstraction. In this sense, the best way to dive into this research field is through the book by Reiter and Dale [101], which addresses the whole NLG problem and describes the design and development of a full system in detail through a thorough example. The review by Bateman [11] also provides both introductory and deep reflections about this field, including a thorough list of NLG approaches which covers from the beginnings of the field to the early 2000s.
2.2
Linguistic Descriptions of Data
Originally, the NLG field has been the only one which has focused its complete attention on the task of converting any kind of data into informative texts for any kind of users. However, in the fuzzy sets theory field, which a priori seemed to be only distantly related to the problem of providing users with automatic textual information, there has emerged a specialty which researches the building of descriptions from data sets by employing imprecise linguistic terms. The origins of this specialty can be found in the ideas of Lofti A. Zadeh [138] and Ronald Yager [132], who promoted the use of the fuzzy sets theory to perform computations from a linguistic point of view. From these ideas come the computing with words paradigm (CW) [138] and its later evolution, the computational theory of perceptions (CTP, also referred to as computing with perceptions) [139], [140], which, according to Zadeh [142], adds to traditional systems of computation two important capabilities: (a) the capability to precisiate the meaning of words and propositions drawn from natural language; and (b) the capability to reason and compute with precisiated words and propositions. Although several approaches based on CW/CTP have emerged, a very promising tool is the linguistic summarization of data, which employs fuzzy quantified sentences to obtain linguistic summaries on one variable (as in “Most of the dogs are white” or “A few trees are tall”) or more (as in “Some of the white dogs are heavy”). Since then, the linguistic summaries creation has been applied in several practical cases and, with the conversion of CW into CTP, some authors have started to refer to the summaries as linguistic descriptions of data (LDD) and linguistic descriptions of phenomena (LDP), which understand linguistic summaries as a tool to describe human perceptions. Some of
34
Chapter 2. State of the art
the application domains which have been presented as use cases in linguistic description approaches include patient inflow in health centers [22], electric power domestic consumption [122], human gait quality [8], human activity based on cellphone accelerometers [107] or the meteorology domain [92], [95]. Other approaches use more complex expressions which relate different attributes (in economy data, sales data, or investment funds analysis). Since LDD is a relatively young research direction within fuzzy sets, to achieve a general approach capable of building different types of linguistic descriptions for any kind of application domain is still an open challenge, although some steps have been made in this direction. For instance, the granular linguistic model of a phenomenon approach (GLMP) [116] is a framework which formalizes and allows to generate linguistic descriptions and to apply fuzzy rules over these descriptions. Other important aspects within this field are the inclusion of general criteria about how to structure quantified sentences in order to obtain more complex descriptions or how to build and evaluate linguistic descriptions. Consequently, if it can be stated that in NLG there is not a general consensus about how a system should be implemented, in the application of fuzzy sets for producing LDD something similar happens, noting that the latter does not have such a lengthy career, with approaches which have not developed beyond the experimental stage in many cases, despite covering diverse application domains in the use cases and examples they provide.
2.2.1
Elements in a linguistic description of data approach
The creation process of a linguistic description can be defined as the task of extracting the relevant information from some input data by producing an abstract expression composed of linguistic terms. This concept is similar to the content determination task in the NLG field and constitutes one of the main nexus between both research fields. The main elements used to create linguistic descriptions include: • Input data, usually consisting in numeric data series, with an associated temporal and/or spatial component, defined as input variables. For instance, the height or weight of a population or the daily temperature for a year for a given location may serve as input data. • Linguistic variables, which are defined on the input variable domain as a set of fuzzy sets which label or categorize that domain. For example, for an input variable “temperature” an associated linguistic variable can be defined as a fuzzy set partition “very
2.2. Linguistic Descriptions of Data
35
cold”,“cold”,“mild”,“warm”,“hot”. Each label in a linguistic variable is associated to a mathematical fuzzy definition in the form of a membership function. • Fuzzy quantifiers, in both absolute and relative terms, such as “a few”, “most”, “several”, “about ten”, etc. These are also defined via fuzzy membership functions. • Evaluation criteria. The use of linguistic variables and quantifiers allows to produce different combinations among them, which produce a certain number of candidate descriptions. In order to discriminate the most appropriate descriptions several criteria can be applied, such as the data coverage degree, the sentence fulfillment degree, the relevance and the description length. This element set permits the construction of the simplest type of linguistic descriptions, type-I quantified sentences such as “a few dogs are brown” or “most of the temperatures were hot”, which can be computed through the use of a fuzzy quantification model [40]. From this base, the complexity of the linguistic descriptions can be increased by using type-II quantified statements (which model the relationship between two variables) or adding elements such as spatio-temporal references. Other approaches are based on the use of type-2 fuzzy sets [81], [82]. These allow to define single linguistic labels using different membership functions (e.g. to model divergent opinions from different experts), although the complexity of this kind of approaches is higher from both a conceptual and computational point of view. The construction of quantified sentences and, in general, of linguistic descriptions, is a process which is highly influenced by the fuzzy techniques on which these are based. Consequently, in order to handle the imprecision defined in the linguistic variables and quantifier partitions, the algorithms employed in LDD approaches generate all possible sentence combinations to create candidate descriptions. Then, candidates are ranked and accepted or discarded according to previously defined evaluation criteria. In this sense, this process can be deemed as a goal-driven search problem, where only the fittest descriptions are considered in the end. Consequently, both heuristic (e.g. [92], [22]) and meta-heuristic (e.g. [24], [44]) approaches can be used to address the linguistic description search process. Generally, as in NLG, the complexity of the process of generating linguistic descriptions and their structure are determined by the application domain and, in consequence, each approach has its own characteristics.
36
Chapter 2. State of the art
2.2.2
Approaches and use cases in the literature
The literature in LDD is much more limited when compared to the NLG field. Most of the research in this direction (excluding the introductory works by Yager and Zadeh) can be found from the year 2000 onwards. Another aspect is that, as opposed to the NLG field, in which most of the approaches are scarcely described in a qualitative way, the literature in LDD also has a strong theoretical component and, even in those cases where practical approaches are discussed, mathematical language is used to formalize the linguistic description generation tasks. The following sections review the theoretical principles of computing with words and linguistic descriptions of data, as well as the most relevant approaches from a practical and applied perspective. Theoretical work Yager provides in [132] and [133] a starting definition for linguistic summaries, introducing the concept of quantified sentences as data summaries. Years later, Zadeh introduced the concept of computing with words (CW) [138] and the computational theory of perceptions (CTP) [139], [140], also known as computing with perceptions. These proposals highlight the potential of fuzzy logic to provide a methodology to CW, including examples which show how this approach could be structured. More recently, Kacprzyk et al. introduced some ideas about a potential relationship between computing with words and the natural language field in [63], [65] and [64], but these were not explored in depth. From the ideas and concepts proposed in earlier contributions, the construction of a linguistic description framework which can be applied to any kind of description problem in any domain is perhaps one of the biggest challenges in this field, but it is still far from being achieved. In this sense, the granular linguistic model of a phenomenon (GLMP) by Trivino and Sugeno [116], which has been used as a solution for several practical cases in diverse domains [77], [8], [46], is the nearest approach there is to an all-in-one framework. It is based on a hierarchy of interconnected nodes named perception mappings (PM), which receive a set of computational perceptions (CP) as input. Each PM applies a function to the input CP (for example minimum, maximum, average or even fuzzy rules) and generates a new CP as a result which can be reused as input to other PM. In the network, each CP covers specific aspects of the phenomenon with certain degree of granularity. First order perception mappings (1PM) make up the input layer to the GLMP, receiving raw data and producing first order computational perceptions (1CP). In upper layers, PM’s
2.2. Linguistic Descriptions of Data
37
whose input are CP’s are called 2PM and their outputs are 2CP. According to Trivino and Sugeno, the classification of CPs and PMs is based on the concept of the three worlds by Popper [86], namely, the world-1 of physical objects (phenomena), the world-2 of the perceived objects (1CP) and the world-3 of the mental objects built by using the objects in the world-2 (2CP). Figure 2.13 shows an example of a simple GLMP model explaining several 2CPs using data obtained from sensors.Journal of Approximate Reasoning 54 (2013) 22–34 G. Trivino, M. Sugeno / International
Fig. 5. Figure Example a simple We include several sentences values of sensors. 2.13:of Example of a GLMP. simple GLMP model that explainsvalid several 2CPs usingfor dataspecific obtained from sensors, as shown in [116].
neration algorithm that allows generating the linguistic expressions in Ay . T has associate put data to choose the most suitable clauses the current stateevaluation of the monitored Other recent contributions explore the useto of describe different quantifiers and develop ases, T can criteria be implemented using a linguistic e.g., “Theettemperature in the room is for quantified sentences. For example,template, in [42], D´ıaz-Hermida al. explore several theoretical aspects such as the use of semi-fuzzy quantifiers to model quantified sentences and the description of some generic methods for pattern detection. Furthermore, [43], [23], [129], [128], [130] and [76] explore several and mostly convergent evaluation criteria, such as the data coverage percentage, the sentence truth degree, and other inspired by the conversational
sists of a network ofthe PMs. PMcommunication receives a set input CPs and transmits a CP. W maxims in field Each of human [48],ofincluding the relevance, specificity,upwards ambiined by theguity PM or using a set of input CPs. In the network, each CP covers specific aspects of the length of the description. In fact, when referring to criteria, it can be stated that there ee of granularity. rder perception mapping (1PM) to those which are input to the GLMP. We call first order to the output of 1PM’s. PM’s which input are CP’s are called 2PM and their outputs are 2CP. Thi definition of the three worlds by Popper, namely, the world-1 of physical objects (phenomena
38
Chapter 2. State of the art
is a solid consensus about which characteristics of a linguistic description can be useful in the task of evaluating and ranking candidate descriptions in an objective way. Use cases and practical contributions Castillo et al. define in [22] the concept of linguistic summary applied to temporal data series, which must fulfill brevity, precision and data coverage criteria. A few algorithms to obtain linguistic summaries are presented. The given example is made on data about patient inflow in medical centers, from which summaries such as “Most of the days with cold weather patient inflow is low or very low” or “Most of the days of June, patient inflow is medium” are obtained. This use case was also explored in [24] using a genetic algorithm approach instead of the standard heuristic algorithms used to generate linguistic descriptions. Another interesting research by Castillo et al. addresses the problem of obtaining hierarchical segmentations of time series data and their application in linguistic descriptions [21] (see Fig. 2.14 for an example). 70
•In
60 50 40 30 20 10 0
0
20
40
60
80
100
period from 1 to 10, the almost constant (0 units). •In period from 10 to 29, the highly increasing (33 units). •In period from 29 to 33 the highly decreasing (17 units). •In period from 33 to 43, the almost constant (2 units). •In period from 43 to 59, the highly increasing (33 units). •In period from 59 to 100, the decreasing (36 units).
trend is trend is trend is trend is trend is trend is
Figure 2.14: Linguistic description example of a signal trend, as shown in [21].
Kacprzyk and Wilbik orient the use of linguistic descriptions to temporal series comparison in [62], with the objective of helping human decision taking in an effective way, in this case related to economic investments. The kind of sentences obtained include variation patterns, such as “Among all y, most are constant”, “Among all medium y, most are constant” or “Among all moderate y, most are medium and constant”. In [122], Van der Heide and Trivino address the problem of generating linguistic descriptions for domestic electric consumption. This work highlights the potential that linguistic
2.2. Linguistic Descriptions of Data
39
12189 Sánchez-Torrubia company et al. / Expert Systems Applications (2012) 12177–12191 descriptions have for anM.G.electricity inwith order to 39provide customers with customized
Although all the descriptions perceptions can generate their such respective 6. Examples and above results analysis information mere numerical data. In this case, intuitive are given, as part of the report, we will select the linguistic summaries for
and 2-CPis, unless detail is required. 6.1. Report two on a simulation “About thirds of the days the consumption in2-CP the, 2-CP mornings lowera great thandeal theof consumption 8
9
11
This way, the output of the GLMP for the simulation whose data are E1–1 = 1/11, E1–23 = 1/23, E2–3 = 3/10, E2–12 = 0/10 and Time = 0.8 is: The activation and flow error is very low and the adjacent management error is low, the correctness level achieved by the student is very good, and the grade obtained in this simulation is 7.31.
simulates Dijkstra’s a graph, in The thestudent afternoons”, “Mostalgorithm of the on days thewhere consumption in the mornings is lower than the coneleven vertices have to be fixed to find the shortest path between
the two specified Data extracted the XMLtwo interaction sumption in vertices. the evenings” orfrom “About thirds of the days the consumption in the middays is log (see Section 4.1) are E1–1 = 1/11, E1–23 = 1/23, E2–3 = 3/10,
E = 0/10 and the Time consumption = 0.8. GLMP is used to an assessment lower than inprepare the evenings”. report based on these data: 2–12
The vectors of validity degrees of the 1-CPs and linguistic expressions selected for the natural language report follow:
Report on the learning processan approach which auBased on the GLMP model, in [46] Eciolaza6.2. and Trivino describe
Let us now look at how the Dijkstra’s algorithm learning process tomatically produces linguistic descriptions of driving activity from vehicle simulator data. W ¼ ð1; 1; 0; 0Þ and the selected expression is a : the active assessment report is obtained when the student completes more node selection error is very small. one simulation. this case, the importance of a simulation Alvarez-Alvarez and Trivino also employ GLMPthan together withInfuzzy finite state machines to W ¼ ð0; 1Þ, the active node selection error is not null. 1 e1!1
1 1
2 e1!1E Applications 39 (2012) W 3e1!23 ¼ ð1; 0Þ, the12177–12191 flow control error is acceptable. W 4e2!3 ¼ ð0:33; 1; 0; 0Þ, the distance and predecessor update
grows the more previous simulations the student has completed.
12189 do this, define the a vector of importances (seelinguistic Section 5.2) create a basic linguistic model of the human gaitToand towe generate human friendly error is
ubia et al. / Expert Systems with
as B = (12, 22, 32, . . .). In this example, the student has completed
Although all the perceptions can generate their respective small. simulations, and shows the interaction data. description of this phenomenon focused onforthe five assessment of Table the 3gait quality [8], log including partWof the report, will select the linguistic summaries ¼ ð0; 1Þ, thewedistance and predecessor update error is not 5 e2!3E
8
n a graph, where est path between e XML interaction 1/23, E2–3 = 3/10, re an assessment
Ps and linguistic ort follow:
n is a11 : the active
not null. ble. sor update error is
Table 4 shows the validity degrees and the informativeness of
2-CP , 2-CP and 2-CP , unless a great deal of detail is required. null. linguistic summaries Section 5.2).after the knee lerules which allowadjacent toGLMP provide explanations toisthe the descriptions as in(see “28 days ThisWway, ¼ the for theand simulation whose ð1;output 0Þ, theof the check selection errordata 6 e2!12
9
11
We select the two summaries with the greatest informativeness
are reasonable. E 1/11, E = 1/23, E E = 0/10 and generate the following report:the gait homogeneity is sion, the=ð1; gait quality is very= 3/10, low because the gait tosymmetry is low and W= 0.8¼is: 0Þ, the time taken to perform the algorithm simulation Time In this process of 5 simulations (where importance = i ), the cor1–1 7 time
1–23
2–3
2–12
2
is adequate. The activation and flow error is very low and the adjacent managerectness level achieved byfrom the student is verycubes satisfactory most of low”. In [77] the GLMP is used to create linguistic descriptions OLAP in inthe enment error is low, the correctness level achieved by the student is very the important simulations (truthfulness = 1), satisfactory in some of The vectors of obtained validity degrees of the 2-CPs, good, and the grade in this simulation is 7.31.the weighted the important simulations (truthfulness = 1), and the grade obtained ergy domain, such “Your behavior is inefficient, due to the high consumption, means,consumption the linguistic label membership degreesas over the weighted is 7.79. mean and the linguistic expressions selected for the natural lan-
6.2. Report on the learning process the quite devices and the low consumption at the low charge period”. guage report old follow: P 8 8 Let 8us now look at how the Dijkstra’s algorithm5j¼1learning process w %Acj W eaf ¼ ð1; 1; 0; 0; 0Þ, the weighted mean is P5 j 8 ¼ 0:1. The assessment report is obtained when the student completes more w j¼1 j than one simulation. In this case, the importance of a simulation linguistic label membership degrees over 0.1 are grows the more previous simulations the student has completed. (0.33, 0.33, 0, 0, 0), and the linguistic expression selected for To do this, we define the vector of importances (see Section 5.2) the report is a8 : The activation and flow error is very low. as B = (12, 22, 32, . .1.). In this example, the student has completed 5 P 9 w9j %Ac five simulations, and Table 3 shows the interaction log data. j 0; 0;validity 0Þ, the degrees weighted is j¼1P ¼ 0:15. W 9eam ¼ 5 Table 4 ð0:33; shows1;the andmean the informativeness of w9j the linguistic summaries (see Section 5.2). j¼1 We the twolabel summaries with thedegrees greatest informativeness Theselect linguistic membership over 0.15 are to generate following (0, 0.67, 0,the 0, 0), and thereport: linguistic expression selected for the 2 In this process of 5 simulations (where importance report is The adjacent management error is low. = i ), the correctness level achieved by the student is very satisfactory in most of W 10 ene ¼ ð0; 1Þ, The error in essential steps is not null. the important simulations (truthfulness = 1), satisfactory in some of the And, important simulations (truthfulness = 1), the andfollowing the grade vector obtained finally, the top-order-CP produces of is 7.79. degrees, linguistic expression and numerical grade: validity
6.3. Report on a set of simulations
Another interesting applied case where the GLMP has been used is provided by S´anchezWhen the aim is to assess the level of learning demonstrated by
of students in a Dijkstra’s algorithm examinaTorrubia et al. in [106], where this frameworka group has been used to model the simulation assessment of tion, we can apply a variant of top-order-CP, 2-CP12. We define
the vector of importance (seeaSection 5.2) simulation-based as B = (1, 1, 1, . . .) in order Dijkstra’s algorithm learning through an e-learning system using visual to assess the exercises of all the students equally. Table 5 shows
pdate error is not
data obtainedFigure by a group2.15 of eightshows students.two example graph algorithm learning environment, named the GRAPHs.
election error is
reports generated by this approach.
orithm simulation
Ps, the weighted ver the weighted the natural lan-
w8 %Ac8j ¼1 j 5 8
P
j¼1
wj
¼ 0:1. The
over 0.1 are sion selected for s very low. 5 P 9 9
s
j¼1
wj %Acj
5 P j¼1
w9j
¼ 0:15.
over 0.15 are selected for the . null.
llowing vector of ical grade:
P7 11 w %Acj j¼1 j P ¼ 0:731. 7 11 j¼1
wj
over 0.731 are istic expression chieved by the stusimulation is 7.31
P7 11 w %Acj 6.3. Report on a set of simulations 11 j¼1 j ¼ 0:731. W 11 as ¼ ð0; 0; 1; 0; 0:33; 1; 0Þ; Grade ¼ g G ðW as Þ P7 11
Report on a student’s learning process j¼1
wj
When the aim is label to assess the level of degrees learning demonstrated by The linguistic membership over 0.731 are a group of0.5929, students in a Dijkstra’s simulationexpression examina(0, 0, 0, 0.6571, 0, 0) andalgorithm the linguistic Figure 2.15: Examples of learning tion, we canforapply a variant top-order-CP, 2-CP12. We define selected the report is Theofcorrectness level achieved by the stuthedent vector of importance (seegrade Section 5.2) asinBthis = (1,simulation 1, 1, . . .) inisorder is very good, and the obtained 7.31 to assess the exercises of all the students equally. Table 5 shows the data obtained by a group of eight students. Table 6 shows the validity degrees and informativeness of the Table 3 linguistic summaries (see Section 5.2). Data of the learning process interaction log with its respective numerical By slightly amending the template for adaptation to the current assessments. case and choosing the two summaries with the greatest informaE1–1 E1–23 E2–3 Grade⁄10 tiveness, we generate the followingE2–12 report: Time In this group, level3/28 achieved by the students 3/7 0/15the correctness 3/11 0.85 4.09is very 1/5 1/18= 0.823),0.73 6.99 satisfactory in1/10 most cases2/7 (truthfulness satisfactory in some 3/9 0/19 6/16 0/40 0.31 4.94 cases (truthfulness = 1), and the average for this group is 7.23.
2.2.3
Remarks
Table 6 shows the validity degrees and informativeness of the linguistic summaries (see Section 5.2). By slightly amending the template for adaptation to the current case and choosing the two summaries with the greatest informativeness, we generate the following report: In this group, the correctness level achieved by the students is very satisfactory in most cases (truthfulness = 0.823), satisfactory in some cases (truthfulness = 1), and the average for this group is 7.23. 6.4. Analysis of assessor results
Report on a set of simulations
In the example shown in Section 6.2 (see Table 3), we find that the arithmetic mean of the grades obtained is 6.55; however, as indicated in the report, the grade provided by the GLMP is 7.79. assessment reports, as shown in [106]. This difference is due to the importance attached to the later simulations. Note also that the result of the third simulation is lower, which has a negative influence on the final grade. If we were to switch simulations 2 and 3, the final grade would be 8, that is, the model rewards the positive progress of learning. Table 4 Validity degrees and informativeness of the linguistic summaries for the learning process described in Table 3.
The application of fuzzy sets to model imprecise linguistic terms and obtain relevant linguistic TQS
Unsat
Sat
Very sat
IQS
Unsat
Sat
Very sat
0 with 0 Few 0.0303 0.1374 0.0739 information in the form of LDD0.8provides a flexibleFew way 10to deal ambiguity and0.1683 uncertainty 1/11 1/23 3/10 0/10 7.31 Some 1 0 Some 0 0
0/9 1/6 0/8 0.49 9.40 0 0 1 Most 0.0189 0.1657 0.1847 in natural1/19language. However, most of the LDDMost approaches which have emerged lack the 6.4. Analysis of assessor results
In the example shown in Section 6.2 (see Table 3), we find that the arithmetic mean of the grades obtained is 6.55; however, as indicated in the report, the grade provided by the GLMP is 7.79. This difference is due to the importance attached to the later simulations. Note also that the result of the third simulation is lower, which has a negative influence on the final grade. If we were to switch simulations 2 and 3, the final grade would be 8, that is, the model rewards the positive progress of learning.
40
Chapter 2. State of the art
richness and completeness of NLG texts, as they fit into the standard protoform “Q of X are A”, which is not enough to fulfill most real description needs. Another aspect in which NLG and LDD have followed separate paths is the evaluation process. As commented above, NLG systems rely on automatic and mostly human evaluations, which can be quantitative and/or qualitative. In the case of LDD, evaluation criteria (e.g. the data coverage percentage, the fuzzy fulfillment degree, or the specificity degree of a fuzzy quantifier, among others) were originally the only tool used to determine a priori the quality of a linguistic description in a formal and measurable way. However, despite being very useful, evaluation criteria alone do not provide information about many other issues which are vital when providing automatic descriptions to human users. For instance, a user may be provided with a linguistic description with high scores for every evaluation criteria but, if the description content is irrelevant to the user, the vocabulary is incorrect or the text is repetitive and badly expressed, then the linguistic description hardly fulfills any purpose. More recently, some authors have begun to employ techniques and methodologies which have been traditionally used in the NLG field. For instance, Eciolaza et al. proposed in [45] a questionnaire-based evaluation for a linguistic description approach on driving simulation environments, in which the experts provided a numerical score to several aspects of the linguistic descriptions. Thus, in order to test the usefulness of a linguistic description approach, some kind of evaluation must be performed beyond the solely application of evaluation criteria. The LDD research direction has a solid formal base, but its real potential is still waiting to be uncovered. However, although nowadays there are relevant research results in this domain, most of them (theoretical ones aside) present simple use cases whose application in real problems seems somehow limited, since the complexity of descriptions for real problems in terms of natural language is in general higher than what quantified sentences and the most complex linguistic descriptions currently provide. Furthermore, except in very simple cases, linguistic descriptions per se are not natural language texts that can be actually considered ready for direct human consumption, but rather a set of several linguistic structures which can be assigned to certain concepts or entities [142]. While to translate a quantified sentence into a text is a straightforward process, even a slightly complex description must deal with other aspects such as repetition, sentence aggregation, orthography, syntax and several issues outside the scope of LDD. These, as it has been described in this chapter, are in fact part of what NLG addresses. There is also a general lack of standard models that provide coherence among the different
2.3. General remarks about the integration of fuzzy techniques into NLG
41
elements in LDD or a guideline for the whole LDD production process, the only exception being the GLMP model depicted in Section 2.2.2. In this sense, there is a non-written consensus about the fuzzy elements and techniques that are used for LDD, but homogeneity in the state of the art approaches can only be found among single authors.
2.3
General remarks about the integration of fuzzy techniques into NLG
The NLG research discipline and the application of fuzzy sets for generating LDD have been reviewed in this chapter. Their objective is to offer information through one of the most powerful tools the human being has: language. As commented before, the natural language generation (NLG) and the creation of linguistic descriptions of data (LDD) are two domains which can be considered complementary. The first deals with the general problem of converting data into comprehensible texts, while the second one is focused on the abstraction of data into structured linguistic concepts through the use of fuzzy sets. These abstractions can be identified with the first task a standard data-to-text NLG system should perform (content determination, including signal analysis and data interpretation, as defined by Reiter in [98]). In this sense, an application development which combines both approaches is a feasible alternative. Thus, depending on the application domain restrictions and expert knowledge, which are the ones which usually determine the design and implementation of the solutions, the use of linguistic descriptions together with a natural language generation system is a feasible alternative to solve textual information generation problems. In fact, the success of the application of LDD techniques for solving real world problems is probably tied to its use in conjunction with NLG systems. In this context, LDD researchers should delve deeper into NLG issues beyond the use of simple templates, which is currently the only technique employed in the LDD domain to produce natural language texts from linguistic descriptions. Note that we do not imply with the previous statement that template-based NLG is inappropriate or inferior to standard NLG (although this does seem to be a rather extended perspective within the NLG field, where discussions on this issue have also been made, e.g., see the review by van Deemter et al. in [121]). The point here is that a deeper insight into NLG will greatly benefit LDD researchers, especially regarding the development of applied approaches for practical problems. In the same sense, fuzzy sets and their application for LDD can be a field of interest
42
Chapter 2. State of the art
for NLG researchers in several respects, including quantified sentences and potential derived extensions, evaluation criteria, algorithms and, more importantly, uncertainty and imprecision handling. For instance, another interesting convergence point between NLG and LDD is related to hybrid rule-based/machine learning approaches in NLG, which combine rule-based overgeneration of candidate texts with ranking based on machine learning techniques (e.g., the proposal by Varges and Mellish [123], described in Section 2.1.1). This kind of approaches resemble standard LDD algorithms which generate every possible candidate description (due to imprecision handling) and provide the fittest one according to several evaluation criteria. In fact, evaluation criteria in LDD can also provide another starting point to address a potential convergence between LDD and NLG. As described in Section 2.2.2, evaluation criteria are based on the conversational maxims from the human communication field [43], [48]. This kind of insights also have a deep influence on NLG, where, for instance, Gricean maxims have inspired early work [36], as well as more recent approaches [113]. This PhD dissertation fully addresses some of the points discussed in this chapter in the context of the integration of fuzzy techniques for LDD and D2T/NLG: • In order to provide a better organization of the techniques and elements used in LDD and its lack of models and methodologies, an LDD model is proposed for D2T/NLG content determination tasks in Chapter 3. • A real natural language generation system, GALiWeather, is described in Chapter 4, as a proof of the feasibility of integrating fuzzy techniques with more traditional data-totext systems. • A D2T service for describing the activity of students in an e-learning environment, SLAR, is depicted in Chapter 5. Both GALiWeather and SLAR were crucial in the conception of the model presented in the following chapter.
C HAPTER 3
A MODEL BASED ON COMPUTATIONAL PERCEPTIONS FOR CONTENT DETERMINATION IN DATA - TO - TEXT CONTEXTS
In the previous chapter, the application of fuzzy sets for linguistic description of data (LDD) was reviewed and some of the major issues it currently poses were identified, among which the lack of standard guidelines and models emerges as one of the most relevant problems. In fact, the only approximation to this problem is the granular linguistic model of a phenomenon (GLMP) [116], which was also described in Chapter 2. In this context, this chapter addresses the lack of standardization in LDD by introducing a general model for the linguistic description process, comprising and extending all the elements and tasks that take part in a LDD approach and providing a general broad methodology for the creation of LDD. The model presented in this chapter is conceived to provide a reorganization of the elements traditionally used in LDD. It considers not only basic concepts such as linguistic variables or fuzzy quantified statements, but also additional elements that are relevant in an actual LDD process (e.g. the context of the description, the object which is described, or the person who describes it). This model also adheres to the idea of computational perception, and draws inspiration from philosophical theories about human perception. As an example of application, the building of a LDD solution in the meteorology realm is
Chapter 3. A model based on computational perceptions for content determination in data-to-text contexts
44
presented. Additionally, the model has been designed as a guideline for a software library which allows the implementation of LDD applications that produce linguistic content to be used or integrated into an D2T/NLG systems. In other words, the software library would provide a set of tools that would allow to perform a fuzzy-based content determination task. The rest of this chapter is organized as follows. Section 3.1 provides preliminary insights into the design and conception of the model. Section 3.2 describes the model proposal in a thorough way, including a detailed description of each considered element. Section 3.3 provides an illustrative example of a standard LDD approach based on this model and several reflections regarding the current state of the model are given in Section 3.4.
3.1
Preliminary considerations
The roots of the model here described lie essentially in the concepts of fuzzy sets theory, but ideas from other different domains have also been taken into account, such as NLG and philosophy. Even so, the main source of inspiration comes from practical experiences, which are described in Chapters 4 and 5. In this sense, the purpose of the proposed model is that it can be used not only to characterize or design LDD approaches, but rather to implement them. Following [140], words play the role of labels of perceptions and, more generally, perceptions are expressed as propositions expressed in natural language, and The role model for computing with words and the computational theory of perceptions (CTP) is the human mind. Apparently, in [140] these concepts and the idea of linking computing with words with human perception come from a few references in psychology. However, although it is intuitive for most readers, it is not clear the specific meaning of “perception” in CTP except that A basic difference between perceptions and measurements is that, in general, measurements are crisp whereas perceptions are fuzzy. Other knowledge fields besides psychology have also addressed the problem of human perception from different points of view, including neurology and philosophy. Regarding the latter, every philosophical analysis about perception assumes, as a starting point, the distinction between the subject of perception and the object of experience [32]. Thus, the most fruitful analysis about perception emerges from the attempt to answer this question: how to reconcile some obvious truths about our experience of the world (objects of perception) with the possibility of perceptual errors (by subject of perception), namely illusions and hallucina-
3.1. Preliminary considerations
45
tions [15]. NATURAL LANGUAGE GENERATION SYSTEM CONTENT DETERMINATION
DOCUMENT STRUCTURING
LEXICALIZATION
REFERRING EXPRESSION GENERATION
AGGREGATION
LINGUISTIC REALIZATION
STRUCTURE REALIZATION
LINGUISTIC DESCRIPTIONS OF DATA DATA-TO-TEXT NLG SYSTEM SIGNAL ANALYSIS
DATA INTERPRETATION
DOCUMENT PLANNING
MICROPLANNING AND REALIZATION
Figure 3.1: Schema of the role of LDD in a general NLG system and a data-to-text NLG system.
There has traditionally been a lengthy discussion about this issue and several theories (and sub-theories) emerged during the last century. This explanation will focus on two of them: the sense-datum theory and the adverbial theory [32]. Both theories postulate that the subject does not perceive the object as it actually is in the world but only captures its phenomenal properties; i.e., those that can be perceived. For instance, one can see the brown color but is not able to see its wavelength, although it has one. Thus, the sense-datum theory asserts that phenomenal properties of an object constitute an indirect representation (sense-datum) of the real mind-independent objects of experience (indirect realism). It is worth noting that a perception process is constituted by two elements: i) the “act” of sensing and ii) the “object” which is sensed (perception as an “act-object” event). Linguistic descriptions show some kind of analogy with this “act-object” analysis, since objects are only available as a set of data considering multiple variables and linguistic descriptions (“act”) are performed on these representations of objects. On the other hand, the adverbial theory asserts that a perception is an event where the subject has experiences and these are modified accordingly to the mind-independent object. For instance, if somebody is “visually sensing a green triangle”, the adverbial theory states that the subject is “visually sensing greenly and trianglely”. This approach does not interpolate a sense-datum between the object and the subject (therefore, in this case there is not a two-phased process) but it states that a perceptual experience of the subject is given in a particular way (as an event). The phenomenal properties of the experience of perception are called “qualia”, understanding this concept in a broad sense; i.e., whatever qualities of a state
Chapter 3. A model based on computational perceptions for content determination in data-to-text contexts
46
CONTEXT TIME
PERCEPTIBLE
PERCEIVER
DESCRIPTION (set of perceptions)
VARIABLE 1
PERCEPTION 1
SPACE PERCEPTION PROCESS
VARIABLE 2
REASONING PROCESS
PERCEPTION 2
...
...
VARIABLE V
PERCEPTION P
KNOWLEDGE
Figure 3.2: Global overview diagram of the LDD model
of mind. In this sense, one can understand perceptions in CTP as events which are simultaneously modified to a certain degree as a result of an experience. For instance, a robot laser sensor may obtain a certain measurement (an experience) of the distance to a wall, which would instantiate several fuzzy distance labels (“qualia”) in different degrees. Following the schema of the adverbial theory, the robot would be “experiencing nearly” with a truth degree of 0.45 (a “quale”) and “experiencing mediumly” with a truth degree of 0.55 (another “quale”). Within this context, philosophy (as well as other knowledge fields that have traditionally dealt with human perception) is very helpful for providing definitions for some concepts, elements and ideas that are valuable (and essential) for defining a general-purpose LDD model that can be used to generate LDD for real NLG systems. In consequence, the context of the approach here presented is that of a generic D2T/NLG system, where, as indicated in Chapter 2, the model here described could be used to design and implement a content determination task, which is in fact the process of deciding what information should be communicated in the text [100], i.e., essentially what an LDD approach does in a linguistic way. In a data-to-text NLG context [98], the equivalent tasks to content determination covered by LDD include signal analysis and data interpretation (see Fig. 3.1).
3.2
Model description
In its highest abstraction level, the LDD model considers a context, where a set of perceptibles and perceivers is defined. In short, each perceiver, through its own perception process, extracts relevant information from a perceptible in the form of instantiated perceptions and produces a
3.2. Model description
47
linguistic description (a set of perceptions) as a result. For simplicity and clarity in subsequent explanations, only a single perceptible and perceiver will be considered, as Fig. 3.2 shows. In this section the most important concepts in the model are defined following a top-down order of abstraction which can be followed in Figs. 3.2, 3.3 and 3.4, from the concept of context to the smallest granularity knowledge elements. PERCEIVER PERCEPTION PROCESS RAW PERCEPTION (set of qualia)
PERCEPTION QUALE 1
CANDIDATE QUALE 1 PERCEPTION ALGORITHM
CANDIDATE QUALE 2
PERCEPTION EVALUATION
QUALE 2 ...
... CANDIDATE QUALE Q
QUALE U
KNOWLEDGE
Figure 3.3: Perceiver detailed schema (excluding the reasoning process).
Context Context is the general framework where the perception process is performed, which can be of any type. In the case of LDD, the context addresses the particular situation where an expert in a specific domain (for instance, in meteorology a meteorologist; in economy, an economy analyst, etc.), namely perceiver, draws up a report with his/her assessments (linguistic description) on a number of data sets (perceptible). From a general point of view, these three concepts can be characterized as follows: • A perceptible is an entity containing a set of related data variables, while each variable contains a set of values. These values may be numeric or symbolic and can also be ordered following a certain criterion, where time is usually the most common one (i.e., temporal series).
48
Chapter 3. A model based on computational perceptions for content determination in data-to-text contexts • A perceiver is an entity composed of two elements: a set of perception processes and a set of knowledge elements used in these processes. A third, optional element consisting in a generic reasoning process has also been considered, but its analysis is out of the current aim of the model. Still, some insights about possible ways in which this element could be addressed in an extension of the model will be provided in Section 3.4. • A linguistic description, as a set of perceptions resulting from the perception processes taking place within a perceiver. Each perception in the description might refer to one or several variables of the perceptible at the same time, depending on its content and complexity. A context may also have several properties related to time and space, which help determine
the nature of the perceptible variables. Perceiver The perceiver is a key element in this model, since, as indicated before, it involves the perception process and the elements defining its knowledge (Fig. 3.3). In this sense, this provides enough flexibility to support the concept of perceiver profiles. For instance, within a given context, one can define two different perceivers sharing a same perception process but using different knowledge elements. This can be useful in order to model domains where two or more experts perform the same description task but have differences in the way they perceive or understand certain things. In other cases, it may also be necessary to model perceivers with the same knowledge but different perception processes. The perception process is a two-staged method receiving a perceptible as input and providing an output perception: 1. The perception algorithm is a domain-dependent algorithm tasked with the instantiation of a raw or candidate perception. In this sense, as the final linguistic description is defined as a set of perceptions from different perception processes, a perception is a set of primitive qualia containing structured linguistic information extracted from the perceptible data. 2. The perception evaluation is also a domain-dependent algorithm which applies several criteria on the raw perception in order to evaluate its qualia and select the ones with the
3.2. Model description
49
highest quality according to the criteria. As a result, a perception including the fittest qualia is produced. It is worth noting that, although a two-staged perception process is proposed, there are other alternative approaches that can modify this structure. For instance, the use of metaheuristic approaches for the perception process merges the perception algorithm and the perception evaluation, the latter being included in the form of an optimization function within the perception algorithm. In other situations, in case the application domain does not require the use of evaluation criteria or imprecision or uncertainty are not an issue (e.g. using a crisp knowledge base), a heuristic perception algorithm may directly produce the final perception avoiding its evaluation stage. Another relevant aspect regarding the perception process is that several perception processes can occur simultaneously within a single perceiver (although, for the sake of clarity, Figs. 3.2 and 3.3 reflect a single perception process). Thus, depending on the application domain requirements, each perception process may focus on different specific variables from a single perceptible at the same time. Knowledge elements During the perception process, perceptions are instantiated following the perceiver’s knowledge, which comprises several elements including qualia, linguistic variables, evaluation criteria, etc. In general, every knowledge element is related both directly and indirectly to other elements, as Fig. 3.4 shows, and a modification in any of them may affect the others. A hierarchy attending to concept of relevance can be defined among knowledge elements. Linguistic variables are the key concept in this model, since they serve as nexus between the more complex qualia and the simplest elements, such as labels and functions. The classical definition of linguistic variable is followed in this case [138], which allows to define linguistic properties on perceptible variables. For instance, a linguistic variable “color” can be defined on a perceptible variable containing light wavelength data. More specifically, a linguistic variable is a set of labels representing linguistic concepts, where each label has an associated membership function. Membership functions are usually fuzzy sets, which allow to model the imprecision of human concepts. However, crisp numeric intervals and categories (a classification of symbolic values into several labels, where the membership function determines if a symbol is associated to a certain label) have also been considered, since these are generally present in applied domains (see Chapters 4 and 5).
50
Chapter 3. A model based on computational perceptions for content determination in data-to-text contexts KNOWLEDGE ELEMENTS QUALIA EVALUATION CRITERIA QUANTITATIVE QUALE
TEMPORAL QUALE
DATA COVERAGE
TRUTH DEGREE
AMBIGUITY
QUALITATIVE QUALE SIMPLE
TYPE I
...
COMPLEX
SPECIFICITY
LENGTH
COMPATIBILITY
TYPE II
LINGUISTIC VARIABLE PERCEPTIBLE PROPERTIES / LINGUISTIC VARIABLES (types) QUALITATIVE
QUANTITATIVE
LABEL 1
LABEL 2
...
LABEL L
FUNCTION 1
FUNCTION 2
...
FUNCTION F
TEMPORAL
FUNCTION (types) CRISP INTERVAL
FUZZY SET
TRIANGLE
CATEGORY
TRAPEZOID
...
Figure 3.4: Knowledge elements within a perceiver.
Three different uses of linguistic variables are distinguished in this model according to the nature of the linguistic concepts they define (although other may be considered in potential extensions): • Qualitative linguistic variables, defining a quality property on a perceptible variable (e.g., height = {short, medium, tall}). • Quantitative linguistic variables, defining a set of quantifiers (e.g., {a few,some, several, many, most of }). • Temporal linguistic variables, defining intervals in a time domain (e.g., course periods = {course start, half-course, course end}). Linguistic variables are the necessary basic elements to generate qualia, the primitive
3.2. Model description
51
elements of a perception. In this sense, qualia determine the content and expressiveness of a perception, since each type of quale is associated to a specific kind of proposition. The following types of qualia, which are defined incrementally, are considered: • Qualitative, which follow the expression “X are A”, where X is a referential set (data from a perceptible) and A can be either i) a linguistic label from a qualitative linguistic variable (simple qualitative quale) or ii) a composition of several linguistic labels from different variables (complex qualitative quale). • Temporal, which follow the expression “X in T ”, where T is a linguistic label from a temporal linguistic variable. Qualitative and temporal qualia can be composed in order to obtain a fuzzy temporal proposition such as “X are A in T ”. • Quantitative, directly matching the expression of fuzzy quantified sentences. In this sense, the classical protoform categorization of quantified sentences is followed [40]. Thus, type-I quantitative quale (“Q X are A [in T ]”) and type-II quantitative quale (“Q A [in T ] are D”) are distinguished. Quantitative qualia are constructed using the following elements: i) qualitative qualia (optionally combined with a temporal quale), ii) a linguistic quantifier, and iii) a quantification model. In order to maintain flexibility, specific quantification models are not considered, since their level of appropriateness in an applied approach largely depends on how their behavior and properties fit the domain computational requirements [40]. In order to measure the quality of candidate qualia during the perception process, this LDD model supports the use of evaluation criteria. Each criterion is a (usually numeric) property which can be defined and assigned to a given qualia type. In this sense, every criterion provides a measurement which allows to compare the quality of qualia of the same type for that given criterion. In many cases, the numeric values of the criteria are enough to discern the best candidate qualia. However, in other situations it may be necessary to define evaluation functions on these criteria, whose result can be aggregated in a certain way. The generality of the evaluation process within a perceiver provides the flexibility to support this and even more complex kind of evaluations.
Chapter 3. A model based on computational perceptions for content determination in data-to-text contexts
52
Although Fig. 3.4 shows some of the most common criteria in LDD [43, 23, 129], no specific type is considered in this model, for the same reasons of generality and flexibility that apply to quantification models. In fact, even for same qualia types different criteria may be required depending on the LDD context requirements.
3.3
An illustrative example
The following example shows how a LDD approach can be built from the generic model, in this case generating a simple description from the time series of two meteorological variables (temperature and humidity). For this, each element involved in the linguistic description process will be described (following again a top-down abstraction perspective). For illustration and self-containment purposes, the LDD and the perception processes herein described account for a part of the model.
3.3.1
Context definition
• Context: A meteorology agency department tasked with the creation of weather reports on historic data series. Within this context, there are a single perceiver and a single perceptible. • Perceiver: An expert meteorologist leading the weather report department. • Perceptible: A meteorological station which collects and stores weather sensor data over time.
3.3.2
Perceptible definition
A meteorological station which collects data from two different sensors (Fig. 3.5) over time: • Variable 1: Average daily temperature. Measured in degrees Celsius. • Variable 2: Average relative daily humidity. Measured as a percentage.
3.3.3
Perceiver definition
The perceiver aims to provide a report on the perceptible data. For this, three different perception processes occur within the perceiver: i) a perception of the quantity of days with a
3.3. An illustrative example
53
given humidity and temperature, ii) a perception of the quantity of days with a given humidity for a given temperature, and iii) a perception about the most relevant time periods regarding temperature. Perception process 1 • Perceptible variables: Temperature, Relative humidity. • Qualia types: Simple qualitative qualia, complex qualitative qualia, type-I quantitative qualia. • Linguistic variables: Temperature (qualitative, fuzzy), Relative humidity (qualitative, fuzzy), Relative number of days (quantitative, fuzzy). • Evaluation criteria: Truth degree on type-I quantitative qualia. The perception algorithm in this perception process performs the following tasks:
Figure 3.5: Observational weather data set of the perceptible in this example.
54
Chapter 3. A model based on computational perceptions for content determination in data-to-text contexts 1. For every linguistic label in Temperature, a simple qualitative qualia is instantiated on the perceptible temperature variable data (e.g., “DAYS with a LOW TEMPERATURE”,...,“DAYS with a HIGH TEMPERATURE”). 2. For every linguistic label in Relative humidity, a simple qualitative qualia is instantiated on the perceptible humidity variable data (e.g. “DAYS with LOW humidity”,...,“DAYS with HIGH HUMIDITY”). 3. For every possible combination of Temperature and Humidity simple qualitative qualia, a complex qualitative qualia is instantiated using the t-norm “min” as the combination operator (e.g. “DAYS with LOW TEMPERATURE and LOW HUMIDITY”, “DAYS with LOW TEMPERATURE and MEDIUM HUMIDITY”, ..., “DAYS with HIGH TEMPERATURE and HIGH HUMIDITY”). 4. For every possible label in Relative number of days and every Temperature-Humidity complex qualitative qualia, a type-I quantitative qualia is instantiated using Zadeh’s quantification model (e.g. “A FEW DAYS have LOW TEMPERATURE and LOW HUMIDITY”, ..., “MOST OF THE DAYS have LOW TEMPERATURE and LOW HUMIDITY”, ..., “MOST OF THE DAYS have HIGH TEMPERATURE and HIGH HUMIDITY”). 5. As a result, a “raw” perception containing every instantiated type-I quantitative qualia is given, where each qualia has an associated truth degree. The perception evaluation ranks the candidate qualia in a descending order according to
their truth degree and eliminates qualia with a low truth degree. As a result, a perception including the best qualia is produced. Perception process 2 • Perceptible variables: Temperature, Relative humidity. • Qualia types: Simple qualitative qualia, type-II quantitative qualia. • Linguistic variables: Temperature (qualitative, fuzzy), Relative humidity (qualitative, fuzzy), Relative number of days (quantitative, fuzzy). • Evaluation criteria: Truth degree on type-II quantitative qualia.
3.3. An illustrative example
55
The perception algorithm in this perception process performs the following tasks: 1. For every linguistic label in Temperature, a simple qualitative qualia is instantiated on the perceptible temperature variable data (e.g., “DAYS with a LOW TEMPERATURE”,...,‘DAYS with a HIGH TEMPERATURE”). 2. For every linguistic label in Relative humidity, a simple qualitative qualia is instantiated on the perceptible humidity variable data (e.g. “DAYS with a LOW humidity”,...,“DAYS with a HIGH HUMIDITY”). 3. For every possible label in Relative number of days, every Temperature simple qualitative qualia and every Humidity simple qualitative qualia, a type-II quantitative qualia is instantiated using Zadeh’s quantification model (e.g. “A FEW DAYS with LOW TEMPERATURE have LOW HUMIDITY”, ..., “MOST OF THE DAYS with LOW TEMPERATURE have LOW HUMIDITY”, ..., “MOST OF THE DAYS with HIGH TEMPERATURE have HIGH HUMIDITY”). 4. As a result, a “raw” perception containing every instantiated type-II quantitative qualia is given, where each qualia has an associated truth degree. As in Perception process 1, the perception evaluation ranks the candidate type-II quantitative qualia in a descending order according to their truth degree and eliminates qualia with a low truth degree. Perception process 3 • Perceptible variables: Temperature. • Qualia types: Simple qualitative qualia, temporal qualia. • Linguistic variables: Temperature (qualitative, fuzzy). • Evaluation criteria: Average truth degree on temporal qualia. The perception algorithm in this perception process performs the following tasks: 1. For every linguistic label in Temperature, a search method is performed on the perceptible temperature variable data. This method applies the linguistic labels to filter each value and aggregates time intervals of contiguous temperature labels.
Chapter 3. A model based on computational perceptions for content determination in data-to-text contexts
56
2. Simple qualitative qualia are instantiated from the aggregated filtered data, while temporal qualia are instantiated from their corresponding qualitative qualia. In this case, the temporal labels associated to each temporal qualia do not come from already defined temporal linguistic variables in the perceiver knowledge, but are given by each extracted data interval in a crisp way (e.g. “COLD in [09Oct, 14Oct]”, “WARM in [28Sep, 08Oct]”, “WARM in [15Oct, 23Oct]”). 3. As a result, a “raw” perception containing every instantiated temporal qualia is given, where each qualia has an associated average truth degree. As in Perception processes 1 and 2, the perception evaluation ranks the candidate temporal qualia in a descending order according to their average truth degree and eliminates qualia with a low truth degree.
3.3.4
Linguistic description
The linguistic description provided by this LDD approach is a set of the three perceptions resulting from Perception processes 1, 2 and 3. For the data in Fig. 3.5, the following linguistic description is obtained: • Perception 1: Most of the days the temperature was warm and the relative humidity was high, A few days the temperature was warm and the relative humidity was medium. • Perception 2: Most of the days with warm temperature the humidity was high, Most of the days with low temperature the humidity was high, A few days with warm temperature the humidity was medium. • Perception 3: There was a warm temperature episode from the 28th of September to the 8th of October, a cold episode from the 9th to the 14th of October and a warm episode from the 15th to the 23rd of October.
3.4
Remarks about the model
The model proposal described in this chapter not only does define the elements typically involved in LDD solutions, but also addresses how these are structured and provides a general guideline for the tasks which compose an LDD process and which are not usually considered in the literature. This model already considers all the expressions usually considered in the
3.4. Remarks about the model
57
LDD literature, and its flexibility will allow to expand its expressiveness to support more general and complex descriptions beyond classical LDD. For this, new types of qualia can be defined both separately or based on already present simpler qualia. Another important aspect for the extension of this model is the inclusion of a reasoning process within a perceiver. Regarding this, the flexibility of the rest of the elements should be kept and different reasoning approaches beyond classical fuzzy inference rules should also be taken into account. For instance, attending to those qualia with a form of quantified statement, syllogistic inference patterns could be applied. Taking into account the previous considerations, the expressiveness of this model can be improved by means of: • Studying and exploring different reasoning approaches to be applied on the resulting perceptions within a perceiver (fuzzy rules, syllogisms, etc.) • Developing a software library which follows and implements the essential ideas and elements of the model. Its use in practical applications would provide useful feedback to change or modify the underlying model. • Defining new types of expressions or qualia based on the language requisites captured in new real applied LDD-D2T applications, such as the ones described in the following chapters of this PhD dissertation. In fact, regarding the latter model extension point, most of the ideas and elements of the model are an abstraction of techniques and concepts employed in the development of two applied solutions. These applications, GALiWeather and SLAR, are thoroughly described in Chapters 4 and 5.
C HAPTER 4
GAL I W EATHER : A TEXTUAL WEATHER FORECAST GENERATION SYSTEM
In this chapter a thorough explanation of the conception, design and technical implementation of a textual weather forecast generation system for several meteorological variables is given. Such solution, named GALiWeather, was developed in order to address an actual need by the Galician Meteorology Agency (MeteoGalicia), in NW Spain. GALiWeather presents a real use case in which the application of fuzzy set-related techniques were used to fill some gaps in the domain-modeling process, where expert guidelines for the content determination of the cloud coverage variable were not available and the meteorologists were not able to provide exact definitions of the language and knowledge required to describe the aforementioned variable. In this regard, GALiWeather employs fuzzy sets to model temporal labels and perform fuzzy quantification to obtain qualitative information which describes the cloud coverage in different ways. The rest of the weather variables included in the automatically generated textual are processed in a similar manner, but use crisp definitions instead. In this regard, the content determination task in GALiWeather is referred to as a first stage in which intermediate linguistic descriptions are obtained. The intermediate linguistic descriptions are converted (realized) into actual texts through the use of a mix of templates and specific logic which performs aggregation operations to shorten the generated sentences. GALiWeather was evaluated by an expert meteorologist through standard evaluation tech-
60
Chapter 4. GALiWeather: A textual weather forecast generation system
niques which measure the quality of the texts for both content and language dimensions. It was later deployed in May 2015 for actual service as part of MeteoGalicia’s systems, where it has been producing daily textual forecasts for 315 locations since then. The next section introduces the context in which this solution has been devised. In Section 4.2 a formal description of the forecast input data and the linguistic description computational method is provided, followed by an extensive overview of the NLG system and Section 4.3 addresses the evaluation process and its associated results obtained by GALiWeather.
4.1
Short-term web forecasts for Galicia
The operative weather forecasting offered by the Galician (NW Spain) Meteorology Agency through its website (MeteoGalicia [78]) consisted until recent years of a global description of the short-term meteorological trend (Fig. 4.1). This service was improved in 2012 in order to provide visitors with symbolic forecasts for each of the 315 municipalities in Galicia, thus improving its quality and allowing users to obtain more precise weather information about specific locations of the Galician geography.
Friday, 12th April 2013
Morning 7-14h
Afternoon 14-20h
Night 20-7h
The sky will be cloudy, with intermittent precipitations. The mininum temperatures will not change or will decrease slightly, whereas the maximums will not have significative changes. The wind will blow from the Southwest with moderate intensity, getting more intense as the night comes in. Figure 4.1: Example of a real weather forecast for 12th April, 2013 for Galicia, published at [78].
Figure 4.2 shows the 2012-2015 web application for consulting municipality forecasts
4.1. Short-term web forecasts for Galicia
61
[78], which has been graphically divided in blocks for an easier explanation. Block 1 contained a shortcut list to the seven most important municipalities in Galicia, which allowed a direct access to their forecast data (the user can select a favorite municipality, which is loaded by default in posterior visits). Block 2 allowed the users to search for the rest of the municipalities, which were grouped according to the Galician province they belong to. It also allowed to add the selected municipality to the shortcut list in Block 1. The short-term forecast is shown in Block 3, which offered symbolic data for wind and sky state and numeric data for temperatures for four days, including morning, afternoon and night each day. Block 4 shows the mid-term forecast for several days and includes a global comment about the weather in Galicia in general, which consequently remained the same for every municipality.
1
3
2 4
Figure 4.2: 2012-2015 short-term and mid-term municipality forecast web application for Galicia [78].
This increase in the quantity of available numerical-symbolic data had a main downside: a lack of natural language forecasts which described this set of data. This issue made forecasts harder to understand, since users needed to look at every symbol and detect which phenomena were relevant and when they would occur, whereas natural language descriptions would directly provide all this information. In the case of a mid-term forecast, its uncertainty allows the inclusion of a global regional description, which is still written by a meteorologist.
62
Chapter 4. GALiWeather: A textual weather forecast generation system
However, for short-term forecasts, which are much more accurate, the Galician meteorological diversity causes that several meteorological phenomena may occur at the same time in different areas. In this context, to issue daily textual forecasts upon 315 municipalities was not feasible for a reduced group of meteorologists who had to attend to other higher duties, as is the case with MeteoGalicia. In order to address this issue, the application GALiWeather was developed. This text generation system generates linguistic descriptions from short-term data that include revelant meteorological information. The style and contents of the natural language linguistic descriptions generated for each location follow the guidelines provided by an expert meteorologist (and are partly similar to the regional forecast presented in Fig. 4.1). With the actual deployment of GALiWeather in May 2015, MeteoGalicia’s web site was further upgraded to include the automatically generated texts (Fig. 4.3), which are produced twice on a daily basis, coinciding with the update of the municipality weather data.
Figure 4.3: Current short-term and mid-term municipality forecast web application for Galicia [78].
4.2
Application description
GALiWeather employs numerical-symbolic forecast data and additional expert information to generate the final output textual weather forecasts in two separate tasks. The first task
4.2. Application description
63
converts the numerical-symbolic input data into linguistic descriptions (encoded in an intermediate language). These descriptions are created through a computational method which abstracts data values into linguistic labels, some of which model imprecise concepts and temporal references. In the second stage, an NLG module translates the intermediate codes into a natural language forecast for one of the available final output natural languages, which is ready for human consumption. A general schema of this process is shown in Fig. 4.4. Numericalsymbolic forecast database Partition sets, collections, fuzzy partitions
Information extraction
Intermediate code
Natural language templates Natural language forecast
Natural language generation
Figure 4.4: General schema of the application architecture.
4.2.1
Input weather forecast data characterization
MeteoGalicia’s database offers a dataset which covers all the 315 Galician municipalities and includes forecast data associated to several items in a four-day temporal window. This data is heterogeneous in its nature and includes values in degrees Celsius and weather symbols represented by codes. For instance, the meteorologists characterize the sky state phenomena as 21 numerical codes (values in the interval [101,121]) and the wind phenomena as 34 numerical codes (values associated to a given intensity and direction in the interval [299,332]). These numerical codes are used to display graphical symbols in the forecast website. Figure 4.5 shows an example of a real short-term forecast data series. Formally, each municipality M has an associated forecast data series set FDM = {SSM , WM , T MAXM , T MINM } , which includes data series for the input variables considered: sky state (SSM ), wind (WM ) and maximum (T MAXM ) and minimum (T MINM ) temperatures. For clarity reasons, without loss of generality, a single municipality data series will be considered
64
Chapter 4. GALiWeather: A textual weather forecast generation system
Figure 4.5: Real example of a data source for a given location used in the generation of the automatic weather forecasts.
in the explanations that follow (FDM = FD). Each data series element in FD is characterized in what follows: • Sky state (SS). It provides three numerical codes per day (morning, afternoon, night) about two meteorological variables of interest, namely cloud coverage and precipitation. From a formal point of view, SS = {ss1 , . . . , ssi , . . . , ss12 }, where ssi ∈ [101, 121]∀ssi ∈ SS. Each code in the interval [101, 121] has a specific sky state meaning (for example, 111 means “covered with rain”). • Wind (W ). It provides three numerical codes per day about the wind intensity and direction. W = {w1 , ..., wi , ..., w12 }, where wi ∈ [299, 332]∀wi ∈ W . Each code in the interval [299, 332] has an associated wind direction and intensity (for instance, 317 means “strong wind from the North”). • Temperature (T MAX and T MIN). Maximum and minimum forecasted temperatures are given in degrees Celsius with a resolution of 1 degree and one value per day: – T MAX = {tmax1 ,tmax2 ,tmax3 ,tmax4 }, where tmaxi ∈ [−60◦C, 60◦C]∀tmaxi ∈ T MAX. – T MIN = {tmin1 ,tmin2 ,tmin3 ,tmin4 }, where tmini ∈ [−60◦C, 60◦C]∀tmini ∈ T MIN. For each forecast data series FD, our application obtains linguistic descriptions about seven forecast variables, namely cloud coverage, precipitation, wind, maximum and minimum
4.2. Application description
65
temperature variation and maximum and minimum temperature climatic behavior 1 . For this, a computational method divided in several linguistic description generation operators was devised.
4.2.2
First stage: Linguistic description generation method
The first stage of GALiWeather obtains a linguistic description for every variable, which consists in sets of linguistic labels and temporal references which contain the relevant information extracted from the raw data. This process, as it can be seen in Fig. 4.6, consists in providing to each linguistic description operator its corresponding data and expert knowledge (in the form of crisp and fuzzy partition sets and numeric categories) in order to generate the intermediate linguistic descriptions. Each operator is formally described in what follows. Location data Partition sets BEGINNING
1
HALF
Sky state
Wind
Temperature
END
Truth degree
0.8 0.6 0.4
LDD Operators
0.2 0
0
1
2
3
4
5
6
7
8
9
10
11
Meteorological value index
1
Precipitation
0.8
0.6
Cloud coverage
Wind
Temperature
0.4
0.2
0 20
40
60
80
100
Chronological
Max variation Max behavior
OCCASIONAL RELEVANT PREDOMINANT
1
Fulfillment degree
0
0.8
Global
0.6
Min variation
Min behavior
0.4 0.2 0
0
0.2 0.4 0.6 0.8 1 Relative quantity of cloud coverage category
Linguistic descriptions
Figure 4.6: Global schema of the linguistic description generation method.
Cloud coverage fuzzy operators Two different fuzzy operators are used in the linguistic description generation of the cloud coverage variable. The first one provides a chronological description, while the second one provides a short-term global description when the previous description is not appropriate. 1 It measures the difference between the forecasted temperatures and the temperature climatic mean, defined as the average for the previous 30 years in a given month.
66
Chapter 4. GALiWeather: A textual weather forecast generation system 1. Chronological description fuzzy operator. • Input: – Sky state data series SS = {ss1 , . . . , ssi , . . . , ss12 }. – A temporal fuzzy linguistic partition CCT = {cct1 , . . . , cct j , . . . , cctn }, where each temporal linguistic term cct j has an associated fuzzy membership function µcct j : N → [0, 1]. For our application, CCT = {BEGINNING, HALF, END} (Fig. 4.7). – A cloud coverage linguistic variable, defined as a set of cloud coverage categories CCL = {ccl1 , . . . , cclk , . . . , cclm }. Each linguistic term cclk ∈ CCL has an associated crisp membership function µcclk : N → {0, 1}, defined as: 1 if ss ∈ ccl i k µcclk (ssi ) = (4.1) 0 otherwise In our application, CCL = {C, PC,VC} (“clear”, “partly cloudy”, “very cloudy”), as shown in Fig. 4.7. • Procedure. This operator provides the most appropriate cloud coverage linguistic term cclk for each temporal subdivision cct j . A relevance degree is calculated for each pair of cloud coverage and temporal labels and the label pairs with the highest degree are then selected (one per temporal label): – Relevance degree matrix RD, where each value RD j,k determines the importance a cloud coverage linguistic term cclk has within a temporal sub period |SS|
cct j : RD j,k = ∑ µcclk (ssi ) ∗ µcct j (i) i=1
– Set of the most appropriate cloud coverage label for each temporal label, ordered by the temporal partition index j: CCT L = {(cct j , cclk )|RD j,k = max(RD j )} • Output. A chronological cloud coverage linguistic description as an intermediate code characterized by the following concatenation: LDChronoCC → (cct1 , cclk ) . . . (cctn , cclk ) Figure 4.7 shows the definitions of both linguistic variables for our application and an example of the chronological cloud coverage linguistic description process. This description is provided only if the following experimental condition is fulfilled: ∀(cct j , cclk )
4.2. Application description
67
∈ CCT L, RD j,k ≥ 3. This condition ensures that every cct j has an associated predominant cloud coverage type cclk , while maintaining tolerance to the appearance of other cloud coverage categories in SS. Otherwise, the linguistic description generated by the second operator is provided. C
CCL =
PC
VC
Current day
SS =
CCT =
BEGINNING
Fulfillment degree
1
HALF
ss1
ss2
ss3
Tomorrow
ss4
RD =
END
0.8
ss5
BEG.
ss7
ss8
3 days after
ss9
C
PC
VC
1
3.1
0.14
HALF 0.29 END
0.6
2 days after
ss6
3
1.72
3.43
0
1.24
ss10
ss11
ss12
0.4 0.2 0
1
2
3
4
5
6
7
8
9
10
11
12
LDChronoCC
(BEGINNING, PC) (HALF, VC) (END, C)
Meteorological value index
Figure 4.7: Chronological description fuzzy operator definitions and process example.
2. Global quantification description fuzzy operator. This operator provides a global description of the cloud coverage state for the whole short-term period. • Input: – Sky state data series SS = {ss1 , . . . , ssi , . . . , ss12 }. – A cloud coverage predominance linguistic label CCQ = {ccq1 , . . . , ccq j , . . . , ccqn }, where each linguistic term ccq j has an associated fuzzy quantifier µccq j : [0, 1] → [0, 1]. In our case, CCQ = {OCCASIONAL, RELEVANT, PREDOMINANT } (Fig. 4.8). – A cloud coverage linguistic variable CCL, as defined in the previous operator. • Procedure. This operator quantifies the occurrence of the different cloud coverage categories cclk using Zadeh’s quantification model [137]: |SS| µ (ss ) i cclk |SS| ) i=1
– Fuzzy fulfillment degree matrix FD, where FD j,k = µccq j ( ∑
– Set of cloud coverage label and quantifier label pairs with the highest fulfillment degree: CCQL = {(ccq j , cclk )|FD j,k = maxl FDl,k }, where j is minimum.
68
Chapter 4. GALiWeather: A textual weather forecast generation system • Output. A cloud coverage linguistic description as an intermediate code characterized by the following concatenation: LDQuanti fCC → (ccq j , ccl1 ) . . . (ccq j , cclm ) Figure 4.8 shows the definition of the fuzzy quantifiers µccq j and an example of this linguistic description process. CCL =
C
PC
VC
Current day
SS =
ss1
ss2
ss3
Tomorrow
ss4
ss5
2 days after
ss6
C
CCQ =
OCCASIONAL RELEVANT PREDOMINANT
Fulfillment degree
1 0.8
FD =
ss7
ss8
ss9
PC
VC
OCC. 0.75
0
0.75
REL.
0.25
1
0.25
PRED.
0
0
0
3 days after
ss10
ss11
ss12
0.6 0.4 0.2 0
0
0.2 0.4 0.6 0.8 1 Relative quantity of cloud coverage category
LDQuantifCC→ (OCCASIONAL, C) (RELEVANT, PC) (OCCASIONAL, VC)
Figure 4.8: Global quantification description fuzzy operator definitions and process example.
Precipitation episode extractor operator This operator extracts precipitation episodes from the sky state values. These periods are classified according to the kind of precipitations detected: • Input: – Sky state data series SS = {ss1 , . . . , ssi , . . . , ss12 }. – A precipitation linguistic variable, defined as a set of precipitation categories PV = {pv1 , . . . , pv j , . . . , pvn }, where each linguistic term pv j has an associated crisp membership function µ pv j : N → {0, 1}, where µ pv j is defined identically as µcclk in expression (4.1). • Procedure. This operator extracts an ordered set of precipitation episodes PE = {pe1 , . . . , pek , . . . , pem }, where each episode is characterized as pek = {START, END, LABELS}.
4.2. Application description
69
The algorithm in Fig. 4.9 describes how the precipitation operator extracts the relevant episodes from SS: procedure P RECIPITATION E PISODE E XTRACTOR(SS,PV ) PE ← {} pek ← Ø while i < |SS| do active period ← False for all pv j ∈ PV do if µ pv j (ssi ) = 1 then if pek 6= Ø then pek .LABELS ← pek .LABELS ∪ pv j else pek ← {START, END, LABELS} pek .START ← i pek .LABELS ← {pv j } PE ← PE ∪ pek end if active period ← True break end if end for if ¬active period & pek 6= Ø then pek .END ← i − 1 pek ← Ø end if i ← i+1 end while if active period & pek 6= Ø then pek .END ← |SS| end if return PE end procedure Figure 4.9: Precipitation episode extractor procedure.
• Output. A precipitation linguistic description for each precipitation episode pek as an intermediate code characterized by the following concatenation of terms: LDPrecipitationk → STARTk ENDk LABELSk In this case, PL = {I, P, SN, ST, H} (“intermittent”,“persistent”,“snow”,“storm”,“hail”) is defined for precipitation (although “intermittent” and “persistent” are not explicitly included
70
Chapter 4. GALiWeather: A textual weather forecast generation system
in the final natural language forecasts, as required by the meteorologists). Figure 4.10 shows the definition of PL and provides a graphical example of the precipitation linguistic description generation process. Current day
SS = PV =
ss1
ss2
I
ss3
P
Tomorrow
ss4
SN
ss5
ST
2 days after
ss6
ss7
ss8
3 days after
ss9
ss10
ss11
ss12
H
Precipitation operator
LDPrecipitation1→ START = 2 END = 4 LABELS = I I I LDPrecipitation2→ START = 8 END = 9 LABELS = SN SN
Figure 4.10: Schema of the precipitation operator method with the current meteorological phenomena categories for precipitation and its associated labels.
Wind operator It follows a similar strategy to the precipitation operator, although in this case it does not convert the original values into labels. • Input: – Wind data series W = {w1 , . . . , wi , . . . , w12 }. – A numeric interval AW = [awa , awb ]|AW ⊂ [299, 332] (as indicated in Section IIIA), which specifies the relevant wind values to be extracted by the operator. In our application, AW = [317, 332]. This interval corresponds to strong and very strong winds, which are the only relevant wind conditions to be included in the descriptions according to the meteorologists. • Procedure. This operator extracts an ordered set of wind episodes W E = {we1 , . . . , wek , . . . , wem }, where each episode is characterized as wek = {STARTk , ENDk , SY MBOLSk }. The algorithm in Fig. 4.11 describes how the wind operator extracts the relevant episodes from W .
4.2. Application description
71
procedure W IND E PISODE E XTRACTOR(W, AW ) W E ← {} wek ← Ø while i < |W | do active period ← False if wi ∈ AW then if wek 6= Ø then wek .SY MBOLS ← wek .SY MBOLS ∪ wi else wek ← {START, END, LABELS} wek .START ← i wek .SY MBOLS ← {wi } W E ← W E ∪ wek end if active period ← True end if if ¬active period & wek 6= Ø then wek .END ← i − 1 wek ← Ø end if i ← i+1 end while if active period & wek 6= Ø then wek .END ← |W | end if return W E end procedure Figure 4.11: Wind episode extractor algorithm.
• Output. A wind linguistic description for each wind episode we j as an intermediate code characterized by the following concatenation: LDWindk → STARTk ENDk SY MBOLSk . For example, if there is a period of strong wind within W , a linguistic description such as “START=2 END=4 LABELS=322,322,322” could be obtained, meaning “from tonight (i = 2) until tomorrow afternoon (i = 4) there will be strong wind from the southwest (wi = 322)”. Temperature operator This operator generates a linguistic description which reflects the temperature trend for the 4day period and also obtains information about the climatic behavior of the forecasted temperatures. Thus, four variables are considered: maximum and minimum temperature variations
72
Chapter 4. GALiWeather: A textual weather forecast generation system
and maximum and minimum climatic behavior. • Input: – Maximum temperature data series T MAX = {tmax1 ,tmax2 ,tmax3 ,tmax4 }. – Minimum temperature data series T MIN = {tmin1 ,tmin2 ,tmin3 ,tmin4 }. – A temperature variation linguistic variable, defined as TV = {tv1 , . . . ,tv j , . . . ,tvn }, where each linguistic term tv j ∈ TV has an associated crisp membership function µtv j : R → {0, 1}. In our application, TV = {ED, ND, MD, SD,WC, SI, MI, NI, EI} (“extreme decrease”, “notable decrease”, “moderate decrease”, “slight decrease”, “without changes”, “slight increase”, ..., “extreme increase”). – A temperature climatic behavior linguistic variable, defined as TC = {tc1 , . . . ,tc j , . . . ,tcn }, where each linguistic term tc j ∈ TC has an associated crisp membership function µtc j : R → {0, 1}. In our case, TC = {V L, L, N, H,V H} (“very low”, “low”, “normal”, “high”, “very high”). • Procedure. This operator provides the linguistic terms with the highest membership degree from TV and TC for the four temperature variables considered: – Temperature variation: for maxima T MAXV = tv j |µtv j (tmax|T MAX| −tmax1 ) = 1, and minima T MINV = tv j |µtv j (tmin|T MIN| − tmin1 ) = 1. |T MAX|
– Temperature climatic behavior: for maxima T MAXC = tc j |µtc j ( ∑
i=1
|T MIN|
1, and minima T MINC = tc j |µtc j ( ∑
i=1
tmaxi |T MAX| ) =
tmini |T MIN| ) = 1.
• Output. A temperature linguistic description as an intermediate code characterized by the following term concatenation: LDTemperature → T MINC T MAXC T MINV T MAXV The definition of TV and a graphical example of the temperature operator are shown in Figure 4.12. As for TC, its associated crisp membership functions µtc j are not shown in this example, since they vary for each municipality.
4.2. Application description
73
Current day
Tomorrow
2 days after
3 days after
7º
8º
9º
10º
15º
16º
14º
15º
TMIN = TMAX =
TC = {VL,L,N,H,VH} SD SI
1
Temperature operator
0.8
TV =
0.6
ED
ND
MD WC MI
NI
EI
0.4
LDTemperature→ TMINV = MI
0.2 0 -20
-10
0
10
Temperature variation (ºC)
TMAXV = WC TMINC = N TMAXC = N
Figure 4.12: Schema of the temperature operator, with the current definition of the temperature variation partition and its associated labels.
4.2.3
Second stage: Natural language generation
The natural language generation (NLG) stage of this application consists of a domain-specific module which has also been divided into different modules for each variable, so that changes in one of them do not affect the rest of the system. From a global perspective, each of these modules receives the intermediate linguistic description generated by their corresponding operator, parses it and generates the final textual forecast for its associated variable. Delving deeper into the natural language generation stage structure, the complexity of the target natural language descriptions is a factor which has determined the design and implementation approach which was followed. This includes evaluation criteria applicable to linguistic descriptions [43] such as the description length, but also NLG systems design methodologies as in [101] and [100]. Thus, since the quantity of information in the descriptions is variable and the diversity of situations for each variable to be included ranges from simple to more complex, two different NLG solutions were adopted. On one hand, templates were defined in structured text files which contain generic natural language sentences for the simpler variables (cloud coverage, temperatures and wind). On the other hand, the generation of natural language sentences for precipitation were designed and implemented through the application of concepts inspired by standard NLG methodologies [101], [100].
74
Chapter 4. GALiWeather: A textual weather forecast generation system
Template-based NLG approach This approach was devised as a solution for variables whose corresponding natural language sentences have rather static structure and length, such as temperatures or cloud coverage. For example, a textual forecast for temperatures usually includes information about variation of maxima and minima and their climate behavior, and the only elements that differ from one forecast to another are the labels assigned to the variations and the behavior, whereas the syntactic structure and length of the forecasts remain the same.
a) Temperature template sample
b) Cloud coverage, precipitation and temperature variation label sets
Figure 4.13: Temperature template sample and label sets from the English language template document.
In this context, structured text files, such as XML, allow to model and build templates of natural language sentences, where static text can be mixed with other elements, such as variables or optional texts within a sentence. This flexibility was utilized to design templates for temperature and cloud coverage variables. These templates are included in a document which also contains natural language label sets for variables, time expressions or other kind of language-dependent text resources. Figure 4.13 shows parts of a template document (in this case for English language), whose structure (Fig. 4.14) is comprised of the following elements:
4.2. Application description
75
• Variable templates, which include the generic natural language forecast structures for several variables, such as cloud coverage or temperature. • Label sets, which contain the natural language vocabulary and expressions used to fill in the variable elements. These are the natural language equivalents to the crisp and fuzzy partition sets used in the linguistic description extraction stage. For example, in Fig. 4.12 the temperature variation labels in TV correspond to the label identifiers in the temperature variation label set in Fig. 4.13.
one template per forecast variable (temperature, wind, cloud coverage)
has 1 or more
comprised of 1 or more
comprised of several
comprised of several
several label sets for variable labels, time labels and natural language expressions
comprised of 1 or more
name
content contains
identifies the label with its corresponding linguistic label defined in the partition sets contains the natural language expression
Figure 4.14: Schema of the structure of a NLG template file, which contains generic sentences and label sets.
The template documents for the supported languages are loaded into structured objects within the application. Once the intermediate codes for the NLG template-based variables have been obtained, each NLG module (one per meteorological variable) parses its corresponding code and executes expert rules incorporated into the implementation code, so that according to certain detectable events in the intermediate language, different cases and options
76
Chapter 4. GALiWeather: A textual weather forecast generation system
can be selected. Then, the template variables are filled with the natural language labels which correspond to the linguistic labels found in the intermediate code. Finally, the NLG template structures are translated into a natural language forecast text through the concatenation of the text values of each of their elements. Precipitation and wind NLG approach The previous NLG approach is not suitable for variables such as precipitation or wind, where several episodes can occur within a forecast term. This can lead to the generation of several natural language sentences which, although may reflect faithfully the meteorological data, are repetitive and tedious to read. Since the purpose of building linguistic descriptions in natural language is to provide users with textual information which should be easy to read and to understand, a different NLG approach was followed in order to achieve this goal. Based on the concepts of a NLG system architecture described in [101] and [100], NLG modules for precipitation and wind which address redundancy or length excess in the obtained descriptions were developed. For avoiding repetition in this explanation only the precipitation approach will be described, as the wind NLG approach is actually a simplified version of the precipitation NLG solution. In [100], an NLG system is depicted as a six stage process, where one subtask is performed per stage. However, some of these subtasks may be merged or might not even be necessary, depending on the NLG requirements. Consequently, some of these subtasks were adapted for the precipitation NLG module: content determination, sentence aggregation, lexicalization and linguistic realization. Others such as document planning were not considered, since in the case of GALiWeather the NLG complexity stands at a sentence level. This process is summarized in Figure 4.15. Content determination is defined in [100] as the process which decides what information should be communicated in the text. This is done by creating a set of data objects (messages) which contain the filtered and summarized data. In GALiWeather, this task is actually mostly performed in the linguistic description stage by the precipitation operator, which extracts the relevant data from the raw data and converts it into an intermediate language. The remaining task is to convert the intermediate code into data objects, which is done by the precipitation NLG module parser. As a result, a list of precipitation episodes, whose structure is shown in Fig. 4.16, is created and used by the subsequent natural language generation subtasks. The precipitation data object structure in Fig. 4.16 shows that a precipitation episode has
4.2. Application description
77 Precipitation Intermediate Code
Content determination
0-2 P P SN
Precipitation Parser
Precipitation Episode
Sentence aggregation, lexicalization and linguistic realization
4-7 P ST ST P 11 P
Precipitation Episode
Precipitation Episode
Precipitation Episode NLG Generator
Precipitation Day NLG Generator
Precipitation Term NLG Generator
Candidate sentence
Candidate sentence
Candidate sentence
Sentence selection
Final NLG Precipitation Output
Figure 4.15: Schema of the NLG approach for the precipitation variable.
a duration (which can range from a single instant to the whole term). Furthermore, it might have associated nuances, which are subintervals within the episode in which the precipitation can be of different nature than rain (of snow, of hail or stormy). Lexicalization, aggregation and linguistic realization are performed almost concurrently. Lexicalization, which is the process of deciding which specific words and phrases should be chosen to express the concepts and relations in the messages, is made for precipitation by choosing adequate label sets and canned text expressions defined in the NLG templates described in the previous approach. However, unlike the template-based approach, which realizes the output texts directly, the expressions for precipitation are processed differently by aggregating them in different ways. Aggregation consists in grouping messages into sentences. Although this task is usually depicted from a structural perspective in NLG (e.g. if two sentences share the same subject but have different predicates, can be merged using a simple conjuction), in the case here presented
78
Chapter 4. GALiWeather: A textual weather forecast generation system
it is treated as content-related problem. Particularly, three different ways of aggregating the precipitation episodes are considered: by episodes, by days and by a whole-term aggregation. Consequently, three different submodules were created. Each one, independently of each other, performs lexicalization, aggregation and realization at once. lasts one
Precipitation Period
Precipitation Episode
might have one or more
Precipitation Nuance
Precipitation Period lasts one
Figure 4.16: Precipitation data object structure for the NLG stage.
As mentioned above, linguistic realization, which is the task of producing a correct text (syntactically, morphologically and ortographically), is performed concurrently with the other tasks, during the composition of the canned expressions and words, which already takes into account possible syntactical and ortographical issues. Three candidate natural language precipitation sentences are realized (one per aggregation module). These describe the same input meteorological data set, but only one is chosen in the end (Fig. 4.15). The final output sentence for precipitation is the shortest of the three candidates, as it is desirable that the obtained natural language forecasts remains as concise and brief as possible [43].
4.2.4
Implementation details
This application was developed in the cross-platform coding language Python, with the use of libraries for mathematical and fuzzy calculations (numpy, pyfuzzy) and text pattern recognition by grammars (pyparsing). The current implementation supports both Linux and Windows systems. The initially supported languages include Spanish and Galician. English was also included for research and scientific exposure purposes.
4.3
Evaluation and results
The evaluation process for GALiWeather consists in an exhaustive expert-based revision and quality assessment of a set of automatically generated text forecasts obtained by the application. For this, the state of the art in evaluation methodologies will be briefly discussed for
4.3. Evaluation and results
79
both NLG and LDD fields and, based on these approaches, the followed evaluation methodology and its associated results will be described. For illustration purposes, three examples of linguistic descriptions from the evaluation set obtained with the application are presented beforehand.
4.3.1
Examples of automatic weather forecasts 9th December, Monday Morn.
Aft.
Night
Min: 1º Max: 14º
10th December, Tuesday Morn.
Aft.
Night
Min: 5º Max: 16º
11th December, Wednesday Morn.
Aft.
Night
Min: 7º Max: 16º
12th December, Thursday Morn.
Aft.
Night
Min: 11º Max: 15º
There will be clear skies at the beginning and towards the middle of the term, although at the end they will be very cloudy. We expect precipitations on Thursday morning. The temperatures will be normal for the minimums and high for the maximums for this period of the year, with minimums in notable increase and maximums without changes.
Figure 4.17: Linguistic description forecast obtained with the application using real forecast data for Pontevedra, 9th of December, 2013.
Although the short-term prediction data series are limited to 32 values, the number of phenomena which must be considered and its temporal variability ensures a high richness in the obtained linguistic descriptions. As a proof of this richness, the following examples covering several meteorological situations are presented. The example shown in Fig. 4.17 includes real forecast data for the town of Pontevedra, issued the 9th of December by MeteoGalicia. This case shows how GALiWeather performs in common meteorological situations, where the weather changes progressively. The examples shown in Fig. 4.18 and Fig. 4.19 present unusual and odd meteorological conditions, which were generated using synthetic data forecasts. These cases were created to test the application robustness under uncommon situations. Both examples include several meteorological phenomena, such as snow, storm, strong winds and temperature variations. Furthermore, each example shows a different precipitation sentence which aggregates the precipitation periods in a different way, as described in Section 4.2.3.
80
Chapter 4. GALiWeather: A textual weather forecast generation system 1st December, Sunday Morn.
Aft.
Night
Min: 5º Max: 8º
2nd December, Monday Morn.
Aft.
Night
Min: 5º Max: 11º
3rd December, Tuesday Morn.
Aft.
Night
Min: 4º Max: 12º
4th December, Wednesday Morn.
Aft.
Night
Min: 3º Max: 12º
The sky state will be very variable during the whole term. We expect precipitations everyday, which can be stormy on Sunday afternoon, of snow on Monday afternoon and stormy on Wednesday afternoon. The temperatures will be normal for this period of the year, with minimums in slight decrease and maximums in moderate increase.
Figure 4.18: Linguistic description forecast obtained with the application using synthetic data.
1st December, Sunday Morn.
Aft.
Night
Min: 10º Max: 14º
2nd December, Monday Morn.
Aft.
Night
Min: 11º Max: 15º
3rd December, Tuesday Morn.
Aft.
Night
Min: 12º Max: 16º
4th December, Wednesday Morn.
Aft.
Night
Min: 13º Max: 17º
There will be an alternation of very cloudy sky periods with partially cloudy periods for the next days, although occasionally they will be clear. We expect precipitations on Monday afternoon (of snow), on Tuesday afternoon and on Wednesday. The temperatures will be very high for the minimums and high for the maximums for this period of the year and will be in moderate increase. We expect wind which will be strong from the West since Monday morning, changing to strong from the South on Tuesday morning.
Figure 4.19: Linguistic description forecast obtained with the application using synthetic data.
4.3.2
Validation methodology
Evaluation of automatic natural language generated texts is still an open challenge, even within the NLG field [99]. Several evaluation approaches do exist, both human and automatic, although in general, the human-based evaluation by experts is considered the most reliable [14], [105]. Consequently, the vast majority of NLG systems are evaluated using expert assessment, which usually implies answering questions about different aspects of the
4.3. Evaluation and results
81
output texts. In the case of the LDD field several criteria have been proposed for evaluating and measuring the quality of the linguistic descriptions objectively [43], but they are not applicable in every approach and the information they provide is very limited compared to that of an expert. MeteoGalicia’s meteorologists provided support for an expert-based evaluation of GALiWeather, which allowed to refine the system in a way that ensures it works under realistic conditions and cases. For this, the following evaluation process was performed: 1. Dataset collection creation. A collection of 45 forecast datasets was created by the meteorologists. This collection includes synthetic and real forecast data, which covers common as well as unusual meteorologic scenarios, similar to the ones presented in the examples in Section 4.3.1. 2. Natural language forecast automatic generation. From this collection of forecast datasets, 45 automatically generated natural language forecasts were obtained. 3. Polishing stage. These 45 natural language forecasts generated by our application were evaluated by a meteorologist who assessed their quality taking into account their most relevant aspects and dimensions of interest. This initial evaluation was made to obtain preliminary conclusions and polish GALiWeather in those aspects which needed to be improved. 4. Natural language forecast automatic generation. Once the changes to GALiWeather were implemented, new 45 automatically generated language forecasts were obtained from the original collection of forecast datasets. 5. Evaluation stage. The expert assessed the new 45 automatically generated natural language forecasts. As opposed to the results from the polishing stage, which served to identify certain issues and potential improvements, the results of this stage allowed to discern if the improvements in our approach were effective and, more importantly, if GALiWeather met the expert’s requirements and was consequently prepared to be released as a public service. In order to assess the quality of the automatically generated forecasts, the expert meteorologist was provided with a questionnaire which follows the approach presented in [45]. This questionnaire covers three key dimensions about the generated weather forecasts, as shown in Fig. 4.20:
82
Chapter 4. GALiWeather: A textual weather forecast generation system Layer 4 Quality of a linguistic description
Layer 3 What the text says
What the text implicates
Layer 2 Relevance
Truthfulness
Manner
Layer 1 Question 1
Question 2
Question 3 Question 4 Question 5
Figure 4.20: Schema of the validation composition.
• Relevance: Does the forecast include all the kind of information the expert would include? • Truthfulness: Does the included information in the forecast reflect the numeric-symbolic forecast correctly? • Manner: Does the forecast express the information properly? Is it well formatted? These three dimensions are directly classified into two higher level categories, ”what the text implicates” and ”what the text says”, which altogether determine the quality of the generated forecast. More specifically, the proposed questionnaire consists of five questions which deal in more depth with the previous three dimensions: • Question 1: “Indicate in which degree you identify the type of results expressed as the type of results expressed by yourself: a) For sky coverage b) For precipitations c) For wind d) For temperatures”.
4.3. Evaluation and results
83
This question determines the grade in which an expert identifies the generated forecast with the ones he creates. For reasons of precision, and in order to identify more specific issues in each forecast variable, Question 1 was divided into four subquestions, one for each forecast variable. • Question 2: “Do you agree with the provided descriptions? a) For sky coverage b) For precipitations c) For wind d) For temperatures”. This question considers the degree of truthfulness of the generated description, this is, the degree in which the content of the forecast reflects faithfully the information within the numeric-symbolic forecast data. Similar to Question 1, Question 2 is divided into four subquestions. With the ratings of Questions 1 and 2, the partial rating of the forecast related to “what the text implicates” is obtained. • Question 3: “Indicate in which degree the vocabulary is used correctly”. This question evaluates if the vocabulary from the meteorology domain is used properly. • Question 4: “Indicate in which degree the content is correctly grouped to facilitate the comprehension of the description”. This question evaluates if the information in the natural language description is properly grouped and not repetitive. • Question 5: “Indicate in which degree the format of the report, including the punctuation, is the most adequate”. Question 5 considers aspects related to the forecast text presentation, such as punctuation. With the ratings of Questions 3, 4 and 5 the partial rating “what the text says” is obtained. Each of these questions must be answered as a number in a 1-5 scale (from 1 “very negative” to 5 “very positive”). Thus, in order to calculate the global score for the collection of automatically generated forecasts, the global aggregation schema defined in expression 4.2 was followed. Following this quality measure approach, the quality Q of an automatically generated natural language weather forecast Si is defined as the arithmetic mean of the two dimensions in Layer 3 (Fig. 4.20): QSi =
p1 +p2 2
+
p3 +p4 +p5 3
2
(4.2)
84
Chapter 4. GALiWeather: A textual weather forecast generation system The terms p1 and p2 correspond to the average score of the subquestions a, b, c and d for
Question 1 and Question 2, respectively. The remaining terms, p3 , p4 and p5 are the scores for Questions 3, 4 and 5. As 4.2 shows, the average of p1 and p2 (“what the text implicates”) and the average of p3 , p4 and p5 (“what the text says”) determine the quality of a forecast. Thus, the global quality score GQ for our collection of automatically generated natural language n Q Si n , i=1
forecasts is obtained as the average of the validation cases quality score: GQ = ∑
where
n = 45 in our case.
4.3.3
Results Table 4.1: Polishing stage questionnaire score
Questions
Average score
Standard deviation
Q. 1 (a-d) Q. 2 (a-d) Q. 3 Q. 4 Q. 5 GQ
(3.6 3.93 5 4) (4.04 4.44 5 4.86) 5 3.64 4.26 4.35
(0.45 0.75 0 0.57) (0.36 0.5 0 0.34) 0 0.77 0.49 0.22
One expert meteorologist answered the proposed questionnaire for the initial 45 automatically generated forecasts. Table 4.1 shows that, in general, the meteorologist’s assessment about the content of the forecasts was very positive for the initial test (with an average global score (GQ) of 4.35 out of 5 and a deviation of 0.22). In this sense, the expert identified the content and language of the generated forecasts with the ones he would provide in a high degree. However, some of the individual question scores implied that there was room for improvement. This was especially relevant on Question 4 and on some variables from Question 1 and Question 2. This was due to several repetitive sentences produced by the NLG stage in some of the variables (especially precipitation) and to some expressions which were not appropriate for some variables. Based on the results obtained for the polishing stage, we the NLG modules were improved to address the issues found in the initial approach and an evaluation test was performed by the meteorologist with new 45 automatically generated natural language forecasts. With an average score of 4.83 out of 5 and a deviation of 0.18 (as Table 4.2 shows), the quality increase is substantial. In particular, the results in Question 1 show that the expert fully identified the
4.4. GALiWeather as a real service
85
Table 4.2: Evaluation questionnaire score
Questions
Average score
Standard deviation
Q. 1 (a-d) Q. 2 (a-d) Q. 3 Q. 4 Q. 5 GQ
(5 5 5 5) (4.97 4.53 5 5) 5 4.64 4.53 4.83
(0 0 0 0) (0.14 0.5 0 0) 0 0.48 0.50 0.18
automatically generated forecasts as if they were produced manually by him. The fact that both content and language from the automatic forecasts are almost indistinguishable from those that an expert would produce are the most important among the several quality aspects which can be measured for an NLG approach. The remaining questions also show increased scores compared to the first assessment.
4.4
GALiWeather as a real service
In this chapter the GALiWeather system has been described. This application can be considered unique, in the sense of being the first data-to-text system in operation as a real service that makes use of fuzzy techniques to model and manage imprecise terms and expressions. In this regard, this system is the greatest contribution of this PhD to the current state of the art, and is one of the main practical experiences that inspired the model described in Chapter 3. Two different evaluation tasks were performed by an expert meteorologist in order to improve and validate the systems for its deployment, which was made in June 2014. From this date until May 2015, GALiWeather operated in a test server generating daily textual forecasts, which were revised and allowed the discovery of minor errors which were solved before GALiWeather’s entry into real operation in May 2015. Since May 2015, GALiWeather has produced more than 114610 textual weather forecasts without any incidence, improving the weather forecast service MeteoGalicia offers, while proving the feasibility and usefulness of integrating fuzzy techniques into D2T systems.
C HAPTER 5
SLAR: A DATA - TO - TEXT SERVICE FOR VERBALIZING A LEARNING ANALYTICS DASHBOARD
This chapter describes a D2T service which was developed for a learning analytics domain. The service, named SoftLearn Activity Reporter (SLAR), generates small reports about the activity of students in SoftLearn, an e-learning platform. Particularly, this chapter depicts the conception of the service, its architecture and its subsequent evaluation by an expert pedagogue, where 20 full reports generated from real data from an undergraduate course supported by the SoftLearn platform were assessed. Results show that the automatically generated reports are a valuable complementary tool for explaining teachers and students the information comprised in a learning analytics dashboard.
5.1
Complementing learning analytics with textual information
Learning analytics is a discipline focused on managing data about learners and their contexts (including collection, analysis or reporting tasks) [38]. In this sense, one of the most actively researched areas in this field [110] is the development of user interfaces which allow both teachers and learners to comprehend how students behave and perform in a course. In this context, learning analytics dashboards (LADs) [125] emerge as applications supporting different ways to display and interact with the data collected in a learning environment. Usually,
88
Chapter 5. SLAR: A data-to-text service for verbalizing a learning analytics dashboard
LADs are focused on specific learning contexts and thus include graphical tools designed for achieving a specific purpose such as detecting isolated learners [37], understanding collaboration process among learners in social environments [72] or visualizing the effort indicators of learners to evaluate their progress during a course [56]. A good review and evaluation of LADs is found in [126]. The main downside which affects most of the LADs is their total dependence on graphical visualizations which are in general hard to understand for most users. This is especially true when the amount of data to visualize is very high, e.g. interactions along time among students in collaborative and/or social environments. To overcome this problem and provide both teachers and learners with a better understanding of LADs, it is proposed, as it is being the case in other fields of application (e.g. meteorology [95], health [57], industry [135], etc.), the development of tools and techniques which automatically generate textual reports of the data shown in the graphical visualization tools. These textual reports are not considered as an alternative to the graphical visualization tools, but as a complementary tool that explains in plain natural language what the LADs shows graphically to teachers and learners. Currently, there are no D2T/LDD approaches which have been used systematically in the field of learning analytics as a tool to provide students and/or teachers with linguistic reports automatically generated from the data produced in the learning processes. The only exceptions (which are focused on learning activities, but unrelated to learning analytics) to this general rule are the generation of feedback reports for students based on several performance factors [53] and an approach for evaluating and describing a student’s score in a specific learning activity [106]. To overcome the lack of assessment tools that provide information in a more humanfriendly form, the SoftLearn Activity Reporter (SLAR) service is presented, which automatically generates textual reports of the learners’ activity that takes place in a virtual learning environment. This tool has been integrated as a service in SoftLearn [6, 124], a process mining-based platform that facilitates teachers the learners’ assessment. SLAR extracts the relevant information from the data collected by SoftLearn, creating intermediate descriptions through linguistic variables and temporal references, which are later translated into natural language texts. This D2T tool was using real data provided by 72 learners enrolled in the Educational Technology undergraduate course of the Degree in Pedagogy at the Faculty of Education of the Universidade de Santiago de Compostela. Furthermore, 20 of these reports have been evaluated by an expert pedagogue and actual teacher of the aforementioned lecture.
5.2. The SoftLearn platform
89 Portfolio item Blog inputs Pages Twits Comments Files Bookmarks
#Elements 1051 636 843 7182 787 132
Table 5.1: Size of 72 students’ portfolios during 6 months.
The rest of this chapter is structured as follows. Section 5.2 describes the SoftLearn platform, upon which SLAR was conceived; Section 5.3 depicts in a conscientious way the SLAR D2T approach, including a characterization of the service architecture, input data and the whole data-to-text process; Section 5.4 presents a number of illustrative examples generated by SLAR and describes the service evaluation process in a thorough way. Finally, Section 5.5 presents some reflections about SLAR and discusses the contributions of this development to the general objective of this PhD thesis.
5.2
The SoftLearn platform
SoftLearn [6, 124] is an assessment platform that operates as one of the learning analytics services of a big data-based architecture [90] specifically designed to capture, store and make available, in real time, the large amounts of data generated by the students of a course. In this architecture, SoftLearn allows teachers to assess the performance of the students, providing information about their learning process and behavior throughout the course, and facilitating the evaluation of the learning activities carried out by learners during the course. This architecture can face any type of content generated by the students in a virtual learning environment, but in the presented case of study, SoftLearn distinguishes six different types of learning activities: blog inputs, pages, bookmarks, comments, files and twits (a Twitter-like tool). These elements, which set up the students’ portfolio, are evaluated during the learning process (midway through the course) and at the end. In this scenario, to perform a qualitative assessment requires the evaluation of hundreds of inputs to know if the student has achieved the expected competencies. For instance, Table 5.2 shows the number of elements generated by 72 students during the entire development of the Educational Technology course. As shown, the volume of content generated by the learners throughout a course can be un-
90
Chapter 5. SLAR: A data-to-text service for verbalizing a learning analytics dashboard
manageable; thus, the aim of SoftLearn is to provide a quick view of the students’ assessment as well as the progress of each student during the course, in order to improve the efficiency of the evaluation process, saving time and providing valuable information, sometimes difficult or impossible to find, to the teacher. To accomplish this, the graphical user interface is divided in three sections: i) the workflow analytics view, where the learning paths are displayed; ii) the dashboard section, which provides different statistics about the students; and iii) the content of the course, where all the data generated during the course is sorted in a table in order to provide an easy access to specific learning activities1 .
5.2.1
Workflow Analytics
In this section, when the teacher selects a temporal period, such as a week, a month or the entire course, the learning path describing the behavior for a particular learner is presented. SoftLearn also incorporates a process player that allows the teacher to exactly reproduce the behavior of each student through the learning process. This view also provides access to all the learning content generated by the students, allowing to review and grade the portfolio elements based on the academic grading specified by the teacher.
5.2.2
Dashboard
SoftLearn also provides a dashboard where the teacher can access to different statistics regarding the learning process of the students. Within this panel, SoftLearn allows to select the different portfolio elements for the statistics, e.g. only the blog inputs, or the blog inputs along with the pages. Therefore, based on the teacher criteria, the dashboard presents the following information: the student’s score; and the number of learning activities carried out by the learners as well as i) how many of them have been graded, ii) how many of them remain to be scored iii) and the average value of each portfolio item. With these statistics, the teacher can have a quick view of the current status of the students, as well as a record of the learning activities that are graded. In addition to this information, the dashboard also implements a set of charts and graphs to provide a better view of the progression of each student, such as the students’ activity during the course. All these plots were specially designed to provide a better view of the progress 1A
fully functional demo of SoftLearn can be found in [6].
5.3. SLAR: D2T in SoftLearn
91
Figure 5.1: Global view of SoftLearn’s dashboard for when a given student is selected.
of the students, in order to facilitate the evaluation process by i) including more information about how the student evolved during the course and by ii) providing an easy access to this information (see Figure 5.1).
5.3
SLAR: D2T in SoftLearn
Taking as starting point the aforementioned graphical user interface, the functionality of the dashboard in SoftLearn was extended and enhanced with the inclusion of the SoftLearn Activity Reporter (SLAR) service, which provides on-demand automatically generated natural language reports produced from student activity data in each portfolio element. SLAR is based on data-to-text (D2T) techniques. In particular, it follows a similar approach as GALiWeather, described in Chapter 4. It must be noted that SLAR’s specifications were provided by SoftLearn’s developers and not by an expert end-user (pedagogues in this case). Although expert knowledge is essential in the conception of D2T systems, expert unavailability is rather common and SLAR was no exception in this regard. Thus, for SLAR, expert knowledge was provided by experts on the SoftLearn platform, which was developed in collaboration with expert pedagogues. However, since an expert pedagogue was available for the evaluation of SLAR, this issue will be referred
92
Chapter 5. SLAR: A data-to-text service for verbalizing a learning analytics dashboard
to again in Section 5.4.3.
5.3.1
Service architecture
SLAR automatically converts student activity data into textual reports through a two-staged pipeline process based on a simplification of Reiter’s D2T architecture [98] (see Figure 5.2). Starting from a set of activity time series data and impact data for a given student, SLAR extracts the relevant information contained in the source data according to the assessment provided by the knowledge base. This information serves as input to the second stage, in which the final textual reports are generated through the use of natural language templates. The resulting textual reports provide information about the involvement of a given student in each different activity of the learning platform, as well as the impact of the student’s participation in other learners. CONTENT DETERMINATION D2T PIPELINE
ACTIVITY AND IMPACT DATA
SIGNAL ANALYSIS
TEXT GENERATION
DATA INTERPRETATION
INFORMATION EXTRACTION OPERATORS
KNOWLEDGE BASE
DOCUMENT PLANNING
RELEVANT INFORMATION
MICROPLANNING AND REALIZATION
TEXT GENERATION MODULES
STUDENT ACTIVITY REPORT
REPORT TEMPLATES
Figure 5.2: General architecture of SLAR.
5.3.2
Input data characterization
As mentioned above, SoftLearn distinguishes several portfolio elements. These include blogs, files, twits, comments, bookmarks and pages. For each of them, the activity level of every student in a given course is tracked on a daily basis. As a consequence, a teacher can visualize the involvement of a student during the course period through the dashboard in SoftLearn (as it was shown in Figure 5.1). SoftLearn’s database covers all students for the whole course and includes data about additional information which is also relevant to the teacher (e.g. number of comments and “likes”
5.3. SLAR: D2T in SoftLearn
93
each student receives for every activity in a course). Formally, each course C has an associated student dataset, C = {S1 , S2 , ..., SI , ..., SN }. For the sake of clarity, a single student dataset S will be considered in what follows, which includes data series for every portfolio element Ds and general impact data S = {Dblogs , Dcomms , D f iles , D pages , Dtwits , Dbkms , IMP}. Every D element is a time series dataset which contains the number of times the student participated in that given element portfolio per course day D = {a1 , a2 , ..., ai , ..., at |∀ai ∈ D, ai ∈ N}. The IMP element contains data about the number of likes and comments the student received (on a global basis) IMP = {likes, comms|likes, comms ∈ N}. Figure 5.3 shows how the input data for SLAR is structured. COURSE C STUDENT 1 S1 STUDENT 2 S2
STUDENT DATA D
IMPACT IMP
BLOGS Dblogs
1
0
2
FILES Dfiles
0
0
1
PAGES Dpages
0
0
0
COMMENTS Dcomms
1
2
2
3
1
1
TWITS Dtwits STUDENT N SN
31
20
likes
BOOKMARKS Dbkms
comms
0
2
1
a1
a2
at
Figure 5.3: Input data structure.
For each element portfolio data series D for a given student S, SLAR obtains similar reports that include information about several aspects of the student’s activity. These include an assessment of the activity level, the student’s regularity and frequency, etc. Additionally, SLAR also provides comments about the student’s global impact by assessing the IMP data.
5.3.3
Content determination stage
The first task SLAR performs consists in determining the content of the textual report it is generating, this is, extracting relevant information from the source data. In this sense, six operators were defined to focus on different aspects of a student’s data. For every portfolio element five of them obtain information based on activity data and the sixth assesses the global impact data. The obtained information is a set of linguistic labels and relevant data which is used in the textual generation stage of SLAR. SLAR adapts the modules and operators of GALiWeather, making use of crisp definitions for the linguistic concepts identified in the
94
Chapter 5. SLAR: A data-to-text service for verbalizing a learning analytics dashboard
domain knowledge specifications. This means that situations where more than one linguistic expression can be selected as output, as it happens in fuzzy LDD approaches, do not occur in SLAR. The operators implemented in SLAR are defined as follows.
Participation Provides information about the absolute participation of the student, i.e., counts the total participation of the student for the whole course and determines a corresponding linguistic label. In this sense, a linguistic label set was defined to categorize the different possible assessments of the student’s participation. The label sets were defined differently for each portfolio element (e.g., the definition of NORMAL participation in “Twits” is different from its definition in “Files”, since to participate in the latter usually requires more effort from the learner). From a formal point of view, this operator is characterized by three elements: • Input data. A data series for a given portfolio element D = {a1 , a2 , ..., ai , ..., at }. • Label set definition. A set of linguistic terms defined as numeric intervals, used to assess the participation of the student P = {µvery low , µlow , µnormal , µhigh , µvery high }. • Procedure. This operator calculates the total amount of participation and provides the fittest linguistic label from P: t
Participation = µ ∈ P|µ( ∑ ai ) = 1
(5.1)
i=1
Regularity Provides information about how regular a student was in his/her activity, i.e. how much the student’s inactivity period lengths deviate from the whole course average inactivity length. • Input data. A data series for a given portfolio element D = {a1 , a2 , ..., ai , ..., at }. • Label set definition. A set of linguistic terms defined as numeric intervals, used to assess the regularity of the student R = {µstrictly regular , µregular , µhardly regular , µirregular , µvery irregular }.
5.3. SLAR: D2T in SoftLearn
95
• Procedure. This operator assesses the regularity of the student in several steps and provides the fittest linguistic label from R:
AD = {i|ai > 0, ∀ai ∈ D} IL = {ad j − ad j+1 , ∀ j ∈ [1, |AD| − 1]} DEV = std(IL)/(ad|AD| − ad1 + 1)
(5.2)
Regularity = µ ∈ R|µ(DEV ) = 1 In short, this operator calculates a list of the data indices (AD) where activity was registered (ai > 0). Then, a list containing the inactivity period lengths (IL) is calculated by subtracting the contiguous indices in ad on a pairwise basis. The standard deviation is obtained on a normalized inactivity period length list (DEV ), where the inactivity lengths are divided by the length of the whole activity period of the student. Finally, as in the previous operator, the fittest linguistic label is selected based on the definitions from the knowledge base. Frequency Provides information about how frequent a student is in his/her activity, i.e. the less time between tracked activity the more frequent the student is. This operator is similar to the Regularity operator, but instead of focusing on how the inactivity periods deviate, it measures the average inactivity periods. • Input data. A data series for a given portfolio element D = {a1 , a2 , ..., ai , ..., at }. • Label set definition. A set of linguistic terms defined as numeric intervals, used to assess the frequency of the student F = {µvery low , µlow , µnormal , µhigh , µvery high }. • Procedure. This operator assesses the frequency of the student in several steps and provides the fittest linguistic label from F:
AD = {i|ai > 0, ∀ai ∈ D} IL = {ad j − ad j+1 , ∀ j ∈ [1, |AD| − 1]} AV GFREQ = IL/(ad|AD| − ad1 + 1) Frequency = µ ∈ F|µ(AV GFREQ) = 1
(5.3)
96
Chapter 5. SLAR: A data-to-text service for verbalizing a learning analytics dashboard
Activity time scope Provides linguistic information about how the activity of the student spans across the whole course by describing when the student starts participating and when the activity ends. • Input data. A data series for a given portfolio element D = {a1 , a2 , ..., ai , ..., at }. • Label set definition. A set of linguistic terms defined as numeric intervals on day indices that represent the different time periods of the course T = {µbeginning , µmiddle , µend }. • Procedure. This operator assesses the activity time scope of the student by providing two labels from T . These define the beginning and the end of the participation linguistically:
AD = {i|ai > 0, ∀ai ∈ D} T Sbeg = µ ∈ T |µ(ad0 ) = 1 T Send = µ ∈ T |µ(ad|AD| ) = 1
(5.4)
TimeScope = {T Sbeg , T Send } This operator obtains the first and last values from the activity indices list (ad) and checks which temporal labels from T correspond to each value. Inactivity This operator uses the inactivity day lengths to provide numeric information about the lengthiest inactivity period. • Input data. A data series for a given portfolio element D = {a1 , a2 , ..., ai , ..., at }. • Procedure. This operator assesses the inactivity time scope of the student by providing the length of the longest inactivity period:
AD = {i|ai > 0, ∀ai ∈ D} IL = {ad j − ad j+1 , ∀ j ∈ [1, |AD| − 1]} Inactivity = max(IL)
(5.5)
5.3. SLAR: D2T in SoftLearn
97
Impact This operator uses data about the number of “likes” and comments received from other students and determines linguistically the impact of a given student. • Input data. Impact data for a given student IMP = {likes, comms}. • Label set definition. A set of linguistic terms defined as numeric intervals which assess the different impact categories I = {µvery low , µlow , µnormal , µhigh , µvery high }. • Procedure. This operator evaluates the labels in I against the sum of likes and comms:
LingImp = µ ∈ I|µ(likes + comms) = 1 Impact = {LingImp, likes, comms}
(5.6)
The information provided by this operator includes both input data values likes and comms, as they are also used in the text generation process.
5.3.4
Text generation stage
The textual generation stage of SLAR consists of a module which receives the information provided by their associated information operators described in Section 5.3.3 and generates the textual reports. The textual reports generated from student activity data have a simple fixed structure with optional elements. From a natural language generation perspective, this means that the use of templates is appropriate for this case. In fact, standard XML templates were used in the same fashion as other similar approaches such as GALiWeather. These include both natural language expressions and vocabulary which corresponds to the linguistic labels defined for the content determination operators (see Fig. 5.4 for an example fragment of a SLAR template). The text generation module employs the information provided by the operators to distinguish different situations and choose the most appropriate template for a given case. This means that in some cases not all the information elements provided by the operators are used. Particularly, three different main scenarios are considered: 1. The student does not participate at all.
high very high a very regular a regular a hardly regular
98
an irregular a very irregular very low low normal high very high concentrates towards the beginning of the course ranges from the beginning until halfway course covers the whole course is concentrated exclusively towards the middle of the course began in the middle of the course, lasting until the course Figure 5.4: Fragment of a template used in the text generation stage of SLAR. end occurs exclusively towards the end of the course
2. The student participates, but the registered activity is so low that elements such as the frequency or the regularity are discarded from the textual description. 3. The student participates in such a way that the information from all operators can be potentially included in the textual description. In this third case an additional subscenario is considered. Specifically, temporal inactivity information is only included in the generated reports when the regularity and the frequency of activity are low. In total, for a given student 7 textual descriptions are generated: 6 of them correspond to a portfolio element (thus the operators are applied 6 times each) and the last one includes the information provided by the global impact operator. These descriptions are included in SoftLearn’s dashboard as a means to improve and complement the understanding of the graphical data plots and are generated on-demand.
5.4
Report Examples and Evaluation of SLAR
The SLAR service was applied on real anonymized data extracted from 72 students enrolled during the first semester 2015 in the Educational Technology undergraduate course of the Degree in Pedagogy at the Faculty of Education of the Universidade de Santiago de Compostela. This course was developed in a blended learning mode with virtual activities, where students undertook learning activities encompassed in the aforementioned portfolio list.
5.4. Report Examples and Evaluation of SLAR
5.4.1
99
Report examples
Tomasa Auvil's involvement in Blogs has been high. In this context, the student's participation lasts the whole course. It can also be stated that the student was regular and participated with normal frequency.
Annett Albert's involvement context, the student's parti also be stated that the stu high frequency.
Figure 5.5: Automatic report example obtained from real data for an active student in the Blogs category.
Although the reports SLAR generates have a simple structure, the variety of student profiles allows for a wide diversity of textual descriptions about their activity in the different categories of the portfolio list. As proof of this richness, the following descriptions about the learners’ activity cover very different profiles and provide distinct information. For instance, Figure 5.5 shows an example of a student highly involved in the activity of publishing blog posts during the whole course. The student has followed a regular activity pattern (most days of activity are separated by inactivity periods of the similar length). It must be noted that although the visualization plot does not show many data points, the participation
Corkery's participation in Twits has more been low. In this of the student inEverette the Blogs portfolio element requires effort thansense, othertheactivities. Thea Thus, Szczepanski's participa student's activity covers the whole course in an irregular way with a low sense, the student's activity frequency, including inactivity periods of up to 40 days. its evaluation will be more positive than in other portfolio elements which had registered course. the
same amount of activity. In Figure 5.6 the textual description of the participation of a student in the Twits activity reflects a low involvement, including periods of inactivity of up to 40 days. This portfolio element requires more activity than the one shown in Figure 5.5 to get a positive evaluation.
Tomasa Auvil's involvement in Blogs has been high. In this context, the student's participation lasts the whole course. It can also be stated that the student was regular and participated with normal frequency.
Annett Albert's involvement context, the student's parti also be stated that the stu dashboard high frequency.
Everette Corkery's participation in Twits has been low. In this sense, the student's activity covers the whole course in an irregular way with a low frequency, including inactivity periods of up to 40 days.
Thea Szczepanski's participa sense, the student's activity course.
100 Chapter 5. SLAR: A data-to-text service for verbalizing a learning analytics
Figure 5.6: Automatic report example obtained from real data for a learner with low activity.
Another interesting example is given in Figure 5.7, where the data shown in the plot might imply that the student’s involvement in the Files activity is low. This is not the case, however, as for this portfolio element it is considered normal to participate just a few times. The text also reflects that, for this particular student, the participation ended towards the middle of the course period. Although these examples show how the textual reports generated by SLAR can be a coherent way of providing objective information that can complement visual dashboards and help teachers to understand in a comprehensible manner the behavior of their students, the standard methodology of D2T systems (and NLG systems, in general) was followed, and a proper evaluation of the service was performed.
5.4.2
Evaluation design
In order to evaluate the appropriateness of the system, an intrinsic evaluation of SLAR was undertaken. Intrinsic evaluations of D2T systems are usually performed by domain experts and focus on the quality of the automatically generated texts regarding their content and style [61]. For SLAR, an evaluation of the system was performed by an expert pedagogue on a subset comprised of 20 reports. These were assessed through a questionnaire.
n high. In this context, the It can also be stated that ormal frequency.
5.4. Report
een low. In this sense, the an irregular way with a low 40 days.
Annett Albert's involvement in Comments has been very high. In this context, the student's participation lasts the whole course. It can also be stated that the student was regular and participated with Examples and Evaluation of SLAR high frequency.
101
Thea Szczepanski's participation in Files has been normal. In this sense, the student's activity ranges from the beginning until halfway course.
Figure 5.7: Automatic report example obtained from real data for a learner with a normal behavior.
Each evaluation case included information about the activity of a single student in all of the portfolio elements. For each portfolio element a visualization plot of the student’s activity and its associated textual description are included. Additionally, each case includes a description of the impact of the student’s activity in others. Figure 5.8 shows one of the report cases used in the evaluation process. The questionnaire follows a similar approach to those used in the approaches by Eciolaza et al. [45] and Ramos-Soto et al. [95, 93]. The questions have been adapted to this specific domain and are focused mainly on the quality of the content reflected in the textual descriptions. The kind of score the expert could assign to each question and subquestion follows a Likert scale, where numbers from 1 (“very negative”) to 5 (“very positive”) were admitted. Three questions were formulated: 1. “Indicate in which degree you think the content of this description belongs to the Pedagogy application domain”. This question determines the degree in which an expert believes the kind of content included in the texts fits his/her expertise domain from a general perspective.
102 Chapter 5. SLAR: A data-to-text service for verbalizing a learning analytics dashboard Annett Albert
Annett Albert's participation in Blogs has been normal. In this sense, the student's activity covers the whole course in a hardly regular way with a normal frequency.
Annett Albert's involvement in Comments has been very high. In this context, the student's participation lasts the whole course. It can also be stated that the student was regular and participated with high frequency.
Annett Albert's participation in Files has been normal. In this sense, the student's activity covers the whole course.
Annett Albert's involvement in Bookmarks has been normal. In this context, the student's participation lasts the whole course.
Annett Albert's participation in Twits has been low. In this sense, the student's activity covers the whole course in a hardly regular way with a normal frequency.
Annett Albert has not performed any activity in Pages.
Another interesting aspect concerns the relevance of Annett Albert's activity on other students, which is low, since the student received 14 likes and 3 comments.
Figure 5.8: Sample report case used in the evaluation of SLAR.
2. “Indicate in which degree you identify the type of results expressed as the type of results expressed by yourself”. This question determines the degree in which an expert identifies the generated reports with the ones they would produce. 3. “Do you agree with the provided descriptions? For a) Blogs, b) Comments, c) Files, d) Twits, e) Pages, f) Bookmarks, g) Impact”. This seven-item question considers the degree of truthfulness of the generated texts, this is, the degree in which the content of the reports reflects faithfully the visual information provided by the data plots. In order to obtain more specific results, the question was divided into seven sub-questions, one per each portfolio element (six), plus the impact dimension. The 20 report cases selected for the evaluation process are representative of the whole course and include diverse casuistry (see examples in Section 5.4.1, where the behavior of the students across every portfolio element varies from a disinterested profile to a diligent one). In this regard, the number and variety of evaluation cases reflects the need of adapting to the expert’s limited availability:
5.4. Report Examples and Evaluation of SLAR
103
• These were studied and chosen manually to cover the highest number of possible situations for every portfolio element. In this regard, a smaller subset of the 72 students is able to cover such diversity, as the number of possible profiles is not very high (e.g. in most cases students with normal or high activity are usually regular and participate frequently and students with low activity are irregular and less frequent in their activity). • For each case, the expert had to provide a score for nine elements (Questions 1, 2 and seven subquestions for Q. 3). Thus, the pedagogue had to assess 180 elements in total. Given the lack of availability by the expert (who, as mentioned in Sec. 5.3, could not participate in the domain modeling process of the service), the number of evaluation cases considered was a good final compromise between a good representation of the possible situations and the availability of the experts for the assessment process.
5.4.3
Evaluation results
There is a certain controversy in the literature about how to analyze Likert scale data. In this regard, two contrary positions emerge. The first states that, since Likert scale data provides ordinal results (one can know that 5 is better than 4), statistical techniques which are classically applied to interval data (e.g. mean or standard deviation) should not be applied (because one does not know the actual distance between the scale numbers when the subject answers the questionnaire, the numbers are just a representation of the qualitative agreement degree the subject shows towards a certain question) [59]. On the other hand, others defend that the use of means and other parametric statistics does not endorse any problem at all [83].
Average St. deviation Median IQR
Q.1 5 0 5 0
Q.2 3.6 0.58 4 1
Blogs 3.95 0.59 4 0
Comments 4 0.71 4 1.5
Files 3.7 0.56 4 1
Q.3 Pages 4.9 0.3 5 0
Twits 3.75 0.54 4 1
Bookmarks 4.6 0.58 5 1
Impact 3.7 0.56 4 1
Table 5.2: Evaluation results for SLAR.
Indicators from both perspectives have been included in Table 5.2. However, the analysis of these results will be focused mainly on the median and interquartile range (IQR) results, as they provide a measurement of centrality and dispersion which is more appropriate for the case of ordinal data.
104 Chapter 5. SLAR: A data-to-text service for verbalizing a learning analytics dashboard Results show that most of the answers provided by the expert are placed in the positive side of the scale (with medians for each question in 4/5 and IQRs between 0 and 1). More specifically, the expert has given Question 1 a very positive score (Median=5, IQR=0). This shows that the provided reports were considered useful for the Pedagogy domain in a general sense. Question 2 also obtained good scores (Median=4, IQR=1), but in this case some of the individual scores show that the content of the reports that were generated did not include all the information that the expert would produce. Finally, all subquestions in Question 3 obtained similar positive global scores (Median=4/5, IQR=0/1/1.5). In this sense, the expert strongly agrees with the veracity of the information in the texts, although there appears some dispersion in every subquestion (this is more evident, for instance, in the Comments subquestion, with an IQR of 1.5). Since the knowledge base in SLAR was built without the aid of a pedagogue or a domain expert, some divergences between the expert’s judgement and the content assessment by the system were to be expected. Nonetheless, this shows that the performance of SLAR in terms of content truthfulness fulfills in a high degree the expert’s expectations.
5.5
SLAR for LDD+D2T
In this chapter the SoftLearn Activity Reporter (SLAR) service has been described. This application, which is able to generate textual reports about the students’ behavior in virtual learning environments, was integrated into the SoftLearn platform, where it was tested and assessed preliminarily with real data generated by 72 learners of the Educational Technology undergraduate course of the Degree in Pedagogy at the Faculty of Education of the Universidade de Santiago de Compostela. Its subsequent evaluation by an expert pedagogue proves that, although there is a small divergence between the expert’s expectactions and what SLAR currently provides, the system is able to complement and enhance the information provided by SoftLearn’s graphical visualization tools, helping teachers understand more clearly how students behave during the course and facilitating their evaluation process. SLAR also shows that the use of D2T techniques in the field of learning analytics is highly viable. For instance, this kind of technology allows teachers to evaluate and assess students in a faster way, while students can access a live on-demand textual assessment of their activity in a course that provides them with a very valuable on-time feedback regarding their performance. As a result, the user experience in learning analytics dashboards is improved,
5.5. SLAR for LDD+D2T
105
which in turn may help increase the performance of both teachers and learners. Although SLAR was designed and conceived using a similar design strategy as the one used for GALiWeather, it does not include any fuzzy approaches. In this regard, SLAR is however an useful contribution to this PhD thesis for the following reasons: • It is a practical D2T application, which has led to a better understanding of this paradigm. • It has also helped inspire the model described in Chapter 3, especially regarding its generality beyond the use of classic fuzzy protoforms. • It improves the evaluation analysis performed for GALiWeather by taking into account the problems of analyzing Likert-scale data, which were unintentionally not considered due to a lack of awareness on this topic at the time of GALiWeather’s evaluation tasks. • It has also opened an interesting discussion in the field of learning analytics, where dashboards including metrics and visualization plots have been the only way to provide information to both teachers and learners. In this regard, SLAR offers a more humanfriendly complementary approach.
C HAPTER 6
C ONCLUSIONS In this PhD dissertation the problem of the application of fuzzy sets in data-to-text NLG systems has been addressed from both practical and theoretical perspectives. Particularly, this work has focused mainly on an extensive revision of both fields and a study of how fuzzy setrelated techniques (linguistic description of data) can benefit from and may be used in NLG systems to tackle the problem of uncertainty and imprecision. This study, which has resulted in significative contributions to the state of the art, was made from two different perspectives: • From a theoretical perspective, by providing preliminary insights into potential relationship points between LDD and NLG, and by conceiving a model that encompasses the elements in linguistic description of data, aimed primarily at content determination tasks in D2T contexts. Chapter 2 provides a solid background for a potential integration of fuzzy techniques into D2T/NLG. It identifies content determination as the main use of fuzzy techniques for NLG systems, but also considers additional convergence points such as the use of conversational maxims. The LDD model described in Chapter 3, follows the main idea of using LDD for content determination identified in Chapter 2 and encompasses the most common techniques in LDD and those used in GALiWeather and SLAR, in order to provide a structural framework for the creation of linguistic descriptions of data which can be used as part of a D2T-NLG system: – It provides a general methodology which allows approaching LDD for the task
108
Chapter 6. Conclusions of extracting linguistic information from data sets, with a special focus on time series data. – It also considers the most important real-life elements which take part in a description process, including the application context, the entities which are the objects of description, and the actors which produce the descriptions. – It defines an incremental hierarchical model of generic linguistic expressions which can be used to extract different kinds of linguistic information. Such model is based on standard fuzzy linguistic protoforms, but provides a more general framework which can be easily extended with different expressions. – Since it is based partly on actual experience, the model is not limited to fuzzy definitions of linguistic terms, but also considers other kind of crisp definitions such as numeric intervals or categories. • From a practical, applied point of view. Two applied developments which solve an actual need for automatically-generated textual information were conceived during the scope of this PhD thesis, GALiWeather and SLAR: – GALiWeather makes use of fuzzy sets and type-I fuzzy quantified statements to perform the description of the cloud coverage variable. In this regard, this service is the first text generation system which has actually been deployed for real service which makes use of such techniques. – Both GALiWeather and SLAR were essential for understanding how NLG systems work and studying potential connection between NLG and fuzzy sets. Although both systems make use of similar template-based NLG approaches, GALiWeather includes additional logic to address aggregation tasks. This led to a better understanding of the limits and restraints of template-based NLG, and how approaching the NLG process differently (following a pipeline-oriented architecture) could help overcome such limitations.
6.1
Beyond this PhD thesis
Although clear contributions are given in this dissertation in regards to the application of fuzzy sets in data-to-text and, in a more general scope, natural language generation, this PhD thesis is by no means conclusive per se, as it actually opens a door to many potential collaboration
6.1. Beyond this PhD thesis
109
topics between both fields. The interest on this relationship from both sides is currently high on this respect [74, 91, 73, 18, 50], and it is not clear yet what form (or how many forms) this relationship will take, as natural language generation involves several tasks which can potentially be imbued with fuzzy techniques. In this regard, and taking into account the different perspectives and backgrounds from both disciplines, the research line followed in this PhD can be expanded in many ways.
6.1.1
Fuzzy Sets and Linguistic Description of Data
From a fuzzy sets and linguistic description of data perspective, there are some issues which should be addressed in the future to ensure that these can be used properly in the development of applied D2T/NLG systems. One of the main downsides in this regard is that LDD is mostly restricted to protoform structures and, although they are flexible enough to be extended into more sophisticated forms (including time and spatial dimensions, for instance), their usage in real applications is not feasible when provided as is. In this regard, Kacprzyk and Zadro˙zny proposed in [64] to define new types of protoforms “to make a full use of the power of NLG tools”. Although expanding the current collection of protoforms would entail a significant advance for LDD in terms of expressiveness, that would not necessarily bring LDD closer to NLG or to its usage in real applications. Nevertheless, to aim at systems producing texts solely based on fuzzy protoforms, however complex these may be, seems unrealistic in many cases. Fuzzy sets theory provides powerful tools to manage uncertainty and imprecision in the generation of linguistic expressions, but first it should be determined when its usage is appropriate. This issue is directly related to a relevant concept also noted in [64], namely the domain-modeling. For instance, GALiWeather employs type-1 fuzzy quantified sentences to perform a global description of the cloud coverage variable, but it also uses different crisp approaches to extract the relevant information from other variables such as precipitation or temperature. The usage of such distinct techniques responds to the needs of the domain experts, who provided both the linguistic specifications and most of the domain knowledge required to build the system. Thus, the perspective should shift from “how to use standalone LDD in real applications” to “when and how to use LDD as part of real NLG (or D2T) systems”. In a general sense, the analysis of the corpus texts of a specific application domain (or the linguistic requirements of the experts if no example texts are available) will shed light on this issue, but research should probably be made in order to establish a good methodology which allows to ascertain
110
Chapter 6. Conclusions
when fuzzy approaches can be properly used as part of an NLG system, and which specific techniques could be applied. This directly leads to another challenge that restricts the usage of LDD in real applications and which has not been previously considered, namely the problem of building fuzzy definitions of linguistic terms based on expert knowledge. In general, the problem of mapping the intuitive notion of a subjective concept from the application domain into a fuzzy set or relationship has not been a primary concern in the literature in LDD, as theory and use cases had to be developed first in order to show the potential applications of this kind of techniques. Even in more recent applied approaches which generate actual texts, linguistic variables were defined by authors and the quality of each solution as a whole was checked through an evaluation process by experts, e.g. [45, 95]. While to impersonate an expert domain in order to fill knowledge gaps for the application of LDD techniques can be considered admissible and plausible to a certain extent, this practice seems to be in conflict with the purpose of a domain-modeling process: in order to be able to use LDD, the author creates fuzzy definitions for linguistic terms based on self-judgments about the application domain, rather than capturing this meaning from the domain itself. In this sense, NLG has traditionally used empirical techniques to assess the meaning of words and terms in an as accurate as possible way. For instance, for the development of the NLG system SumTime-Mousan [104], Reiter et al. analyzed a parallel set of textual wind forecasts by five different experts and their corresponding data in order to achieve a coherent definition of temporal expressions such as “by evening” or “by midday”. Subsequent evaluations of the system showed that overall forecast readers preferred the wind texts generated by the system over human-written wind texts. In other cases experiments were run in order to study how human subjects use linguistic expressions in different domains (e.g. [39, 50]). In this regard, the main challenge for the future resides in bringing such empirical approaches into LDD and adapting them for achieving a proper definition of fuzzy linguistic terms. This, depending on the kind of LDD statements which could be used, also opens up the possibility of performing experimentation to determine, for instance, which operators could be used effectively for combining different properties (e.g. as in “most of the students are short and fast”), such as the compensatory operators proposed by Zimmermman [143] or the OWA operators by Yager [131]. In a general sense, this would imply the instantiation of the theoretical models developed in fuzzy sets based on standard NLG empirical approaches for different application domains.
6.1. Beyond this PhD thesis
111
Terminology Another high level issue related to the research problems discussed in this PhD thesis, which may very well become a problem in the future, is the terminology used in the literature to refer to the concept of linguistic descriptions of data. This dissertation has tried to keep a clear distinction between LDD, NLG and D2T and, although the two latter terms are well established in terms of usage, LDD has been named differently or used with distinct meanings in the literature. LDD was originally conceived as “linguistic summarization of data” [132] and this name is still used in many fuzzy sets research papers. While it represents reasonably well what is intended to achieve with the use of fuzzy techniques to obtain linguistic information, this terminology may confuse readers from other disciplines, as summarization is a well-known discipline in NLG and NLP (generating texts which summarize larger documents), which is totally unrelated to LDD. Other authors are considering LDD as an alternate approach which actually reunites NLG/D2T and what has been defined as LDD in this dissertation [74]. This is an interesting proposal which fits well the idea of reuniting both paradigms, but it just may add more confusion to this problem if a consensus is not achieved. The most surprising fact in this terminology discussion is that the names used until now (“linguistic summarization of data”, “linguistic description of data”, “linguistic description of phenomena”) do not explicitly emphasize the fuzzy nature of the techniques and operations LDD encompasses. Perhaps there has been a misguided effort in the fuzzy community for trying to establish LDD (regardless of the name used to refer to it) as a field of its own, although, objectively, any LDD practical approach found in the literature is just a D2T system which uses fuzzy techniques and evaluation criteria to determine the content, and very simple templates to provide that content in the form of natural language texts. For this, although in the publications conceived during the PhD scope LDD was considered a research field or discipline derived from fuzzy sets, this consideration was nuanced for this PhD dissertation to reflect this reality, where LDD is depicted as a research direction which encompasses the application of fuzzy sets for extracting imprecise linguistic information. In other disciplines where fuzzy sets were incorporated to improve existing algorithms, the name of the original problem or task is still maintained, such as in fuzzy clustering and fuzzy classification. In this regard, it would also be hard to follow the same naming convention followed in those cases and aim for a “fuzzy D2T”, or “fuzzy NLG” to refer to those tasks or systems that fit the purpose of D2T/NLG and integrate any kind of fuzzy approaches. For
112
Chapter 6. Conclusions
instance, it does not seem sensible to deem GALiWeather as a “fuzzy D2T system” because a few tasks, which are just a small part of the whole system, are performed by means of fuzzy techniques. The title of this PhD dissertation, “Application of fuzzy sets in D2T systems”, is possibly one of the most general ways to define what has been done in LDD from a practical perspective without entering into conflict with other nomenclatures. Thus, the proposal of this dissertation in this regard is simply to abandon the conception of LDD as a field and all its terminology variations. Research dissemination should just indicate that fuzzy sets are used when such usage is meaningful, since utilizing fuzzy sets should not be an objective itself that has to be enforced [66], but merely a means or a tool to solve a problem that actually requires it.
6.1.2
Natural Language Generation
From a D2T/NLG perspective, although in Chapter 2 content determination was stated to be the most intuitively related task to LDD of all the subtasks described in the NLG pipeline by Reiter and Dale [101], ways for further exploration which allow to consider an even wider and meaningful usage of fuzzy sets beyond content determination can be explored: • Document structuring. Discourse relations could be an interesting source of inspiration for modeling new kinds of more complex protoforms, which consider contrast or emphasizing relationships, e.g. “The month was predominantly warm but there was a cold period towards the end”. • Lexicalization. Based on the obtained fuzzy information during content determination, one must decide how to express it in natural language. How does a fulfillment degree influence the semantics of a given term or expression? • Aggregation. Could be performed in some cases by using fuzzy aggregation operators in content determination, instead of being performed at a structural level (e.g. “The month was cold and dry”). However research should be made to determine the equivalence of structural aggregation and the use of fuzzy operators. • Referring expression generation. This is a natural extension of the use of fuzzy sets for content determination and perhaps the most promising topic, where the problem of identifying certain entities in the discourse could be tackled by using fuzzy prop-
6.1. Beyond this PhD thesis
113
erties which, in turn, would require to adapt standard referring expression generation algorithms to handle fuzziness. The use of fuzzy sets to provide imprecision and uncertainty management capabilities in NLG systems is a promising research line which has many ramifications. Although this kind of techniques seems to fit primarily in content-related tasks, the diversity of problems involved in such tasks allows for many possibilities. Furthermore, even more structure-focused NLG tasks such as aggregation or document structuring could also benefit from fuzzy sets. The final purpose of this strong collaboration between these both major fields in the artificial intelligence community is to provide better systems which, in the context of Data Science, produce more human-friendly information in the form of natural language texts while managing the vagueness and imprecision included in the semantics underlying such information. Within this context, D2T/NLG systems, either alone or as a complementary support to visualization, will allow to improve the understanding of large data sets in many application domains and bring data closer to people.
Bibliography [1]
Automated Insights Homepage. Available at www.automatedinsights.com.
[2]
Arria Homepage, July 2014. Available at www.arria.com.
[3]
CoGenTex Homepage, July 2014. Available at www.cogentex.com.
[4]
Met Office Data2Text Webpage, July 2014. Available at www.metoffice.gov. uk/public/weather/forecast-data2text.
[5]
NarrativeScience homepage, July 2014. Available at www.narrativescience. com.
[6]
SoftLearn demo, 2015. Available at tec.citius.usc.es/SoftLearn/.
[7]
Yseop homepage, March 2015. Available at www.yseop.com.
[8]
A. Alvarez-Alvarez and G. Trivino. Linguistic description of the human gait quality. Engineering Applications of Artificial Intelligence, 26(1):13 – 23, 2013.
[9]
I. Androutsopoulos, V. Kokkinaki, A. Dimitromanolaki, J. Calder, J. Oberlander, and E. Not. Generating multilingual personalized descriptions of museum exhibits – the m-piro project. In Proceedings of the 29th. conference on computer applications and quantitative methods in archaeology, Gotland, Sweden, 2001.
[10]
R. Barzilay and M. Lapata. Collective content selection for concept-to-text generation. In Proceedings of the Conference on Human Language Technology and Empirical Methods in Natural Language Processing, HLT ’05, pages 331–338, Stroudsburg, PA, USA, 2005. Association for Computational Linguistics.
116
Bibliography
[11]
J. A. Bateman. Natural language generation: an introduction and open-ended review of the state of the art, 2001. Available at http://www.fb10.uni-bremen.de/ anglistik/langpro/webspace/jb/info-pages/nlg/ATG01/node1. html.
[12]
J. A. Bateman and M. Zock.
Nlg systems wiki.
Available at http://www.
nlg-wiki.org/systems/. [13]
A. Belz. Automatic generation of weather forecast texts using comprehensive probabilistic generation-space models. Nat. Lang. Eng., 14(4):431–455, Oct. 2008.
[14]
A. Belz and E. Reiter. Comparing automatic and human evaluation of nlg systems. In In Proc. EACL’06, pages 313–320, 2006.
[15]
L. BonJour. Epistemological problems of perception. In E. N. Zalta, editor, The Stanford Encyclopedia of Philosophy. Spring 2013 edition, 2013.
[16]
S. Boyd. Trend: A system for generating intelligent descriptions of time-series data. In Proceedings of the IEEE International Conference on Intelligent Processing Systems (ICIPS-1998, 1998.
[17]
M. Boyer and G. Lapalme. Generating paraphrases from meaning-text semantic networks. Computational Intelligence, 1(1):103–117, 1985.
[18]
A. Bugarin, N. Marin, D. Sanchez, and G. Trivino. Aspects of quality evaluation in linguistic descriptions of data. In Fuzzy Systems (FUZZ-IEEE), 2015 IEEE International Conference on, pages 1–8, Aug 2015.
[19]
S. Busemann and H. Horacek. Generating air-quality reports from environmental data. In S. Busemann, T. Becker, and W. Finkler, editors, DFKI Workshop on Natural Language Generation, DFKI Document D-97-06, 1997.
[20]
L. Cahill, J. Carroll, R. Evans, D. Paiva, R. Power, D. Scott, and K. van Deemter. From rags to riches: Exploiting the potential of a flexible generation architecture. In Proceedings of the 39th Annual Meeting on Association for Computational Linguistics, ACL ’01, pages 106–113, Stroudsburg, PA, USA, 2001. Association for Computational Linguistics.
Bibliography [21]
117
R. Castillo-Ortega, N. Mar´ın, C. Mart´ınez-Cruz, and D. S´anchez. A proposal for the hierarchical segmentation of time series. application to trend-based linguistic description. In IEEE International Conference on Fuzzy Systems, pages 489–496, 2014.
[22]
R. Castillo-Ortega, N. Mar´ın, and D. S´anchez. A fuzzy approach to the linguistic summarization of time series. Multiple-Valued Logic and Soft Computing, pages 157– 182, 2011.
[23]
R. Castillo-Ortega, N. Mar´ın, D. S´anchez, and A. Tettamanzi. Quality assessment in linguistic summaries of data.
In S. Greco, B. Bouchon-Meunier, G. Coletti,
M. Fedrizzi, B. Matarazzo, and R. Yager, editors, Advances in Computational Intelligence, volume 298 of Communications in Computer and Information Science, pages 285–294. Springer Berlin Heidelberg, 2012. [24]
R. Castillo-Ortega, N. Mar´ın, D. S´anchez, and A. G. Tettamanzi. Linguistic summarization of time series data using genetic algorithms. In Advances in Intelligent Systems Research, volume 1 - 1, pages 416 – 423, 2011.
[25]
J. Coch. Evaluating and comparing three text-production techniques. In Proceedings of the 16th International Conference on Computational Linguistics (COLING’96), pages 249–254, Copenhagen, Denmark, 1996.
[26]
J. Coch. Interactive generation and knowledge administration in multimeteo. In Proceedings of the Ninth International Workshop on Natural Language Generation, pages 300–303, Niagara-on-the-lake, Ontario, Canada, 1998. software demonstration.
[27]
J. Coch. Multimeteo: multilingual production of weather forecasts. ELRA Newsletter, 3(2), 1998.
[28]
J. Coch, R. David, and J. Magnoler. Quality test for a mail generation system. In Proceedings of Linguistic Engineering ’95, pages 435–443, Montpellier, France, 1995.
[29]
J. Coch, E. D. Dycker, J.-A. Garc´ıa-Moya, H. Gmoser, J.-F. Stranart, and J. Tardieu. Multimeteo: adaptable software for interactive production of multilingual weather forecasts. In Proceedings of the 4th European Conference on Applications of Meteorology (ECAM 99), Norrk¨oping, Sweden, 1999.
118
Bibliography
[30]
CoGenTex. Project reporter website. Available at http://www.cogentex.com/ products/reporter/.
[31]
E. Comission. Open data. an engine for innovation, growth and transparent governance, December 2011.
[32]
T. Crane. The problem of perception. In E. N. Zalta, editor, The Stanford Encyclopedia of Philosophy. Winter 2014 edition, 2014.
[33]
R. Dale, S. Geldof, and J.-P. Prost. Generating more natural route descriptions. In 2002 Australasian Workshop on Natural Language Processing, pages 41–48, Canberra, Australia, December 2002.
[34]
R. Dale, S. Geldof, and J.-P. Prost. Coral: Using natural language generation for navigational assistance. In M. Oudshoorn, editor, Proceedings of the 26th Australasian Computer Science Conference (ACSC2003), Adelaide, Australia, 2003.
[35]
R. Dale, S. Geldof, and J.-P. Prost. Using natural language generation in automatic route description. In Journal of Research and Practice in Information Technology, pages 89–105, 2005.
[36]
R. Dale and E. Reiter. Computational interpretations of the gricean maxims in the generation of referring expressions. Cognitive Science, 19:233–263, 1995.
[37]
S. Dawson, A. Bakharia, and E. Heathcote. SNAPP: Realising the affordances of realtime sna within networked learning environments. In L. Dirckinck-Holmfeld, V. Hodgson, C. Jones, M. de Laat, D. M. David, and T. Ryberg, editors, 7th International Conference on Networked Learning, pages 125–133, Lancaster, 2010. Lancaster University.
[38]
S. Dawson, D. Gaˇsevi´c, G. Siemens, and S. Joksimovic. Current state and future trends: A citation network analysis of the learning analytics field. In Proceedings of the Fourth International Conference on Learning Analytics And Knowledge, LAK ’14, pages 231– 240, New York, NY, USA, 2014. ACM.
[39]
R. de Oliveira, Y. Sripada, and E. Reiter. Proceedings of the 15th European Workshop on Natural Language Generation (ENLG), chapter Designing an Algorithm for Generating Named Spatial References, pages 127–135. Association for Computational Linguistics, 2015.
Bibliography [40]
119
M. Delgado, M. D. Ruiz, D. S´anchez, and M. A. Vila. Fuzzy quantification: a state of the art. Fuzzy Sets and Systems, 242(0):1 – 30, 2014. Theme: Quantifiers and Logic.
[41]
N. Dethlefs. Context-sensitive natural language generation: From knowledge-driven to data-driven techniques. Language and Linguistics Compass, 8(3):99–115, 2014.
[42]
F. D´ıaz-Hermida and A. Bugar´ın. Semi-fuzzy quantifiers as a tool for building linguistic summaries of data patterns. In IEEE Symposium on Foundations of Computational Intelligence, pages 45–52, 2011.
[43]
F. D´ıaz-Hermida, A. Ramos-Soto, and A. Bugar´ın. On the role of fuzzy quantified statements in linguistic summarization. In Proceedings of 11th International Conference on. Intelligent Systems Design and Applications (ISDA), pages 166–171, 2011.
[44]
C. A. Donis-D´ıaz, R. Bello, and J. Kacprzyk. Using ant colony optimization and genetic algorithms for the linguistic summarization of creep data. In Intelligent Systems’2014, volume 322 of Advances in Intelligent Systems and Computing, pages 81– 92. Springer International Publishing, 2015.
[45]
L. Eciolaza, M. Pereira-Fari˜na, and G. Trivino. Automatic linguistic reporting in driving simulation environments. Applied Soft Computing, 13(9):3956 – 3967, 2013.
[46]
L. Eciolaza and G. Trivino. Linguistic reporting of driver behavior: Summary and event description. In Intelligent Systems Design and Applications (ISDA), 2011 11th International Conference on, pages 148–153, Nov 2011.
[47]
D. Galanis and I. Androutsopoulos. Generating multilingual descriptions from linguistically annotated owl ontologies: the naturalowl system. In Proceedings of the 11th European Workshop on Natural Language Generation (ENLG 2007), pages 143–146, Schloss Dagstuhl, Germany, 2007.
[48]
L. T. F. Gamut. Logic, Language and Meaning. University of Chicago Press, 1991.
[49]
A. Gatt and A. Belz. Introducing shared tasks to nlg: The tuna shared task evaluation challenges. In E. Krahmer and M. Theune, editors, Empirical Methods in Natural Language Generation, volume 5790 of Lecture Notes in Computer Science, pages 264– 293. Springer Berlin Heidelberg, 2010.
120
Bibliography
[50]
A. Gatt and F. Portet. Multilingual generation of uncertain temporal expressions from data: A study of a possibilistic formalism and its consistency with human subjective evaluations. Fuzzy Sets and Systems, 285:73 – 93, 2016. Special Issue on Linguistic Description of Time Series.
[51]
A. Gatt and E. Reiter. Simplenlg: A realisation engine for practical applications. In Proceedings of ENLG-2009, 2009.
[52]
P. Gerv´as, B. D´ıaz-Agudo, F. Peinado, and R. Herv´as. Story plot generation based on CBR. Knowledge-Based Systems, 18(4–5):235 – 242, 2005.
[53]
D. Gkatzia, H. Hastie, S. Janarthanam, and O. Lemon. Proceedings of the 14th European Workshop on Natural Language Generation, chapter Generating Student Feedback from Time-Series Data Using Reinforcement Learning, pages 115–124. Association for Computational Linguistics, 2013.
[54]
D. Gkatzia, H. Hastie, and O. Lemon. Comparing multi-label classification with reinforcement learning for summarisation of time-series data. In Proceedings of the 52nd Annual Meeting of the Association for Computational Linguistics (Volume 1: Long Papers), pages 1231–1240. Association for Computational Linguistics, 2014.
[55]
E. Goldberg, N. Driedger, and R. Kittredge. Using natural-language processing to produce weather forecasts. IEEE Expert, 9(2):45–53, 1994.
[56]
S. Govaerts, K. Verbert, E. Duval, and A. Pardo. The student activity meter for awareness and self-reflection. In J. A. Konstan, E. H. Chi, and K. H¨oo¨ k, editors, Conference on Human Factors in Computing Systems CHI 2012, Extended Abstracts Volume, pages 869–884. ACM, 2012.
[57]
J. Hunter, Y. Freer, A. Gatt, E. Reiter, S. Sripada, and C. Sykes. Automatic generation of natural language nursing shift summaries in neonatal intensive care: Bt-nurse. Artificial Intelligence in Medicine, 56(3):157 – 172, 2012.
[58]
D. H¨uske-Kraus. Suregen 2: A shell system for the generation of clinical documents. In Proceedings of the 10th Conference of the European Chapter of the Association for Computational Linguistics (EACL-2003), pages 215–218, 2003. (Research Notes and Demos).
Bibliography [59]
121
S. Jamieson. Likert scales: how to (ab)use them. Medical Education, 38(12):1217– 1218, 2004.
[60]
S. Janarthanam and O. Lemon. Adaptive generation in dialogue systems using dynamic user modeling. Comput. Linguist., 40(4):883–920, Dec. 2014.
[61]
K. S. Jones and J. R. Galliers. Evaluating Natural Language Processing Systems: An Analysis and Review. Springer-Verlag New York, Inc., Secaucus, NJ, USA, 1996.
[62]
J. Kacprzyk and A. Wilbik. Using fuzzy linguistic summaries for the comparison of time series: an application to the analysis of investment fund quotations. In Proceedings IFSA/EUSFLAT Conf. 2009, pages 1321–1326, 2009.
[63]
J. Kacprzyk and S. Zadrozny. Linguistic database summaries and their protoforms: towards natural language based knowledge discovery tools. Inf. Sci. Inf. Comput. Sci., 173(4):281–304, 2005.
[64]
J. Kacprzyk and S. Zadrozny. Computing with words is an implementable paradigm: Fuzzy queries, linguistic data summaries, and natural-language generation. Fuzzy Systems, IEEE Transactions on, 18(3):461–472, June 2010.
[65]
J. Kacprzyk and S. Zadrozny. Linguistic data summarization: A high scalability through the use of natural language? Scalable Fuzzy Algorithms for Data Management and Analysis: Methods and Design, pages 214–237, 2010.
[66]
J. Kacprzyk and S. Zadro˙zny. Fuzzy logic-based linguistic summaries of time series: a powerful tool for discovering knowledge on time varying processes and systems under imprecision. Wiley Interdisciplinary Reviews: Data Mining and Knowledge Discovery, 6(1):37–46, 2016.
[67]
R. Kittredge, A. Polgu`ere, and E. Goldberg. Synthesizing weather forecasts from formated data. In Proceedings of the 11th Coference on Computational Linguistics, COLING ’86, pages 563–565, Stroudsburg, PA, USA, 1986. Association for Computational Linguistics.
[68]
I. Kobayashi and N. Okumura. Verbalizing time-series data: With an example of stock price trends. In Proceedings IFSA/EUSFLAT Conf., pages 234–239, 2009.
122
Bibliography
[69]
R. Kondadadi, B. Howald, and F. Schilder. A statistical nlg framework for aggregated planning and realization. In Proceedings of the 51st Annual Meeting of the Association for Computational Linguistics (Volume 1: Long Papers), pages 1406–1415, Sofia, Bulgaria, August 2013. Association for Computational Linguistics.
[70]
I. Konstas and M. Lapata. A global model for concept-to-text generation. J. Artif. Int. Res., 48(1):305–346, Oct. 2013.
[71]
F. Mairesse and S. Young. Stochastic language generation in dialogue using factored language models. Comput. Linguist., 40(4):763–799, Dec. 2014.
[72]
R. M. Maldonado, J. Kay, K. Yacef, and B. Schwendimann. An interactive teacher’s dashboard for monitoring groups in a multi-tabletop learning environment. In S. A. Cerri, J. C. William, G. Papadourakis, and K. Panourgia, editors, 11th International Conference on Intelligent Tutoring Systems (ITS 2012), volume 7315 of Lecture Notes in Computer Science, pages 482–492. Springer, 2012.
[73]
N. Mar´ın and D. S´anchez. Fuzzy sets and systems + natural language generation: A step forward in the linguistic description of time series. Fuzzy Sets and Systems, 285:1 – 5, 2016. Special Issue on Linguistic Description of Time Series.
[74]
N. Mar´ın and D. S´anchez. On generating linguistic descriptions of time series. Fuzzy Sets and Systems, 285:6 – 30, 2016. Special Issue on Linguistic Description of Time Series.
[75]
C. Mellish, D. Scott, L. Cahill, D. Paiva, R. Evans, and M. Reape. A reference architecture for natural language generation systems. Natural Language Engineering, 12:1–34, 3 2006.
[76]
C. Menendez and G. Trivino. Selection of the best suitable sentences in linguistic descriptions of data. In S. Greco, B. Bouchon-Meunier, G. Coletti, M. Fedrizzi, B. Matarazzo, and R. Yager, editors, Advances in Computational Intelligence, volume 298 of Communications in Computer and Information Science, pages 295–304. Springer Berlin Heidelberg, 2012.
[77]
C. Menendez-Gonzalez and G. Trivino. Olap navigation in the granular linguistic model of a phenomenon. In Computational Intelligence and Data Mining (CIDM), 2011 IEEE Symposium on, pages 260–267, April 2011.
Bibliography
123
[78]
MeteoGalicia. Meteogalicia’s website. Available at www.meteogalicia.es.
[79]
V. O. Mittal, G. Carenini, J. D. Moore, and S. Roth. Describing complex charts in natural language: A caption generation system. Computational Linguistics, 24(3):431– 467, Sept. 1998.
[80]
R A. Nenkova and K. McKeown. Automatic summarization. Foundations and Trends
in Information Retrieval, 5(2–3):103–233, 2011. [81]
A. Niewiadomski. A type-2 fuzzy approach to linguistic summarization of data. Fuzzy Systems, IEEE Transactions on, 16(1):198–212, Feb 2008.
[82]
A. Niewiadomski and I. Superson. Multi-subject type-2 linguistic summaries of relational databases. In A. Sadeghian and H. Tahayori, editors, Frontiers of Higher Order Fuzzy Sets, pages 167–181. Springer New York, 2015.
[83]
G. Norman. Likert scales, levels of measurement and the “laws” of statistics. Advances in Health Sciences Education, 15(5):625–632, 2010.
[84]
M. O’donnell, C. Mellish, J. Oberlander, and A. Knott. Ilex: An architecture for a dynamic hypertext generation system. Nat. Lang. Eng., 7(3):225–250, Sept. 2001.
[85]
K. Papineni, S. Roukos, T. Ward, and W.-J. Zhu. Bleu: A method for automatic evaluation of machine translation. In Proceedings of the 40th Annual Meeting on Association for Computational Linguistics, ACL ’02, pages 311–318, 2002.
[86]
K. Popper and J. Eccles. The Self and Its Brain. Springer Verlag, 1977.
[87]
F. Portet and A. Gatt. Towards a possibility-theoretic approach to uncertainty in medical data interpretation for text generation. In D. Ria˜no, A. ten Teije, S. Miksch, and M. Peleg, editors, Knowledge Representation for Health-Care. Data, Processes and Guidelines, volume 5943 of Lecture Notes in Computer Science, pages 155–168. Springer Berlin Heidelberg, 2010.
[88]
F. Portet, E. Reiter, A. Gatt, J. Hunter, S. Sripada, Y. Freer, and C. Sykes. Automatic generation of textual summaries from neonatal intensive care data. Artificial Intelligence, 173(7-8):789–816, May 2009.
124
Bibliography
[89]
R. Power and S. Williams. Generating numerical approximations. Comput. Linguist., 38(1):113–134, Mar. 2012.
[90]
T. Rabelo, M. Lama, R. R. Amorim, and J. C. Vidal. Smartlak: A big data architecture for supporting learning analytics services. In Frontiers in Education Conference (FIE), 2015. 32614 2015. IEEE, pages 1–5. IEEE, 2015.
[91]
A. Ramos-Soto, A. Bugar´ın, and S. Barro. On the role of linguistic descriptions of data in the building of natural language generation systems. Fuzzy Sets and Systems, 285:31–51, 2016.
[92]
A. Ramos-Soto, A. Bugar´ın, S. Barro, and F. D´ıaz-Hermida. Automatic linguistic descriptions of meteorological data a soft computing approach for converting open data to open information. In Information Systems and Technologies (CISTI), 2013 8th Iberian Conference on, pages 1–6, June 2013.
[93]
A. Ramos-Soto, A. Bugar´ın, S. Barro, N. Gallego, C. Rodr´ıguez, I. Fraga, and A. Saunders. Advances in Artificial Intelligence: 16th Conference of the Spanish Association for Artificial Intelligence, CAEPIA 2015 Albacete, Spain, November 9–12, 2015 Proceedings, chapter Automatic Generation of Air Quality Index Textual Forecasts Using a Data-To-Text Approach, pages 164–174. Springer International Publishing, Cham, 2015.
[94]
A. Ramos-Soto, A. Bugar´ın, S. Barro, and J. Taboada. Automatic generation of textual short-term weather forecasts on real prediction data. In Flexible Query Answering Systems, volume 8132 of Lecture Notes in Computer Science, pages 269–280. Springer Berlin Heidelberg, 2013.
[95]
A. Ramos-Soto, A. Bugar´ın, S. Barro, and J. Taboada. Linguistic descriptions for automatic generation of textual short-term weather forecasts on real prediction data. Fuzzy Systems, IEEE Transactions on, 23(1):44 – 57, 2015.
[96]
A. Ramos-Soto, M. Pereira-Fari˜na, A. Bugarin, and S. Barro. A model based on computational perceptions for the generation of linguistic descriptions of data. In Fuzzy Systems (FUZZ-IEEE), 2015 IEEE International Conference on, pages 1–8, 2015.
Bibliography [97]
125
A. Ramos-Soto, B. V´azquez-Barreiros, A. Bugar´ın, A. Gewerc, and S. Barro. Evaluation of a data-to-text system for verbalizing a learning analytics dashboard. International Journal of Intelligent Systems, Accepted 2016.
[98]
E. Reiter. An architecture for data-to-text systems. In S. Busemann, editor, Proceedings of the 11th European Workshop on Natural Language Generation, pages 97–104, 2007.
[99]
E. Reiter. Task-based evaluation of nlg systems: Control vs real-world context. In Proceedings of the UCNLG+Eval: Language Generation and Evaluation Workshop, UCNLG+EVAL ’11, pages 28–32, Stroudsburg, PA, USA, 2011. Association for Computational Linguistics.
[100] E. Reiter and R. Dale. Building applied natural language generation systems. Journal of Natural-Language Engineering, (3):57–87, 1997. [101] E. Reiter and R. Dale. Building Natural Language Generation Systems. Cambridge University Press, 2000. [102] E. Reiter, R. Robertson, and L. Osman. Types of knowledge required to personalise smoking cessation letters. In W. Horn, editor, Artifical Intelligence and Medicine: Proceedings of AIMDM-1999, pages 398–399. Springer, Berlin, New York, 1999. [103] E. Reiter, R. Robertson, and L. Osman. Lessons from a failure: Generating tailored smoking cessation letters. Artificial Intelligence, 144:41–58, 2003. [104] E. Reiter, S. Sripada, J. Hunter, and I. Davy. Choosing words in computer-generated weather forecasts. Artificial Intelligence, 167:137–169, 2005. [105] R. Sambaraju, E. Reiter, R. Logie, A. McKinlay, C. McVittie, A. Gatt, and C. Sykes. What is in a text and what does it do: qualitative evaluations of an nlg system – the bt-nurse – using content analysis and discourse analysis. In Proceedings of the 13th European Workshop on Natural Language Generation, ENLG ’11, pages 22–31. Association for Computational Linguistics, 2011. [106] M. G. S´anchez-Torrubia, C. Torres-Blanc, and G. Trivino. An approach to automatic learning assessment based on the computational theory of perceptions. Expert Syst. Appl., 39(15):12177–12191, Nov. 2012.
126
Bibliography
[107] D. Sanchez-Valdes, L. Eciolaza, and G. Trivino. Linguistic description of human activity based on mobile phone’s accelerometers. In J. Bravo, R. Herv´as, and M. Rodr´ıguez, editors, Ambient Assisted Living and Home Care, volume 7657 of Lecture Notes in Computer Science, pages 346–353. Springer Berlin Heidelberg, 2012. [108] S. Sheremetyeva and S. Nirenburg. Knowledge elicitation for authoring patent claims. IEEE Computer, pages 57–63, July 1996. [109] S. Sheremetyeva, S. Nirenburg, and I. Nirenburg. Generating patent claims from interactive input. In Proceedings of the 8th. International Workshop on Natural Language Generation (INLG’96), pages 61–70, Herstmonceux, England, June 1996. [110] G. Siemens and D. Gasevic. Guest editorial - learning and knowledge analytics. Educational Technology & Society, 15(3):1–2, 2012. [111] S. Sripada, E. Reiter, and I. Davy. SumTime-Mousam: Configurable marine weather forecast generator. Expert Update, 6(3):4–10, 2003. [112] S. G. Sripada, N. Burnett, R. Turner, J. Mastin, and D. Evans. A Case Study: NLG meeting Weather Industry Demand for Quality and Quantity of Textual Weather Forecasts. In INLG-2014 Proceedings, June 2014. [113] S. G. Sripada, E. Reiter, J. Hunter, and J. Yu. Generating english summaries of time series data using the gricean maxims. In Proceedings of the Ninth ACM SIGKDD International Conference on Knowledge Discovery and Data Mining, pages 187–196. ACM Press, 2003. [114] H. Stenzhorn. XtraGen — A Natural Language Generation System Using XMLand Java-Technologies. Diploma thesis, Computational Linguistics and Phonetics, Fachrichtung 4.7 Allgemeine Linguistik, University of the Saarland, Saarbr¨ucken, Germany, August 2002. [115] W. R. Swartout. A digitalis therapy advisor with explanations. Technical report, Cambridge, MA, USA, 1977. [116] G. Trivino and M. Sugeno. Towards linguistic descriptions of phenomena. International Journal of Approximate Reasoning, 54(1):22 – 34, January 2013.
Bibliography
127
[117] R. Turner, S. Sripada, E. Reiter, and I. P. Davy. Selecting the content of textual descriptions of geographically located events in spatio-temporal weather data. Applications and Innovations in Intelligent Systems, XV:75–88, 2007. [118] R. Turner, S. Sripada, E. Reiter, and I. P. Davy. Using spatial reference frames to generate grounded textual summaries of georeferenced data. In Proceedings of the Fifth International Natural Language Generation Conference, INLG ’08, pages 16– 24, Stroudsburg, PA, USA, 2008. Association for Computational Linguistics. [119] K. van Deemter. Generating referring expressions that involve gradable properties. Comput. Linguist., 32(2):195–222, June 2006. [120] K. van Deemter. Utility and language generation: The case of vagueness. Journal of Philosophical Logic, 38(6):607–632, 2009. [121] K. Van Deemter, E. Krahmer, and M. Theune. Real versus template-based natural language generation: A false opposition? Computational Linguistics, 31(1):15–24, Mar. 2005. [122] A. van der Heide and G. Trivino. Automatic generated linguistic summaries of energy consumption data. In Proceedings of 9th ISDA Conference, pages 553–559, 2009. [123] S. Varges and C. Mellish. Instance-based natural language generation. Nat. Lang. Eng., 16(3):309–346, July 2010. [124] B. V´azquez-Barreiros, M. Lama, M. Mucientes, and J. C. Vidal. Softlearn: A process mining platform for the discovery of learning paths. In 14th International Conference on Advanced Learning Technologies (ICALT 2014), pages 373–375. IEEE Press, 2014. [125] K. Verbert, E. Duval, J. Klerkx, S. Govaerts, and J. L. Santos. Learning analytics dashboard applications. American Behavioral Scientist, 57(10):1500–1509, 2013. [126] K. Verbert, S. Govaerts, E. Duval, J. L. Santos, F. V. Assche, G. Parra, and J. Klerkx. Learning dashboards: an overview and future research opportunities. Personal and Ubiquitous Computing, 18(6):1499–1514, 2014. [127] M. White and T. Caldwell. Exemplars: A practical, extensible framework for dynamic text generation. In 9th INLG, pages 266–275, Niagara-on-the-Lake, Ontario, 1998.
128
Bibliography
[128] A. Wilbik, U. Kaymak, J. M. Keller, and M. Popescu.
Evaluation of the truth
value of linguistic summaries – case with non-monotonic quantifiers.
In P. An-
gelov, K. Atanassov, L. Doukovska, M. Hadjiski, V. Jotsov, J. Kacprzyk, N. Kasabov, S. Sotirov, E. Szmidt, and S. Zadro˙zny, editors, Intelligent Systems’2014, volume 322 of Advances in Intelligent Systems and Computing, pages 69–79. Springer International Publishing, 2015. [129] A. Wilbik and J. M. Keller. A distance metric for a space of linguistic summaries. Fuzzy Sets and Systems, 208:79 – 94, 2012. [130] A. Wilbik, J. M. Keller, and G. L. Alexander. Similarity evaluation of sets of linguistic summaries. Int. J. Intell. Syst., 27(10):926–938, Oct. 2012. [131] R. Yager. On ordered weighted averaging aggregation operators in multicriteria decisionmaking. Systems, Man and Cybernetics, IEEE Transactions on, 18(1):183–190, Jan 1988. [132] R. R. Yager. A new approach to the summarization of data. Information Sciences, 28(1):69 – 86, 1982. [133] R. R. Yager, K. M. Ford, and A. J. Ca˜nas. An approach to the linguistic summarization of data. In Uncertainty in Knowledge Bases, 3rd International Conference on Information Processing and Management of Uncertainty in Knowledge-Based Systems, IPMU 90, Paris, France, July 2-6, 1990, Proceedings, volume 521 of Lecture Notes in Computer Science, pages 456–468. Springer, 1990. [134] J. Yu, J. Hunter, E. Reiter, and S. Sripada. An approach to generating summaries of time series data in the gas turbine domain. In Proceedings of IEEE International Conference on Info-tech & Info-net (ICII2001), pages 44–51, Beijing, 2001. [135] J. Yu, E. Reiter, J. Hunter, and S. Sripada. SumTime-Turbine: A Knowledge-Based System to Communicate Gas Turbine Time-Series Data. In P. Chung, C. Hinde, and M. Ali, editors, Developments in Applied Artificial Intelligence, volume 2718 of Lecture Notes in Computer Science, pages 379–384. Springer Berlin Heidelberg, 2003. [136] J. Yu, E. Reiter, J. Hunter, and S. G. Sripada. A new architecture for summarising time series data. In Proceedings of INLG-04, pages 47–50, 2004.
Bibliography
129
[137] L. A. Zadeh. A computational theory of dispositions. International Journal of Intelligent Systems, 2(1):39–63, 1987. [138] L. A. Zadeh. Fuzzy logic = computing with words. IEEE Transactions on Fuzzy Systems, 4(2):103–111, 1996. [139] L. A. Zadeh. From computing with numbers to computing with words : From manipulation of measurements to manipulation of perceptions. In Intelligent Systems and Soft Computing: Prospects, Tools and Applications, pages 3–40. Springer-Verlag, 2000. [140] L. A. Zadeh. A new direction in ai — toward a computational theory of perceptions. In B. Reusch, editor, Computational Intelligence. Theory and Applications, volume 2206 of Lecture Notes in Computer Science, pages 628–628. Springer Berlin Heidelberg, 2001. [141] L. A. Zadeh. A prototype-centered approach to adding deduction capability to search engines-the concept of protoform. In Intelligent Systems, 2002. Proceedings. 2002 First International IEEE Symposium, volume 1, pages 2–3, 2002. [142] L. A. Zadeh. Computing with words and perceptions - a paradigm shift. In Information Reuse Integration, 2009. IRI ’09. IEEE International Conference on, pages viii–x, Aug 2009. [143] H.-J. Zimmermann and P. Zysno. Latent connectives in human decision making. Fuzzy Sets and Systems, 4(1):37 – 51, 1980.
List of Figures
Fig. 1.1
Fuzzy sets allow to numerically model imprecise definitions of linguistic concepts. . . . . . . . . . . . . . . . . . . . . . . . . . . . . . . . . . . . .
Fig. 1.2
Contrast between protoform-like linguistic information and an actual natural language text ready for human comsumption by general public. . . . . . . .
Fig. 2.1
3 5
Generic NLG system activity and architecture diagram as depicted by Reiter and Dale in [101]. . . . . . . . . . . . . . . . . . . . . . . . . . . . . . . .
19
Fig. 2.2
Example of a weather forecast generated by FoG, as shown in [55]. . . . . .
23
Fig. 2.3
Example of weather forecasts generated by MultiMeteo. . . . . . . . . . . .
23
Fig. 2.4
Example of a weather forecast generated by SumTime-Mousam, as shown in [111]. . . . . . . . . . . . . . . . . . . . . . . . . . . . . . . . . . . . . . .
24
Fig. 2.5
Example of a road maintenance text generated by RoadSafe, as shown in [118]. 24
Fig. 2.6
Example of an air quality state report generated by TEMSIS, as shown in [19]. 24
Fig. 2.7
Example of a letter generated by STOP, as shown in [103]. . . . . . . . . . .
25
Fig. 2.8
Example of a textual report generated by BT-Nurse, as shown in [57]. . . . .
26
Fig. 2.9
Example of a patent description generated by Patent Claim Expert, as shown in [109]. . . . . . . . . . . . . . . . . . . . . . . . . . . . . . . . . . . . .
27
Fig. 2.10 Example of a instruction list generated by Coral, as shown in [35]. . . . . . .
28
132
List of Figures
Fig. 2.11 Example of a gas turbine analytic report generated by SumTime-Turbine, as shown in [135]. . . . . . . . . . . . . . . . . . . . . . . . . . . . . . . . . .
29
Fig. 2.12 Data2Text weather forecast by Arria NLG and the British Met Office, as shown in [4]. . . . . . . . . . . . . . . . . . . . . . . . . . . . . . . . . . .
30
Fig. 2.13 Example of a simple GLMP model that explains several 2CPs using data obtained from sensors, as shown in [116]. . . . . . . . . . . . . . . . . . . .
37
Fig. 2.14 Linguistic description example of a signal trend, as shown in [21]. . . . . . .
38
Fig. 2.15 Examples of learning assessment reports, as shown in [106]. . . . . . . . . .
39
Fig. 3.1
Schema of the role of LDD in a general NLG system and a data-to-text NLG system. . . . . . . . . . . . . . . . . . . . . . . . . . . . . . . . . . . . . .
45
Fig. 3.2
Global overview diagram of the LDD model . . . . . . . . . . . . . . . . .
46
Fig. 3.3
Perceiver detailed schema (excluding the reasoning process). . . . . . . . .
47
Fig. 3.4
Knowledge elements within a perceiver. . . . . . . . . . . . . . . . . . . . .
50
Fig. 3.5
Observational weather data set of the perceptible in this example. . . . . . .
53
Fig. 4.1
Example of a real weather forecast for 12th April, 2013 for Galicia, published at [78]. . . . . . . . . . . . . . . . . . . . . . . . . . . . . . . . . . .
Fig. 4.2
2012-2015 short-term and mid-term municipality forecast web application for Galicia [78]. . . . . . . . . . . . . . . . . . . . . . . . . . . . . . . . .
Fig. 4.3
60 61
Current short-term and mid-term municipality forecast web application for Galicia [78]. . . . . . . . . . . . . . . . . . . . . . . . . . . . . . . . . . .
62
Fig. 4.4
General schema of the application architecture. . . . . . . . . . . . . . . . .
63
Fig. 4.5
Real example of a data source for a given location used in the generation of the automatic weather forecasts. . . . . . . . . . . . . . . . . . . . . . . . .
64
Fig. 4.6
Global schema of the linguistic description generation method. . . . . . . .
65
Fig. 4.7
Chronological description fuzzy operator definitions and process example. .
67
Fig. 4.8
Global quantification description fuzzy operator definitions and process ex-
Fig. 4.9
ample. . . . . . . . . . . . . . . . . . . . . . . . . . . . . . . . . . . . . .
68
Precipitation episode extractor procedure. . . . . . . . . . . . . . . . . . . .
69
Fig. 4.10 Schema of the precipitation operator method with the current meteorological phenomena categories for precipitation and its associated labels. . . . . . . .
70
Fig. 4.11 Wind episode extractor algorithm. . . . . . . . . . . . . . . . . . . . . . . .
71
List of Figures
133
Fig. 4.12 Schema of the temperature operator, with the current definition of the temperature variation partition and its associated labels. . . . . . . . . . . . . .
73
Fig. 4.13 Temperature template sample and label sets from the English language template document. . . . . . . . . . . . . . . . . . . . . . . . . . . . . . . . .
74
Fig. 4.14 Schema of the structure of a NLG template file, which contains generic sentences and label sets. . . . . . . . . . . . . . . . . . . . . . . . . . . . . . .
75
Fig. 4.15 Schema of the NLG approach for the precipitation variable. . . . . . . . . .
77
Fig. 4.16 Precipitation data object structure for the NLG stage. . . . . . . . . . . . . . Fig. 4.17 Linguistic description forecast obtained with the application using real fore-
78
cast data for Pontevedra, 9th of December, 2013. . . . . . . . . . . . . . . .
79
Fig. 4.18 Linguistic description forecast obtained with the application using synthetic data. . . . . . . . . . . . . . . . . . . . . . . . . . . . . . . . . . . . . . .
80
Fig. 4.19 Linguistic description forecast obtained with the application using synthetic data. . . . . . . . . . . . . . . . . . . . . . . . . . . . . . . . . . . . . . .
80
Fig. 4.20 Schema of the validation composition. . . . . . . . . . . . . . . . . . . . .
82
Fig. 5.1
Global view of SoftLearn’s dashboard for when a given student is selected. .
91
Fig. 5.2
General architecture of SLAR. . . . . . . . . . . . . . . . . . . . . . . . . .
92
Fig. 5.3
Input data structure. . . . . . . . . . . . . . . . . . . . . . . . . . . . . . .
93
Fig. 5.4
Fragment of a template used in the text generation stage of SLAR. . . . . . .
98
Fig. 5.5
Automatic report example obtained from real data for an active student in the Blogs category. . . . . . . . . . . . . . . . . . . . . . . . . . . . . . . . . .
Fig. 5.6
99
Automatic report example obtained from real data for a learner with low activity. . . . . . . . . . . . . . . . . . . . . . . . . . . . . . . . . . . . . . 100
Fig. 5.7
Automatic report example obtained from real data for a learner with a normal behavior. . . . . . . . . . . . . . . . . . . . . . . . . . . . . . . . . . . . . 101
Fig. 5.8
Sample report case used in the evaluation of SLAR. . . . . . . . . . . . . . 102
List of Tables
Tab. 4.1
Polishing stage questionnaire score . . . . . . . . . . . . . . . . . . . . . .
84
Tab. 4.2
Evaluation questionnaire score . . . . . . . . . . . . . . . . . . . . . . . .
85
Tab. 5.1
Size of 72 students’ portfolios during 6 months. . . . . . . . . . . . . . . .
89
Tab. 5.2
Evaluation results for SLAR. . . . . . . . . . . . . . . . . . . . . . . . . . 103