Available online at www.sciencedirect.com
Physics Procedia 33 (2012) 612 – 618
2012 International Conference on Medical Physics and Biomedical Engineering
Application of Graph Data Mining Method in Distribution Network Economic Evaluation Jia-Qing ZHONG Key Lab of Power Electronics for Energy Conservation and Motor Drive of Hebei Province Yanshan University Qinhuangdao China 066004 E-mail:
[email protected]
Abstract In this paper, a hierarchical economic evaluation index system for distribution network is established. The various indicators of the distribution network and the correlation between the distribution network in order to form is proposed. Substructure discovery algorithm is used to. To avoid falling into local optimum, efficient global search capability of particle swarm is applied to substructure algorithm optimization. Finally, an example demonstrates the reasonablity and effectivity of the substructure found algorithm applied into distribution network economic evaluation. Optimization speed with particle swarm algorithm is fast. This study have practical significance to network planning. © by Elsevier B.V. Selection and/or peer review under responsibility of ICMPBE International ©2012 2011Published Published by Elsevier Ltd. Selection and/or peer-review under responsibility of [name Committee. organizer] Open access under CC BY-NC-ND license. Keywords: distribution network economy; hierarchical evaluation system; substructure discovery algorithm; map data mining particle swarm optimization
1 INTRODUCTION Under the new power regime, in order to fully grasp the operation of distribution network, evaluate the economics of the operation of distribution network with correct evaluated system is needed. The purpose is to find the main factors effecting the economic operation of distribution network and propose the loss reduction reform measures to improve the distribution network operation economy. Related documents at home and abroad on research and evaluation to electric network focused on grid reliability evaluation and the evaluation method [1-5]. But the basis for the evaluation of the grid, such as economic evaluation index system study does not much see. In this paper, a hierarchical economic evaluation index system for distribution network is established. There are some associations between factors in the establishment of index system, that is significant
1875-3892 © 2012 Published by Elsevier B.V. Selection and/or peer review under responsibility of ICMPBE International Committee. Open access under CC BY-NC-ND license. doi:10.1016/j.phpro.2012.05.111
Jia-Qing Zhong / Physics Procedia 33 (2012) 612 – 618
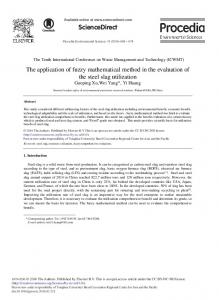
intersection with impact on the grid. The various indicators of the distribution network and the correlation between the distribution network in order to form is proposed. Substructure discovery algorithm is used to data mining. To avoid falling into local optimum, efficient global search capability of particle swarm algorithm is applied to substructure algorithm optimization. Finally, an example tests the rationality of the evaluation model and effectiveness. 2. ESTABLISH OF ECONOMIC EVALUATION INDEX SYSTEM TO DISTRIBUTION NETWORK According to the related technologies and procedures in construction and transformation of distribution network, by containing lots of useful information with research and comparison analyzing this information, a better scientific and reasonable index system to the economic operation evaluation of the distribution network is established. In order to reflect the economic operation of distribution network comprehensive and truly with the assess indexes, the economic operation hierarchical evaluation to the distribution network is established strictly with setting principles[6] in this paper. It gives attention to the reliability of distribution networks. The index system is shown in Figure 1. Load rate Load
Power Factor Load region
Distribution NetWork Economy
Distribution Network devices
Proportion of high energy transformer Wire passing rate of cross-sectional area Transformer capacity accounted Matching Run
Grid Struc -ture
Passing rate of bus voltage Power Supply Radius Capacity-load ratio
Fig 1 index system of power system network evaluation
The index system includes 3 arterial indexes and 11 secondary indexes. There have conjunctions between the two level indexes. 3. SUBSTRUCTURE DISCOVERY ALGORITHM WITH PSO
613
614
Jia-Qing Zhong / Physics Procedia 33 (2012) 612 – 618
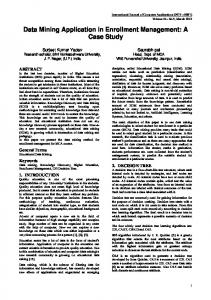
3.1 The substructure discovery algorithm Substructure discovery[7-10] is to find meaningful and repeated sub-picture section in the confused graph data. Graph data structure is a common representation. Substructure refers to graph data to all connected with each other subgraph isomorphic structure. The object is represented with the node and the relationship between nodes and edges with labels. There are labels to nodes and edges in order to make a distinction. Figure 2 is a labeled graph, where the ellipse represents node, the figure in ellipse for the node number, namely n1 , n2 , , and the x y for the node label. The edge is Represented by line section, and a b c d e f for the edge label. 1y d 3x
c
a 7y
d
8x
2y d
d f
4x
5x
c b
d b
c e
9x
10x
6x a
c
11x
d
12y
Fig 2. A labeled graph
Figure 2 is a connected graph. Sub-graphs of connected graph are instances of the sub-structure. Where g ( n1 , n2 , ) indicated that the sub-graphs formed by the nodes n1 , n2 , in a graph. For example,
g (5,6) and g (8,9) are isomorphic sub-graph. Its public structure is shown in Figure 3. x b x Fig 3. Sub-structure
The job of substructure discovery algorithm is to do data mining[11,12] in the connected graph from any node according to search conditions. If structure of connected graph is complex, the search process will be longer, and not traverse all graph data. To make the search faster and avoid falling into local optimum, efficient global search capability of particle swarm is applied to substructure algorithm optimization. The particle swarm optimization algorithm method has the group search feature and the strong ability of global search optimization. 3.2 Chaotic Ant Colony Algorithm In recent years the biologists find that the behavior of individual single ants is chaos. But there must exist certain intrinsic relationships between a single ant's chaos behavior and the whole swarm's organization It is a natural selection to adaptation to the environment around. These actions in favour of the ants to find food and survival. Researchers have proposed one-dimensional chaotic map to describe a single ant chaotic dynamics[8]. The ants chaotic dynamics, social organization and optimization theory are combined[9]. Researchers
615
Jia-Qing Zhong / Physics Procedia 33 (2012) 612 – 618
propose the theory based on swarm intelligence optimization methods, namely chaotic ant colony algorithm. The specific mathematical models are defined as follows:
yi (n)
yi n 1
1 ri
zid n 1
zid n e
1 e
ayi ( n )
7.5
Vi
3
d
d 7 .5 d
z id ( n 1) Vi
pid (n 1) zid (n 1) e Vi
(8) 2 ay i ( n ) b
7.5 d
1,2,
, N , N for the total number of ants n for current step, n 1 for previous step yi (n) for organization variables and yi (0) 0.999 ri for variable factor of the i th ant and
where, i
ri
(0,1)
n 1 step
d
, L ; L for dimension of
pid (n 1) for the best location that the i ant and its neighbors find in is a positive which decides the search scope of zid (n) a is a positive constants, th
optimization space good value for a
0 Vi
1,2,
zid (n) for d - dimensions state of the i th ant and d
200
b is a constant and 0 b
23
Vi to the i th ant search scope and
1.
In the chaotic ant colony algorithm, ri and
are two important parameter. ri influenced in
d
convergence speed. If ri is large, search process is too short and the convergence speed is too great, so it is difficult to find the best or sub-optimal solution convergence speed is too slow. If ri
on the contrary, if ri is too small and the
0 , the system will always be in chaos state, the search will not put
to the best or sub-optimal solution. Therefore, usually choose 0 scope.
ri
0.5
d
impacts the search
4. EXAMPLE RESEARCH OF ECONOMIC EVALUATION TO DISTRIBUTION NETWORK 4.1 The initial data of distribution network This paper analyses economic evaluation to 10 distribution network in Qinhuangdao area. Raw data is collected from distribution networks. The value of each evaluation index can be calculated by the software. The values are shown in Table.1. The first is discretization of the data. After calculating each quartile of all for evaluation index and getting the maximum, minimum, we use "low", "Slightly low", "Slightly high" and "high" to represent the values on the interval [minimum, the first quartile), [the first quarter median, the second quartile), [the second quartile, the third quartile), [the third quartile, maximum]. It’s shown in Table 2. Tab. 1 Data of distribution network evaluation indexes Load region /kw
Load rate /%
Power Factor
Proportion of high energy
Wire passing rate of cross-sectional
Transformer capacity accounted
Matching /%
Run /kw
Passing rate of bus
Power Supply Radius
Capacity -load ratio
616
Jia-Qing Zhong / Physics Procedia 33 (2012) 612 – 618
DN 1 DN 2 DN 3 DN 4 DN 5 DN 6 DN 7 DN 8 DN 9 DN 10
4128.59 4563.66 3560.98 2350.8 4236.75 3769.52 3985.12 2654.98 2867.55 2985.73
0.75 0.78 0.84 0.82 0.81 0.8 0.79 0.83 0.85 0.82
0.84 0.85 0.88 0.87 0.86 0.85 0.84 0.83 0.82 0.86
transformer /%
area /%
0.45 0.35 0.36 0.48 0.75 0.74 0.65 0.56 0.69 0.75
0.78 0.76 0.74 0.72 0.85 0.85 0.85 0.84 0.83 0.84
/%
0.46 0.36 0.38 0.49 0.77 0.78 0.68 0.59 0.71 0.78
0.84 0.85 0.88 0.87 0.86 0.85 0.84 0.83 0.82 0.86
312.46 397.22 285.95 401.40 313.25 355.72 597.64 566.41 427.83 388.17
voltage /%
/%
0.85 0.82 0.83 0.85 0.71 0.8 0.79 0.73 0.85 0.72
17 16 9 16 9 10 17 15 14 16
1.85 1.7 1.9 1.85 1.9 1.9 1.7 1.6 1.7 1.8
Power Supply Radius /%
Capacity -load ratio
*DN--Distribution Network Tab 2 Classification processing of evaluation index
Load region /kw
H DN 1 H DN 2 DN 3 SH L DN 4 DN 5 H DN 6 SH DN 7 SH L DN 8 L DN 9 DN 10 SL *H High
Load rate /%
Power Factor
L
SL SH
SL H
Proportion of high energy transformer /%
SL L L
SH SH SH SL
H H
SL
SH SH SL
H H H
H H
L L
SH H H
SH SH SH—Slightly High L
Wire passing rate of cross-sectional area /%
Transformer capacity accounted /%
SL SL
L L L
L L H H H H H H
Matching /%
Run /kw
SL SH
Low
SL
H H
H H H
SH SH SL
SH
L L
H H
SH
SL L
SL L L H H
SL SL
Passing rate of bus voltage /%
H H H H L
SH SH L H L
H H L H L L H H
SH H
H
SL H H H H
SL L
SL SH
Low SL—Slightly Low
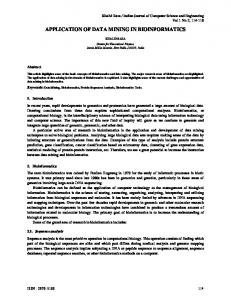
4.2 Data Mining and Analysis Each evaluation index to each distribution network and the link between distribution networks is represented as a graph, shown in Figure 4. The evaluation index is for the edge label. The value of distribution network under these index values is for the node label. The connection of distribution network is represented by the use of adjacent and nonadjacent. Substructure discovery algorithm is used for data mining. Because the distribution network indexes and the correlation between the distribution networks are expressed with a graph. Thus mining condition is expressed by a sub-structure. In Figure 4, choose one node at random and add edges according to inherent in the connected graph. The substructure is established. Mining conditions is shown in Figure 5(a) and the results is shown in Figure 5(b) below.
617
Jia-Qing Zhong / Physics Procedia 33 (2012) 612 – 618
Na m e
ate
Power Factor
r ad Lo
ply up r S ius weRad o P
Pow er Ra d S u p p ius ly
yaci t o Capad rati lo
yacit o Capad rati lo
Figure 4 The economic indexes and the neighboring relations of distribution network
H
L
DN
Power F a
ctor L
L (a) Mining condition (b) Mining result Figure 5 Mining condition and the result of mining
Concluding from Figure 5, the factors with line loss in distribution network includes the following more high-energy transformer, irrationality choice of wire cross-sectional area, too large reactive power flow on line. To address the above problems, we can propose measures to reduce distribution network energy loss: 1) Replacing of energy-efficient transformers. 2) Selecting conductor material, type or model matching transformer in transforming the power grid to make them consistent with the regional economic performance. 3) Optimizing capacitor switch in order to reduce losses. Different mining results can be obtained by changing the mining conditions. Thus we can find the relationship between indexes in various level and influence factors among distribution networks based on different mining conditions during the process of economic evaluation. The results of data mining plays a very important role to plan and reconstruction to distribution network.
618
Jia-Qing Zhong / Physics Procedia 33 (2012) 612 – 618
5. CONCLUSION In this paper, we research the economic evaluation problems of distribution network operation and establish a evaluation index system of distribution network. The evaluation index system is expressed with the map data. The substructure discovery algorithm is used to graph data mining based on different mining conditions, in order to find the relationship between indexes in various level and influence factors among distribution networks. At one time, particle swarm optimization algorithm is used during the mining process. Research and the example shows that, the establish of evaluation index is reasonable. The substructure discovery algorithm used to analyzing distribution network operation economy is correct. Moreover particle swarm optimization can ensure global optimization and convergence rapidly.
Acknowledgment This research was supported by the Natural Science Foundation of Hebei(No.
).
REFERENCES [1] Junmin Zhang, Tinghua Huang, Hongqang Zhang. The reactive Power Optimization of Distribution Network Based on an Improved Genetic Algorithm. Proceedings of the IEEE Power Engineering Society Transmission and Distribution Conference, Dalian, China,2005,8:1-4 [2] Brown R E. Network Reconfiguration for Improving Reliability in Distribution Systems. Power Engineering Society General Meeting of IEEE, Toronto, Canada,2003,4:2419-2424 [3] Zhang Baohui, Wang Liyong, Tan Lunnong. Resarch of power system security and reliability considering risk under environment of electricity market(in Chinese). Power System Technology,2005,29(3):44-49. [4] Yang Jingyan, Xie Fang, MaXin. Practical technology of reliability evaluation of big transmission systems(in Chinese). Power system and the automation transaction,2000,12(4):23-27 [5] Chowdhury A, Koval O. Application of customer interruption costs in transmission network reliabillty planning. IEEE Trans on Industry Applications,2001,37(6):1590-1596. [6] Su xin, Tang wei, Index system of rural electric network performance assessment(in Chinese). Journal of Shenyang Agricultural University. 2005,36(6):721-723 [7] Chang Xingong , Kou jisong, Li minqiang. A substructure discovery based intermix EA(in Chinese). Journal of System Simulation,2008,20(6): 1626-1629 [8] Chen jie, Panfeng, Wang guanghui. Review of the PSO research in dynamic environments(in Chinese). CAAI Transactions on Intelligent Systems, 2009,4(3):189-198 [9] Guo P, Wang X, Kang Y. Frequent mining of subgraph structure. Journal of Experimental & Theoretical Artificial Intelligence,2006,18(4):513-512 [10] Cook D J, Holder L B. Substructure discovery using minimum description length and background knowledge. J. Artif.Intell.Res.,1994,2:231-255 [11] Bandyopadhyay S, Maulik U, Cook D J, et al. Enhancing structure discovery for data mining in graphical databases using evolutionary programming. Proceeding of the Florida Artificial Intelligence Research Symposium,2002:232-236 [12] Cook D J, Holder L B. Graph-based data mining. IEEE Intelligent Systems,2000,15(2):32-53 [13] Wang Yang, Liu Xiaodong, Xu Xiaohui, et al. Particle Swarm Optimization for Data Classification(in Chinese). Journal of System Simulation,2008,20(22):6158-6162