363
L. Luan et al., J. Near Infrared Spectrosc. 24, 363–372 (2016) Received: 13 December 2015 ■ Revised: 12 June 2016 ■ Accepted: 20 July 2016 ■ Publication: 26 July 2016
JOURNAL OF NEAR INFRARED SPECTROSCOPY
Application of multiple classifier fusion in the discriminant analysis of near infrared spectroscopy for agricultural products Lili Luan,a Yuheng Wang,a Xueying Li,a Wenyan Hu,a Kai Li,a Junhui Li,a* Kai Yang,b Ruxin Shu,b Longlian Zhaoa and Cailian Laoa a
Department of Electronic Engineering, China Agricultural University, Beijing, China. E-mail:
[email protected]
b
Technology Center of Shanghai Tobacco (Group) Corporation, Shanghai, China Near infrared spectroscopy combined with chemometrics and pattern recognition has become a primary focus in the discriminant analysis of agricultural products. To date, most studies have focused on using a single classifier to discriminate the origins, varieties and grades of products. Others have focused on using multiple classifier fusion by weighted voting. Due to their attributes of continuity and internal similarity, discriminant models sometimes present poor performance. In this study, we achieved better performance by applying multiple classifier fusion models, including support vector machine (SVM), discriminant partial least squares (DPLS) and principal component and Fisher criterion (PPF). PPF showed continuity and similarity among different parts of tobacco leaves [i.e. upper (B), cutter(C) and lug (X)]. The similarities between each class and the others were quantified to values, and the sum of the similarity values of each class was defined as its similarity. SVM–DPLS–PPF fusion by voting and similarity constraint for decision resulted in better performance, with the correct discriminant rate improved on average by 14.1%, 8.2%, 17.3% and 4.6% compared with those achieved using SVM, DPLS, PPF and SVM–DPLS–PPF fusion by weighted voting for decision, respectively; in addition, the incorrect discriminant rate between B and X was reduced to zero. Therefore, we demonstrated the feasibility of using SVM–DPLS–PPF fusion by voting and similarity constraint for decision to discriminate between different parts of tobacco leaves. This technique could provide a new method for tobacco quality management, computer-aided grading and intelligent acquisition. It also provides a new discriminant method for analysing the attributes of continuity and similarity of agricultural products using near infrared spectroscopy.
Keywords: near infrared spectroscopy, discriminant analysis, multiple classifier fusion, similarity analysis
Introduction Near infrared (NIR) spectroscopy is a highly efficient, modern analysis method with the benefits of fast analysis speed, low cost, non-destructive testing, no pollution, simple pretreatment methods and multicomponent online analysis.1,2 It has been extensively applied to areas such as ecology, agriculture, food science, biology, chemistry, medicine and many other fields.3–8 In recent years, discriminant analysis of the near infrared spectrum has been demonstrated to have ISSN: 0967-0335 doi: 10.1255/jnirs.1236
broad application prospects in agricultural product classification,9,10 geographical origin discrimination and quality testing. However, the broad peaks and bands in near infrared spectra overlap, making difficult the resolution of the fine structure of compounds.11 Consequently, chemometric methods must be used to extract and analyse the faint chemical information.12 To date, most studies on NIR discriminant analysis have been focused on a single classifier. Marques et al.13 discriminated © IM Publications LLP 2016 All rights reserved
364
Multiple Classifier Fusion in Discriminant Analysis for Agricultural Products
Table 1. The standard of differentiating different parts of tobacco leaves on the stalk.
Group
Characteristics of different parts Veins
Colour
Shape of leaf
Body
Lug (X)
Thin
Broad and round
Thin to less thin
Lemon
Cutter (C)
Moderate; leaf apex is slightly curved
Broad; leaf apex is short and broader
Less thin to medium
Orange
Upper (B)
Thick and obvious
Broad; leaf apex is long and thinner
Medium to heavy
Orange and red
Pseudomonas aeruginosa strains in clinical samples by NIR spectroscopy and variable selection techniques. Galtier et al.14 compared PLS-DA and SIMCA for classification of the geographical origin of crude petroleum oils by mid-infrared spectroscopy and virgin olive oils by NIR spectroscopy. When the number of modelling samples is limited or if a large error exists in the prediction results, the prediction precision and stability of a single model suffer.15 And in these circumstances, multiple classifier fusion has attracted increasing attention. Many theories and experimental studies have shown that multiple classifier fusion has obvious advantages over single classifier techniques.16–18 Campos et al.19 studied multiple classifier combination approaches of different local feature combiners for the purpose of robot visual localisation. Bigdeli et al.20 presented the fusion of hyperspectral and LIDAR (light detection and ranging) data using a decisiontemplate-based fuzzy multiple classifier system to improve classification accuracy. Özkan et al.21 improved the correct differentiation rate of plastic wastes based on recycling labels to 90% by majority voting. Thus, multiple classifier fusion has provided improved performance by avoiding the one-sidedness of a single classifier. Because of the attributes of continuity and internal similarity of agricultural products, discriminant models exhibit poor performance for discriminating the origins, varieties and grades of these products.22,23 In this study, we improved the correct discrimination rate by applying multiple classifier fusion including principal component and Fisher criterion (PPF), support vector machine (SVM) and discriminant partial least squares (DPLS). We demonstrated the feasibility of using multiple classifier fusion to discriminate between different parts of tobacco leaves [i.e. upper (B), cutter (C) and lug (X)]. Different parts of a tobacco leaf have different physical properties, different chemical qualities and different smoking qualities. Hence, different parts are important for tobacco blend and quality management. SVM–DPLS–PPF fusion by voting and similarity constraint for decision exhibited better performance than SVM, DPLS, PPF, or SVM–DPLS–PPF fusion by weighted voting for decision, and its incorrect discriminant rate between B and X was reduced to zero. This technique could provide a new method for tobacco quality management, computer-aided grading and intelligent acquisition. It also provides a new discriminant method to analyse the attributes of continuity and similarity of agricultural products using NIR spectroscopy.
Experimental
Experimental samples
Samples of flue-cured tobacco leaves were acquired in the years 2012 and 2013 from the Anhui, Fujian, Guizhou, Henan, Heilongjiang, Hubei, Hunan, Jilin, Jiangxi, Liaoning, Inner Mongolia, Shandong, Shanxi, Sichuan, Yunnan and Chongqing provinces in China. The numbers of samples of the three parts (B, C, X) were 131, 171 and 101, respectively, for a total of 403. Due to the different chemical composition among different parts of tobacco leaves on the stalk, the physical characteristics are different. The standard for differentiating different parts of tobacco leaves issued by the CSBTS24 is shown in Table 1, and the numbers of different parts of the tobacco leaves collected from different provinces of China are shown in Table 2. According to the proportion of the three parts (B, C, X) of leaves from different provinces in Table 2, a modelling set and a validation set of samples were selected so that each set contained information from each province. For the modelling Table 2. Distribution of different parts of tobacco leaves from variousprovinces of China.
Province
Upper (B)
Cutter (C)
Lug (X)
Anhui
3
7
3
Fujian
5
5
5
Guizhou
16
26
10
Henan
22
22
16
Heilongjiang
3
8
4
Hubei
2
3
2
Hunan
10
16
7
Jilin
2
2
2
Jiangxi
2
2
2
Liaoning
4
9
3
Inner Mongolia
3
4
2
Shandong
11
11
19
Shanxi
5
6
3
Sichuan
12
17
7
Yunnan
29
31
23
Chongqing
2
2
3
L. Luan et al., J. Near Infrared Spectrosc. 24, 363–372 (2016) 365
set, 75% of the available samples (approximately 293 samples) were randomly selected, including 91 B, 131 C and 71 X. The other 110 samples, which included 40 B, 40 C and 30 X, were used as the validation set, and it contains regional information as much as possible. The modelling set and validation set of samples were selected two times by approximately three to one.
Experimental equipment and test method The experimental equipment used was a Nexus Fourier transform NIR spectrometer (Antaris II, Thermo Nicolet Corp., Madison, WI, USA), which was operated in spectral scanning mode and was equipped with a diffuse integrating sphere. The samples were scanned over the wavelength range from 10,000 cm−1 to 4000 cm−1 at a spectral resolution of 8 cm−1; 64 scans were collected for each spectrum. Leaf tobacco was ground into powder, and passed through a 60 mesh sieve (250µm). The water content of tobacco leaves differed in a wide range, from less than about 10% to 13.5%. This will adversely affect analysis results. If we want to remove water completely, dozens hours would be needed. In order to improve efficiency and realise fast analysis, we baked them for 30 min in an oven at 45°C under an atmosphere with controlled water content of 10% or less. For each sample, approximately 15 g of tobacco powder was placed in an experimental sample cup for collection of its NIR spectrum. Nicotine is one of the main chemical components of tobacco leaves. It was determined using a continuous flow method, according to the YC/T 160-2002 (China tobacco industry standard), and the equipment was an AA3 continuous flow analytical system (Bran Luebbe Corp., Hamburg, Germany).
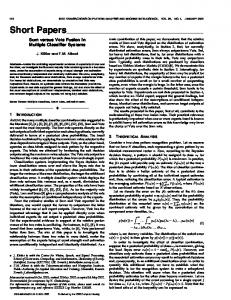
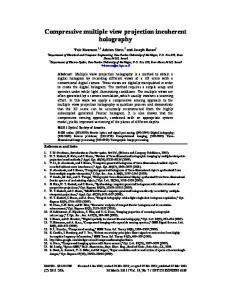
NIR spectra of different parts of tobacco leaf Figure 1 shows the NIR spectra of the tobacco leaves in the range from 10,000 cm−1 to 4000 cm−1. Figure 2 shows average NIR spectra of the three parts (B, C and X). In Figure 1, NIR spectra of region 3 divided into two groups. This is attributed mainly to our baking method. According to environmental factors, in China, the water content of southern tobacco leaves is higher than that of leaves from northern
Figure 1. NIR spectra (10,000 cm−1 to 4000 cm−1) of 403 lug, cutter and upper tobacco leaf samples. The six regions of the spectra are referred to in the text.
Figure 2. Average NIR spectra of three parts of tobacco leaves: B, upper; C, cutter; X, lug.
provinces, but even after baking them the differences still existed. We could use classification methods to reduce the effect of water contents, to a range under 10%. According to the information distribution region in the NIR spectra11,25 in Figure 1, region 1 is mainly absorbance of C–H combination frequency and H2O; region 2 is mainly absorbance of N–H combination frequency; region 3 is mainly absorbance of O–H combination frequency and H2O; region 4 is mainly absorbance of C–H first overtone; region 5 is mainly absorbance of O–H first overtone and H2O; region 6 is mainly absorbance of higher frequencies. Because of the different contents of carbohydrates and nitrogenous substances among different parts of a tobacco leaf, in NIR spectra absorption signals of C–H, N–H and O–H groups are different. This shows the spectral and chemical basis for the classification of different parts of a tobacco leaf. In Figure 2, the absorbance declined in the order B > C > X, which further indicated the feasibility of using NIR spectra to discriminate these three parts of tobacco leaves. Figure 2 shows the absorbance of B, C and X all reduced across the range from 10,000 cm−1 to 4000 cm−1, and there was no overlap, so we chose to utilise all the spectral data. However, because the absorption signal of higher frequencies was weak from 10,000 cm−1 to 8000 cm−1 we also chose the range from 8000 cm−1 to 4000 cm−1. We have verified that the analysis results are extremely close using either range. In this paper, spectra of 403 samples were collected in two years. Due to the change of instrument state and environmental factors, the original spectra were processed by using first derivative and Savitzky–Golay smoothing with 15 points to reduce systematic deviations and random errors.11,26 As shown in Figures 1 and 2, the absorbance range of the 403 NIR spectra varied from 0.26 to 0.95, and for average NIR spectra from 0.28 to 0.74. In region 3, the absorbance of the 403 NIR spectra varied between 0.34 and 0.74, and that of the average NIR spectra from 0.44 to 0.52. This indicates there was overlapping of absorption peaks among the three parts of tobacco leaves of 403 NIR spectra. The continuity and similarity among the different parts are analysed below. And we improved the correct discrimination rate by applying multiple classifier fusion.
366
Multiple Classifier Fusion in Discriminant Analysis for Agricultural Products
Methods
Support vector machine
SVM is a relatively new type of NIR pattern recognition technology. 27 On the basis of Vapnik–Chervonenkis statistical learning theory and structural risk minimisation theory, the optimal segmentation hyperplane is established in highdimensional feature space to make the distance among different data points maximum, i.e. to differentiate between different classes as much as possible. For linear inseparable samples, SVM can map the non-linearity into a highdimensional feature space so that it is linearly separable. Thus, analysis of non-linear samples is possible using a linear classifier.28 For finding out the optimal margin classifier, the following optimisation problem is defined:29 the minimisation of a( W ) =
2 1 W 2
(1)
subject to y i êé(w ⋅ x i ) + búù -1³ 0; i = 1,,n; w Î RN ; b Î R ë û
(2) where the vector w defines the boundary and x is the input vector of dimension; N and b are scalar thresholds. When the Lagrangian is constructed for the optimisation problem, then the following expression is obtained:
n 1 L(w,b, a) = (w ⋅ w) - å ai y i éê(w ´ x i ) + bùú -1 ë û 2 i =1
{
}
(3)
The optimal classification function is as follows:
én ù f (x) = sgn ê å ai y i (x i ⋅ x) + bú êë i =1 úû
(4)
where non-zero vector ai is a support vector. For solving the non-linear case, SVMs map the N-dimensional input vector into a higher feature space. By choosing a non-linear mapping function j(x) the SVM can construct an optimal hyperplane in new feature space. k(x, xi) is an inner product kernel performing the non-linear mapping into feature space and is expressed as
k (x, x i ) = j (x)j (x i )
(5)
The radial basis function (RBF) K is calculated as follows:30
æ x-x ç i k(x, x i ) = expçççè 2s 2
ö÷ ÷÷ ÷÷ ø
(6)
where s denotes the width of the RBF kernel. After solving the optimisation problem, the SVM classifier is also as follows:
én ù f (x) = sgn ê å a*i y i (x i ⋅ x) + b* ú ëê i =1 ûú
(7)
The SVM classifiers described above are binary classifiers, and by combining them it is possible to handle multiclass cases. For solving the multiclass problem, one-against-one (OAO) methods are addressed in this paper. In OAO methods,
if k is the number of classes then k(k – 1)/2 classifiers are constructed and each one trains data from two classes. OAO is a competitive method for multiclass classification.31 Here the LIBSVM software package (Lin Chih-Jen, Taiwan University) has been used for multiclass classification bearing with OAO. In this paper, SVM classifier is realised based on MATLAB (R2010b, MathWorks Inc., Natick, MD, USA).
Discriminant partial least squares analysis DPLS was born of the partial least squares (PLS) analysis that is a bilinear model based on an X matrix (explanatory variable) and a Y matrix (response variable).32 It is aimed at maximising the covariance with the Y matrix by modifying the latent variable direction of the X matrix. Although PLS is primarily regarded as a calibration method, it is also used for solving discrimination problems.33 The PLS model can be presented as
X = TP + E (8)
Y = UC + F (9)
where matrix T contains the so-called X-factor scores, U are the Y-factor scores, P are the X-factor loadings and C are the Y-factor loadings. The regression coefficients that relate X and Y are obtained by
U = TB + Ed U (10)
B = W(PTW)-1CT (11)
where matrix W contains the so-called X-factor weights, i.e. the projections of the objects of the X-space onto Y-factor scores, and Ed are random error. In DPLS analysis, Y is replaced by a class variable. Using the binary system to determine the class to which a sample belongs, a standard is set where “1” denotes belonging to this class and “0” denotes not. When there are three classes, Y is as follows: A: 1 0 0 B: 0 1 0 C: 0 0 1 However, the predicted value is often close to 0 or 1, rather than exactly 0 or 1.34 In general, it can be set to a threshold to discriminate between classes by comparing the relation between predicted values and the threshold value.35
Projection based on principal component and Fisher discriminant analysis The PPF projection classifier is a method that combines principal component analysis with Fisher discriminant analysis.36,37 Spectral matrix X has been reduced to x by a dimension reduction technique called principal component analysis. Then, x is projected though Fisher discrimination. It searches for the projection directions on which the data points of different
L. Luan et al., J. Near Infrared Spectrosc. 24, 363–372 (2016) 367
classes are separated as far as possible while the data points of the same class are kept to be close to each other. Sample mean for Class i, x �i, is expressed as
xi =
1 å xÎci x ni
(12)
The within-class scatter matrix for Class i can be calculated by T
Si = å xÎci (x - x i )(x - x i ) Then the within-class scatter matrix for all classes is C
S w = å Si
i=1
(13)
(14)
where C is the numbers of classes. The between-class scatter matrix is calculated as T
(15) Sb = å xÎci ni ( xi - x)( xi - x) where ni is the number of observations in Class i and x �i is the total mean vector for all samples. The Fisher discriminant analysis components are determined by maximising the Fisher criterion, i.e. the ratio of the between-class scatter to the within-class scatter:
J (W) = max
W T SbW
W TSw W
(16)
where the vector W is the Fisher optimal discriminant direction. It is easy to show that a vector W that maximises J(W) is equal to calculating the generalised eigenvectors of the eigenvalue problem:
(17)
SbW = mSw W
where the eigenvalue µ indicates the degree of overall separability among the classes, i.e. µ is the projection value. The PPF method maximises the between-class distance and minimises the within-class distance. Not only can this method discriminate between classes, but it also reflects the similarity between classes.38 The level of projection mean within-class scatters for Class i (Dii) can be calculated by 2
Dii = 2 å (x i - xi )
(18)
The Euclidean distance of the projection mean between-class (Dij) is calculated as 2
Dij =
å Nk (x ik - x jk ) N
(19)
where N is the number of dimensions. The between-class similarity is quantified as
Sij = 1-
Dij Dii + D jj
SVM–DPLS–PPF fusion by voting and similarity constraint for decision The decision of multiple classifiers is based on odd numbers of single classifier voting with the majority rule.39 A classification result for each single classifier is recorded as a vote, and the classifier that receives the most votes is selected as the final classification result.40,41 In cases where none of the classification results are the same (1:1:1), Campos et al.19 and Özkan et al.21 resolved this issue by weight voting. Combining the similarity analysis results for different classes using PPF, we obtained the solution by voting and similarity constraint for decision. The specific implementation process is as follows: 1. The optimal models of PPF, DPLS and SVM are built to discriminate between the classes of each sample. 2. According to the similarity value (Sij) among classes by formula (20) in PPF, the sum of the similarity values of each class (SSVC) measures its similarity, i.e. SSVC can be subjected to the probability of one class is discriminated to others. The class for which SSVC has the largest value can be determined. 3. The classification result for each sample from step 1 is comprehensively discriminated by voting. When the discrimination result is 3:0 or 2:1, the classification of each sample is decided on the basis of the highest vote count. 4. When the result is 1:1:1, the samples are classified as the class determined in step 2. In this case, the model makes the fewest mistakes. Because SSVC is the largest, the probability of the corresponding class is discriminated to others is the highest. When the result is 1:1:1, the samples are classified as the class whose SSVC is largest to reduce the mistakes. 5. The discrimination results of steps 3 and 4 are composited to achieve the final classification of all of the samples. In this study, the SSVC of C was the greatest. Therefore, when the result for a sample was 1:1:1, it was classified as C.
Objectives of the model (20)
The projection of PPF is circle. In the PPF two-dimensional projection, the centre of each circle represents the projection mean within-class, the distance between two circles represents Dij and the radius represents Dii. When Sij = 0, one circle is tangent to the other. When Sij = 1, the two circles completely overlap each other, which denotes that they are the same. When Sij