Progress In Electromagnetics Research B, Vol. 56, 365–385, 2013
APPLICATION OF NEGATIVE SELECTION ALGORITHM IN SMART ANTENNA SYSTEM FOR LTE COMMUNICATION Abdul K. Evizal1, * , Tharek A. Rahman1 , Sharul K. A. Rahim1 , Sri L. Rosa2 , and Alishir Moradikordalivand1 1 Wireless
Communication Centre (WCC), Faculty of Electrical Engineering, Universiti Teknologi Malaysia, UTM Skudai, Johor 81310, Malaysia 2 Soft
Computing Research Group, Faculty of Computing, Universiti Teknologi Malaysia, UTM Skudai, Johor 81310, Malaysia Abstract—Interference and multipath is one of the current issues in a wireless communication system, with complicated scenarios of environment especially in urban areas with a high number of users. Introducing smart antenna systems at the base station can contribute to reducing interference and improve quality of service. This paper proposes and explores the application of artificial immune system and negative selection algorithm to the prototype of smart antenna, where the proposed smart antenna is a hexagonal structure with 6-elements of the antenna array and working in LTE band at 2.6 GHz. Initial testing was done to define the RSSI value by calculating the average of the signal then comparing RSSI value defined by implementing artificial immune algorithm. To proof and determine actual RSSI signal received, a test in an anechoic chamber is conducted as reference that assumes free interference and multipath then compared to both of results. X-Bee module was used for transmitter and receiver in system at 2.4 GHz band, and the proposed system prototype with hexagonal structure also used dual ARM microprocessor. Negative selection algorithm is applied in smart antenna programming to define actual values of receiving signal and angle of arrival. Every beam of the antenna was installed with an X-Bee module then connected to microprocessors, with an LED installed at each of the antenna as an indicator of beam switching or angle of arrival signal. Received 9 September 2013, Accepted 6 November 2013, Scheduled 13 November 2013 * Corresponding author: Abdul Kadir Evizal (
[email protected]).
366
Evizal et al.
1. INTRODUCTION Long Term Evolution (LTE) is a standard of high-speed data network, as radio platform technology that will allow user to access with higher peak throughputs. Currently, most of mobile terminal accessing is in a standard called High Speed Packet Access (HSPA) evolution and (HSPA+) in higher spectrum bandwidth. LTE is part of the evolutionary of wireless mobile technology, started with Global System for Mobile Communication (GSM) standard for mobile broadband, following by Enhanced Data Rates for GSM Evolution (EDGE), Universal Mobile Telecommunications System (UMTS) or Wideband Code Division Multiple Access (WCDMA), HSPA combined High Speed Downlink Packet Access (HSDPA) and High Speed Uplink Packet Access (HSUPA) and HSPA Evolution (HSPA+). Although HSPA+ is currently strongly positioned in its evolution and is dominant in wireless data networks or mobile data technology for the next years or decades, the 3rd Generation Partnership Project (3GPP) family of standards must evolve toward the future [1]. The main objective of LTE network evolution is to improve coverage area, data rates, user capacity and reducing latency to further improve service provisioning. In order to achieve that objective, some methods are proposed, and one of them is introducing smart antenna. A smart antenna system, expected to cater and improve efficiency of transmitter, increases data rates, then reduces interference. Previous discussion on smart antenna is adaptive beamforming based on eigen-space and hybrid beamforming [2, 3]. A comparison for smart antenna as disused in [4] used particle swarm optimization technique, and another article used LMS (least mean square) algorithm to estimate DOA (direction of arrival) for GPS (global positioning system) application [5, 6]. Since smart antenna system is related to the signal processing and controlling system for the beam switching and beamforming, and selection of microcontroller and digital signal processing is important to obtain accurate result. Algorithm is a part of signal processing in smart antenna, and selection of algorithm is a parameter to verify accuracy in decision of arrival signal (angle of arrival) then beam switching [7, 8]. Currently, many researches propose to use common smart antenna system algorithm, such as LMS (Least Mean Square), MUSIC (Multiple Signal Classification) algorithm of ESPRIT (Estimation of Signal Parameters via Rotational Invariance Technique) or combination of them [9, 10]. Another technique is the use of NN (Neural Networks) algorithm to determine AoA (Angle of Arrival) in a smart antenna system as reported in [11]. Adaptive blind beamforming algorithm
Progress In Electromagnetics Research B, Vol. 56, 2013
367
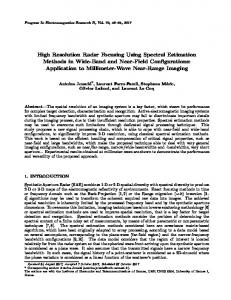
on array smart antenna system using LMS algorithm then simulation using simulink, smoothes wireless signal handoff decision algorithm as reported in [12] is applied to wireless sensor network. This paper proposes and explores applicable artificial immune system algorithm to the adaptive array smart antenna system, where negative selection algorithm is chosen and adopted in arriving signal processing algorithm then a decision is defined for the antenna beam selection switching. 2. ARTIFICIAL IMMUNE SYSTEM Artificial immune systems (AIS) are an adaptive system, inspired by theoretical immunology and observed immune functions, principles and models, which are applied to problem solving [13]. The field of artificial immune systems is concerned with abstracting the structure and function of the immune system to computational systems and investigating the application of these systems towards solving computational problems from mathematics, engineering, and information technology. AIS is a sub-field of biologically-inspired computing and natural computation, with interests in machine learning and belonging to the broader field of artificial intelligence [14]. Artificial immune systems have been recognized as an area of computer science and engineering, which uses immune system metaphors for the creation of novel solutions to problems. It is the majority view that the area of AIS is much wider and not confined to the development of new algorithms. Figure 1 shows a basic concept of biological immune system. Figure 1(a) shows antibody and antigen with paratope, epitope and idiotope, and Figure 1(b) shows an example of structure biological antibody.
(a)
(b)
Figure 1. Basic concept of biological immune system. (a) Antibody and antigen with paratope, epitope and idiotope. (b) Antibody — antigen recognition and binding.
368
Evizal et al.
Biological immune system in computer systems serves as inspirations for a variety of computationally based learning systems (e.g., artificial neural networks and genetic algorithms). The immune system is composed of several different layers of physical, physiological, innate (non-adaptive) and adaptive defence. The adaptive defence mechanism is sometimes referred to as acquired one. Any activity of the immune system against a pathogen is known as an immune response, and the most basic defence mechanism is the skin, which serves as a physical barrier to many pathogens, and for pathogens that elude the skin barrier, there are physiological barriers. The negative selection algorithm (NSA) is one of the most widely used techniques in the field of artificial immune systems. NSA used to detect changes in data behavior and patterns of raw data, by generating detectors in the complementary space. Originally detectors are applied directly to classify new data as self (normal) or nonself (abnormal). Previous research in [15] proposed a real valued negative selection (RNSA) algorithm based on heuristics that try to distribute the detectors in the non-self-space in order to maximize the coverage. The method used a real-valued algorithm representation for the self/non-self-space that differs from the binary representation used in original negative selection algorithms. RNSA with higher-level representation is able to provide some advantages such as increased expressiveness, the possibility of extracting high-level knowledge from the generated detectors and in some cases improved scalability. The real algorithm does not need to convert raw data to other scales or binary representation. It uses real data value to process and match to a detector generated by using minimum distance [16]. Minimum distance valued is set according to the high and low data received from the system. 3. ADAPTIVE ARRAY SMART ANTENNA Smart antenna is an antenna array with a control system and digital signal processing for advanced and intelligent controller. A smart antenna system is a method used in wireless communications to locate mobile device (user) which is capable of directing its beam radiation to a particular user or direction. Nowadays, smart antenna technology with improvement in designing offers a significant solution to overcome some issues such as interference levels, improve system capacity and efficiency. In this technology, every signal comes from users or mobile devices is transmitted and received by the base station only in the direction of that particular user. This method of transmission and reception is called beam forming and is made possible through smart
Progress In Electromagnetics Research B, Vol. 56, 2013
369
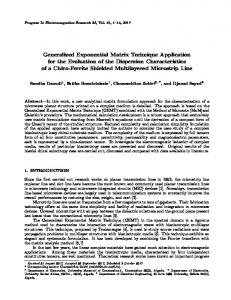
(advanced) signal processing at the baseband. There are two types of smart antenna commonly used, which are switching beam smart antenna and adaptive array (more intelligent). Switch beam or switch lobe is the simplest one, comprises only a basic switching function between separate directive antennas or predefined beams of an array and the setting that gives the best chosen performance. Adaptive array is an antenna system complete with directional arrival signal algorithm for determining the direction toward interference sources, and the radiation pattern can then be adjusted to null out the interferers. Figure 2 shows a basic concept of two different smart antenna systems. Figure 2(a) shows an antenna consisting of a multiple fixed beam that can be switched to desired particular beam controlled by system, and Figure 2(b) shows an adaptive array antenna that is a more intelligent system. Both of systems have the same objective which is to forward the beam of antenna to a desired user, but adaptive array is a more efficient and effective system because of suppressing unwanted beam. Active Beam Target User
Antenna Array Antenna Array Interfering User
(a)
Figure 2. Basic concept of smart antenna. (b) Adaptive array.
(b)
(a) Switch beam.
In the smart antenna system, angle of arrival (AOA), also known as direction of arrival (DOA), is one of the factors determining the accuracy of calculating received signal from the mobile station. A few techniques and algorithms calculate and estimate the AOA signal from the mobile device. Figure 3 shows a received signal arriving from N directions, N number of angles of arrival, and number of received signals by an array antenna of M elements with M potential weights. All parameters (additive, zero mean, Gaussian noise) will be calculated. The number of times is represented by the kth sample of time, thus a summary of array output antenna of y(k) can be written
370
Evizal et al.
Figure 3. M -number of array antennas with signal arrival. as in the formula below: y (k) = w−T · x ¯(k) where,
(1)
s1 (k) s2 (k) ¯ (k) x ¯ (k) = [¯ a (θ1 ) a ¯ (θ2 ) . . . a ¯ (θN )] · ... + n sN (k) ¯ = A · s¯ (k) + n ¯ (k)
(2)
and w ¯ = [w1 w2 , . . . , wM ]T = weight of array antenna. s¯(k) = vector of incident complex monochromatic signal at time k. n ¯ (k) = noise vector at each array element m, zero mean, variance σn 2 . a ¯(θi ) = M -element array steering vector for the θi direction of arrival. A¯ = [¯ a(θ1 ) a ¯(θ2 ) . . . a ¯(θN )] M ×D matrix of steering vector a ¯(θi ). Number of radiation patterns of a typical element antenna array can be changed or designed by determining the number of antennas installed. Higher number of an array’s elements of the antenna will obtain a narrower beam radiation pattern, and complexity of signal processing is required because more elements’ beams of the antenna need to be calculated. Similarly, by changing the relative phase
Progress In Electromagnetics Research B, Vol. 56, 2013
371
excitation, the orientation of radiation pattern will be changed. Each of the N -complex signals arrivals from various angles θi and is intercepted by others of the M antenna elements, and the number of arriving signals, N , is normally less than the number of array antennas M . Equation (1) represents summary of signal arriving from M element of the antenna and Equation (2) represents the number of x¯(k) element antennas, where the vector of arrival signal at time k to number of M element angles of arrival antenna. The number of M -element steering vectors contains the response of all elements of the array antenna to a narrow-band source of power received. As the response of the array antenna has different directions between angles of signal arrival, a steering vector is associated with each directional source [17]. 4. ANTENNA DESIGN AND PROTOTYPE This paper proposes a smart antenna system designed by implementation of smart algorithm which adopts and explores the capability of the artificial immune system. The proposed antenna system is designed with a prototype, then some measurement is carry out as well as testing in the actual field, and this method is to check the performance of the proposed antenna. A few scenarios and possibilities are under consideration to make sure the proposed system applicable to various models and type of environment. A prototype of mobile user is also developed with simulation of actual mobile user. In this case an X-Bee module with microcontroller is used as the user and keeps sending data packet to receiver through the proposed smart antenna system. 4.1. Initial Design of Smart Antenna The design of the prototype of an adaptive smart antenna started by designing each single element of array antenna. The proposed frequency band in this antenna is LTE band 2.6 GHz, and the design achieves wide band that covers 2.4 GHz ISM band for Wireless Local Area Network (WLAN) thus the prototype of a smart antenna system designed in this frequency for the transmitter and receiver is used in the system. The basic design of single array antenna is a microstrip type [18], where using inexpensive material available in the market, the proposed antenna is fabricated using FR4 material with a relative permittivity of εr = 4.7, height h = 1.6 mm and tan δ = 0.019. Figure 4 shows fabrication of a single element of array antenna with directional direction, and beam width is 60 degrees. Initial measurement has been done in antenna reflection coefficient
372
Figure 4. Single element of array antenna.
Evizal et al.
Figure 5. Reflection coefficient of single element antenna.
and response of operating frequency. The proposed antenna has multiple bands starting from as low as 500 MHz to 6 GHz. Figure 5 shows the response of the antenna and also shows that results between simulation and measurement have a good agreement in response. Simulation and measurement results have multiple responses as shown in Figure 5. The main response is at frequency 2.6 GHz with maximum reflection coefficient at −30.5 dB, and other responses are 900 MHz, 1.7 GHz to 2.7 GHz and 3.5 GHz. Response at 2.0 GHz is wideband that covers GSM 1800 and UMTS 2000 bands. 2.4 GHz is also included for WLAN application, and another is at 3.5 GHz that covers WiMAX. While measured result is indicated by the black line in Figure 5, the main response of the reflection coefficient is at frequency 2.6 GHz the same as simulation result with maximum values, which is −26 dB. Other responses are scattered to some frequencies started from 900 MHz to 3.5 GHz as shows in Figure 5. Overall, the proposed antenna has wideband response of reflection coefficient applicable to many types of wireless technology. Radiation pattern measurement of the proposed antenna has been done at the center frequency of 2.6 GHz as the main response in reflection coefficient. Figure 6 shows the radiation pattern of the antenna, where Figure 6(a) and Figure 6(b) show the polar radiation patterns of E-field and H-field of the proposed antenna, respectively, where the directional beam is generated for the E-field at the front antenna and minor radiation at the back. Simulation and measurement results give good agreement in their responses, in spite of minor radiation change. The proposed LTE antenna is able to radiate narrow beams toward antenna direction with narrow beam and minor side lobe on left- and right-hand sides
Progress In Electromagnetics Research B, Vol. 56, 2013 0
0 30
0
30
330
-10
-20
300
-20
-20
-30
-30
-40 -30 -40 -30
270 -20
-10
0
90
0
-10
-20
270 -20
-10
0
-20
-20 240
120
240
120 -10
-10
Measurement Simulation
0
-40 -30 -40 -30 -30
-30
150
330
60
300
0
0 -10
-10 60
90
373
Measurement Simulation
210
150
0
180
180
(a)
(b)
210
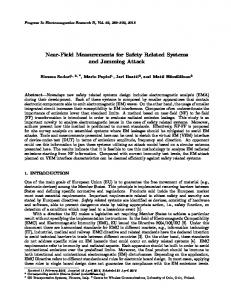
Figure 6. Simulated and measured radiation pattern of proposed antenna. (a) E-field. (b) H-field. 4.2. Proposed Hexagonal Prototype The propose prototype of the adaptive array smart antenna has a hexagon structure, with six directional beams of antenna. As shown in Figure 6, each antenna covered 60 degrees, then six beams covered in all directions. Figure 7 shows the proposed smart antenna system. Figure 7(a) shows the proposed hexagonal structure, and Figure 7(b) shows fabricated proposed antenna. The hexagonal structure of the antenna is designed by combining all elements of the array antenna than an omnidirectional with spatially beams of direction. Every beam of a single antenna will receive wireless signal from the mobile device (user) in different values. Each beam of antenna is assumed to have different values depending on the angle and location of the user, and the nearest user to the beam has high values compared to the other beams of the antenna. An LED was installed for every beam of antenna as indicator that received signal comes from that direction, and microcontroller will switch the beam of the antenna toward a particular direction. Each beam of the antenna is attached to the X-Bee module as receiver, which is to detect and define signal strength received from mobile devices. Every module of X-Bee is connected to the microprocessor, and received signal strength value of each beam is indicated. After that all process of received signal is done by microprocessor. Figure 8 shows a design of smart antenna system.
374
Evizal et al.
ee X-Bodule M
A
X-Bee Module
nn nte
a-1
An ten n
X Mo -Bee du le
a-3
An
X-Bee Module
-6 na ten An ee X-Bodule M
ten na -4 X-B Mo ee du le
Antenna-5
Antenna-2
(a)
(b)
Figure 7. Structure of proposed hexagonal smart antenna. (a) Proposed hexagonal structure. (b) Fabricated proposed antenna.
(a)
(b)
Figure 8. Design smart antenna system. (a) Each antenna attached by X-Bee module. (b) Dual ARM microprocessor used to handle all six beams of the antenna. Figure 8(a) shows an antenna connected to X-Bee module and wired to the input pin of the microprocessor while Figure 8(b) shows that Dual ARM microprocessor was used to cover all six beams of directional antenna. Each microprocessor covers maximum up to 4 serial UART (Universal Asynchronous Receiver/Transmitter) input, and in order to support six beams, two units of microprocessor are used. ARM processor with part number ATSAM3X8E is used because it has capability to cater large data and support multi-input of UART. In addition, it has large memory that allows applying algorithm in signal processing.
Progress In Electromagnetics Research B, Vol. 56, 2013
375
4.3. Measurement Setup The single array antenna is assembled in a hexagonal structure with 6-elements to cover all angles in 360 degrees, to check the performance of reflection coefficient every single angle of the antenna, thus a measurement is needed. Referring to Figure 5, above initial measurement reflection coefficient of single antenna gives good response for the band 2.4 GHz to 2.6 GHz, thus remeasurement is needed after antenna assemble becomes hexagonal structure to validate the performance maintained for the require bandwidth. Figure 9 shows measurement setup to measure reflection coefficient of antenna once the antennas share the same ground element, and the measurement of radiation pattern has been done to compare with the initial results of the single antenna. Once results of both reflection coefficient and radiation pattern are fulfilled as required in LTE band, a prototype of 2.4 GHz band is required in order to match the X-Bee band. The next step is live measurement on site to test the performance of smart antenna by using a mobile device.
Figure 9. Measurement of antenna reflection coefficient in hexagon structure. Figure 10 shows a test that has been performed at the actual field in an open area, where a mobile device (user) is placed around antenna, then radio signal strength indicator (RSSI) reading for each antenna is recorded. In the initial testing, 10 samples of data RSSI are taken, and the average is calculated. Next test takes more sample data RSSI from each antenna, while mobile device is placed in one of the beam area of the antenna. Sample data taken are for 100 samples and should be different for each of the antennas because every antenna
376
Evizal et al.
Figure 10. Measurement of signal strength received by each of antenna in outdoor. receives from a different angle, then average of all data received is calculated to compare with previous small amount of sample data with only 10 data. All above testings are an initial testing without implementing intelligence algorithm into data processing because as observed, the RSSI received from each antenna keeps changing and signal value received, which match up each antenna, does not represent relevant value compared to the angle of mobile device. Introducing smart algorithm, which is an artificial immune system (AIS), is to reduce and overcome the current issues in inconsistent signal strength received in each antenna, then define actual values received. One of the AIS methods is a negative selection algorithm (NSA) where every signal received and collected by receiver is kept in a database to be analyzed. As long as the collected data are good for the system because AIS concept is a learning process from the behaviour of previous data, a decision is achieved based on new data received. Data from different scenarios, such as environment, angle of mobile device (user) and distance, are required to make the system more intelligent and a decision made more accurately to the actual data.
Progress In Electromagnetics Research B, Vol. 56, 2013
377
4.4. Implement of Artificial Immune System Algorithm The use of the negative selection algorithm in smart antenna is a method to determine actual signal strength value received from mobile device, as initial testing values of RSSI received from each of the antennas are inconsistent. Specifically, real value negative selection algorithm (RNSA) is used in this case because real values of the signal strength received will be compared and analyzed by processing unit without converting to other unit such as binary. Signal training process is done to collect sample data as much as possible and various scenarios of wireless communication. Figure 11 shows a flowchart of the algorithm. Figure 11(a) shows a flowchart to generate negative selection algorithm detector, and Figure 11(b) shows a flowchart of the algorithm to process signal received and determine actual received signal value. The basic concept of an artificial immune system is to generate detector by collecting sample data as much as possible for training process, then a detector set will check and define signal or value to be processed based on requirement. Once the actual value of the signal strength received is defined, the next process is to analyze which is the highest values. Antenna direction toward mobile device should receive the highest values because of the direct beam. The whole system process in digital signal processing (DSP) is
Y
Start
Begin
Collect Candidate Detector Data
Input Live RSSI Data
Match Self Sample of Data?
Match to Detector?
Y
N
N New Detector Accepted
Enough of Detector Number?
N
Self
Non-Self
Store Self Data as Actual RSSI
Ignore Non-Self Data
Y End
(a)
End
(b)
Figure 11. Flowchart of negative selection algorithm process flow. (a) Detector set generation. (b) Define of actual RSSI value.
378
Evizal et al. Start
User Device Send Packet of Data Smart Antenna System Received Packet of Data
DSP Check RSSI Value and Number of Data Received for First Antenna
N
Enough of Sample Data? Y AIS Algorithm Processing as Shown in Figure 11
DSP Check RSSI Value and Number of Data Received for Sixth Antenna
Enough of Sample Data?
N
Y Comparing Actual RSSI Value From Antenna 1-6 Than Define Represented Antenna Received
Switch Beam to Highest Value and On LED Indicator at Antenna
Y
RSSI Value Changing? N End
Figure 12. Flowchart of algorithm complete process smart antenna system. shown in the algorithm flowchart in Figure 12, starting by collecting data of RSSI until switching antenna beam toward user device beam. A mobile device is used as user transmitter and programmed to be able to transmit a packet of data. Moreover, X-Bee module is available with RSSI value data in the packet, thus the signal value is received by signal processing to be analyzed as live data and candidate of the detector. Artificial immune system determines the values of live data
Progress In Electromagnetics Research B, Vol. 56, 2013
379
based on a detector set generated, and the number of detectors is normally bigger than the number of data to process. In this case, the number of sample data to be analyzed is 10 and 100, and the number of detector sets should be bigger than live data. For 10 live data, the number of detector sets is 50, and for 100 live data, the number of detectors is 500, five times of the live data. After real values of RSSI are defined from each of antenna beam controller will set the beam to the highest value of RSSI as represented beam of the angle of arrival (direction of arrival) signal of the user device. An LED indicator is also installed at the bottom of the antenna as a sign that activated beam in this direction and indicates that user device is also detected from this beam area. The proposed process of system can be completed on personal computer for testing and simulation, then actual implementation uses digital signal processing, where all the proposed algorithm and software will be implemented in digital signal processing (DSP) chip. As common software and algorithm system has a code or pseudocode to perform all the raw data, Figure 13 shows the pseudocode used in the proposed smart antenna system. Figure 13(a) shows that the algorithm provides a pseudocode listing of the detector generation procedure for the negative selection algorithm (NSA), and Figure 13(b) shows that the algorithm provides a pseudocode listing of the detector application procedure for the negative selection algorithm [19].
(a)
(b)
Figure 13. Pseudocode of smart antenna system. (a) Detector generation procedure. (b) Detector application procedure. 5. RESULTS AND DISCUSSION In order to collect the RSSI value of X-Bee module, a packet of data need to be sent from any pairing of X-Bee device, and in this scenario a set of X-Bee module attached to a microcontroller sends a packet
380
Evizal et al.
(a)
Number of RSSI Value Collected
Hexadecima l (dBm)
Decimal (-dBm)
1 2 3 4 5 6 7 8 9 10
3C 39 33 32 33 35 38 3F 45 38
60 57 51 50 51 53 56 63 69 56
(b)
Figure 14. Raw data received consist of RSSI value. (a) Byte 7 is represent RSSI data. (b) RSSI value in hexadecimal converts to decimal. of data that consist of RSSI value. By using demo software of XBee which is X-CTU, where software receives raw data representing packet sent by transmitter (user device), as the data sheet of X-Bee module [20], RSSI value is at 7th byte and in hexadecimal value. Figure 14 shows X-CTU demo software received packet of data from the transmitter. Figure 14(a) shows raw data in hexadecimal, and 7th byte represents RSSI value. Figure 14(b) shows that RSSI value received is converted from hexadecimal to decimal for easy analysis and observation, and the proposed algorithm is also in real values which does not need to convert to other unit. Measurement results as mentioned earlier are initially obtained by collecting RSSI data received at each antenna with 10 numbers, then the average to determine actual signal values received by representative of each antenna beam is calculated. Table 1 shows the number of antenna beams as proposed hexagon structure, number of data collected and average values for 10 of sample data. Results of RSSI values received for every reading is mostly changing, lower number of data maintains the same values due to environment and path loss of the wireless signal. In this scenarios, the user device is located at beam 2 (antenna 2 zone). In this beam expected signal value receive is the highest among all beams, and the weak RSSI value is in beam 5 (the opposite side) while the rest beams received RSSI value are in the middle range.
Progress In Electromagnetics Research B, Vol. 56, 2013
381
Table 1. Number of RSSI data collected for user device on beam 2. Number of RSSI Collected
RSSI Value (dBm) Beam 1 Beam 2 Beam 3 Beam 4 Beam 5 Beam 6
1
−60
−60
−65
−76
−88
−73
2
−63
−57
−66
−76
−89
−70
3
−66
−51
−62
−78
−89
−76
4
−64
−50
−60
−74
−85
−76
5
−64
−51
−69
−71
−83
−71
6
−65
−53
−63
−73
−89
−72
7
−67
−56
−65
−73
−88
−76
8
−63
−63
−65
−75
−85
−78
9
−63
−69
−65
−74
−89
−78
10
−61
−56
−60
−71
−89
−75
Average RSSI Value
−63.6
−56.6
−63.0
−74.1
−87.4
−74.5
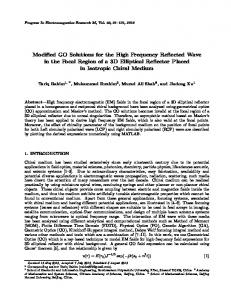
While increasing the number of RSSI samples to determine actual values by calculating the average still inaccurate as represented actual values of RSSI. The second measurement is by collecting sample data of RSSI values from every antenna by 100 samples, then similar to previous technique, the average is calculated to determine representative actual signal strength value. To make analysis and observation easy, those sample data plotted in the chart by y-axis represent values of RSSI in dBm and x-axis number of sample data collected. Figures 15(a)–(f) shows graphs of sample data collected for every beam starting from the first beam until the sixth beam. The graphs also show the straight lines at y-axis which indicate average value. Results of signal strength value collected from every beam as shows in Figure 15 indicate that the average value of RSSI still does not represent actual values of received signal. The figure shows that almost all the average values of RSSI are higher than the values determined by algorithm processing. For example, in this scenario as mentioned earlier, user device location in antenna 2 beams and reading from that antenna shows −56.6 dBm while the signal strength value based on the artificial immune system algorithm shows that the values is −52.9 dBm. Similar to the other beams of antenna, reading data from user device show an average value higher than the value determined by immune algorithm. To prove that the values of RSSI received determined by
382
Evizal et al.
(a)
(b)
(c)
(d)
(e)
(f)
Figure 15. Raw data received consist of RSSI value. (a) 1st antenna. (b) 2nd antenna. (c) 3rd antenna. (d) 4th antenna. (e) 5th antenna. (f) 6th antenna. AIS algorithm are true, in this case, a measurement has been done in an anechoic chamber with almost zero interference, and RSSI value is collected based on similar distance. This method to prove and as
Progress In Electromagnetics Research B, Vol. 56, 2013
383
Table 2. Comparison of RSSI results measurement and calculation. RSSI Value Average Calculation
Percent of Error
Antenna-1 −62 dBm
−65.59 dBm
5.47%
−63.65 dBm
2.59%
Antenna-2 −52 dBm
−57.25 dBm
9.17%
−52.49 dBm
0.93%
Antenna-3 −62 dBm
−65.15 dBm
4.83%
−61.36 dBm
1.04%
Antenna-4 −71 dBm
−76.18 dBm
6.80%
−73.28 dBm
3.11%
Antenna-5 −81 dBm
−82.95 dBm
2.35%
−79.67 dBm
1.67%
Antenna-6 −73 dBm
−75.69 dBm
3.55%
−72.11 dBm
1.23%
Beam of Antenna
Initial RSSI Value
RSSI Value Percent Determine of Error Algorithm
a reference of RSSI values given by algorithm processing is correct and can be used as an indicator for smart antenna beam switching. Table 2 shows a summary of measurement result and comparison between average calculations (current results of system) and those determined by artificial immune algorithm (proposing new system by algorithm). Comparison result shows measurement of RSSI signal in an anechoic chamber as initial values of RSSI for reference, and percentage error of average calculation is higher than that determine by immune algorithm. This mean value of RSSI defined by AIS algorithm is more accurate than that by average calculation although it has some error percentage. 6. CONCLUSIONS A smart antenna system for long term evolution communication as proposed has been designed, measured and tested. The use of smart antenna is related to the arrival of the signal and processing system, thus selection of algorithm is important to obtain actual signal values received, define angle of signal arrival and correct beam switching. The proposed artificial immune system (AIS) using real value negative selection algorithm to determine the actual signal value received by smart antenna system has been tested and proved to be applicable in signal processing. RSSI value is used as reference parameters because in common radio frequency transmitter and receiver should have radio signal strength properties, thus this signal is used to determine direction of arrival (angle of arrival) of user device in a wireless communication system. This method is proposed as an alternative and explored applicability of an artificial immune system applied into antenna signal processing. The smart antenna structure proposed is hexagonal with 6-elements of antenna array, thus the
384
Evizal et al.
antenna system has possibility to receive signals from 6 angles of arrival. Implementation of the artificial immune algorithm contributes efficiency and accuracy in determinnation of the angle of arrival compared to calculation of average signal received. To prove that the signal defined by the algorithm is correct value to the actual signal, a measurement in anechoic chamber has been done on early stage as a reference to RSSI value, and the result of measurement is recorded in every beam of antenna directions. A comparison has been made in the last stage to see the error percentage of the result determined by average calculation compared to result determined by immune algorithm. The proposed smart antenna system is able to switch the antenna beam toward the direction of user device and continues to track user device location. ACKNOWLEDGMENT The authors would like to acknowledge and express sincere appreciation to Universiti Teknologi Malaysia and Wireless Communication Centre for financing this project. REFERENCES 1. 3GPP, “The mobile broadband standard,” 2013, Available: http://www.3gpp.org/About-3GPP. 2. Weon-Cheol, L. and C. Seungwon, “Adaptive beamforming algorithm based on eigen-space method for smart antennas,” IEEE Communications Letters, Vol. 9, No. 10, 888–890, 2005. 3. Celik, N., et al., “Implementation and experimental verification of hybrid smart-antenna beamforming algorithm,” IEEE Antennas and Wireless Propagation Letters, Vol. 5, No. 1, 280–283, 2006. 4. Mahmoud, K. R., M. El-Adawy, S. M. M. Ibrahem, R. Bansal, and S. H. Zainud-Deen, “A comparison between circular and hexagonal array geometries for smart antenna systems using particle swarm optimization algorithm,” Progress In Electromagnetics Research, Vol. 72, 75–90, 2007. 5. Byun, G., et al., “Optimum placement of DF antenna elements for accurate DOA estimation in a harsh platform environment,” IEEE Transactions on Antennas and Propagation, Vol. 61, No. 9, 4783–4791, 2013. 6. Carlin, M., et al., “Directions-of-arrival estimation through Bayesian compressive sensing strategies,” IEEE Transactions on Antennas and Propagation, Vol. 61, No. 7, 3828–3838, 2013.
Progress In Electromagnetics Research B, Vol. 56, 2013
385
7. Malajner, M., et al., “Angle of arrival estimation using RSSI and omnidirectional rotatable antennas,” IEEE Sensors Journal, Vol. 12, No. 6, 1950–1957, 2012. 8. Hood, B. N. and P. Barooah, “Estimating DoA from radiofrequency RSSI measurements using an actuated reflector,” IEEE Sensors Journal, Vol. 11, No. 2, 413–417, 2011. 9. Celik, N., et al., “Experimental verification of the hybrid smart antenna algorithm with modulated waveforms,” IEEE Antennas and Wireless Propagation Letters, Vol. 8, 236–239, 2009. 10. Hislop, G., et al., “Direction finding with MUSIC and CLEAN,” IEEE Transactions on Antennas and Propagation, Vol. 61, No. 7, 3839–3849, 2013. 11. Gotsis, K. A., et al., “On the direction of arrival (DoA) estimation for a switched-beam antenna system using neural networks,” IEEE Transactions on Antennas and Propagation, Vol. 57, No. 5, 1399– 1411, 2009. 12. Kunarak, S. and R. Suleesathira, “Algorithmic vertical handoff decision and merit network selection across heterogeneous wireless networks,” WSEAS Transactions on Communications, Vol. 12, 1– 13, 2013. 13. De Castro, L. R. and J. Timmis, Artificial Immune Systems: A New Computational Intelligence Paradigm, Springer-Verlag New York, Inc., 2002. 14. Timmis, J., et al., “Immune systems and computation: An interdisciplinary adventure,” Unconventional Computing, Vol. 5204, 8–18, C. Calude, et al., Eds., Springer, Berlin, Heidelberg, 2008. 15. Gonz´alez, F., et al., “A randomized real-valued negative selection algorithm,” Artificial Immune Systems, Vol. 2787, 261–272, J. Timmis, et al., Eds., Springer, Berlin, Heidelberg, 2003. 16. Hunt, J., et al., “JISYS: Development of an artificial immune system for real world applications,” Artificial Immune Systems and their Applications, 157–186, Springer, 1998. 17. Gross, F. B., Smart Antenna for Wireless Communication, McGraw-Hill, United States, 2005. 18. Balanis, C. A., Antenna Theory: Analysis and Design, John Wiley & Sons, 2005. 19. Brownlee, J., Clever Algorithms, 1st Edition, Lulu Enterprises, Australia, 2011. R R RF modules,” Product Manual 20. DI Inc., “XBee° /XBee-PRO° v1.xEx — 802.15.4 Protocol, M. N. Minnetonka, Ed., 2009.