was then recorded using a Tektronix TDS540 digital oscilloscope, before being transferred to a PC for data storage. The PC was also used to control the X-Y ...
APPLICATION OF PULSE COMPRESSION SIGNAL PROCESSING TECHNIQUES TO ELECTROMAGNETIC ACOUSTIC TRANSDUCERS (EMATS) FOR NON-CONTACT THICKNESS MEASUREMENTS AND IMAGING T. H. Gan, K. S. Ho, D.A. Hutchins and D. R. Billson School of Engineering, University of Warwick, Coventry CV4 7AL, United Kingdom. Abstract: A pair of non-contact EMATs has been used for thickness measurements and imaging of metallic plates. This was performed using wide bandwidth EMATs and pulse- compression signal processing techniques, using chirp excitation. This gives a greatly improved Signal to Noise Ratio (SNR) for non-contact experiments, increasing the speed of data acquisition. A numerical simulation of the technique has confirmed the performance. Experimental results indicate that it is possible to perform non-contact ultrasonic imaging and thickness gauging in a wide range of metal plates. Advantages over conventional transient or tone-burst excitation will be discussed. Introduction: Electromagnetic transducers have been used for the non-contact generation and detection of ultrasonic signals in metals for some time [1-3]. They consist basically of a coil and a magnetic field, applied to a conducting substrate. The transmitter coil is conventionally driven with a transient current pulse. The characteristics of an EMAT as an ultrasonic source depend on the direction of the applied magnetic field, B, and eddy current density, J, induced at a conducting surface. The presence of a Lorentz force, F, on the substrate causes an elastic wave to propagate into the volume of the material, or along the surface. EMAT detection works via an inverse process, where motion of the surface induces current into the coil. The exact wave mode to which the EMAT is sensitive depends on the coil and magnetic field configuration. There are many examples, including meander-line, pancake and rectangular coils [4-6]. Meanderline coils, shown schematically in Figure 1(a), can be used for generating Rayleigh (surface) waves, Lamb waves in thinner material and shear waves at a pre-determined angle depending upon frequency of excitation and meanderline geometry [4]. Spiral pancake coils can be used to generate and detect radially polarised bulk shear waves (Figure 1(b)) [5], and rectangular coils are also useful for many types of acoustic modes, as shown in Figures 1(c) and (d). These EMATs have been used for many applications, such as the analysis of adhesive bonds [6,7], thickness measurements [8,9], and high temperature measurements [10,11].
Figure 1: Different types of EMAT configurations. (a) Menderline for Rayleigh and Lamb wave generation, (b) Pancake for radially polarised shear wave generation, (c) Rectangular for shear wave generation and (d) Rectangular for longitudinal wave generation. In practice, these measurements are difficult to make with EMAT systems because of the low signal to noise ratio (SNR) associated with their operation, which usually necessitates signal averaging on the oscilloscope [12]. This becomes ineffective for some real-time applications, especially in situations where rapid changes in timeof-arrival or amplitude are present. Recent work by Legendre et. al [13] uses a wavelet-transform method to analyse Lamb wave signals which were generated and received using EMATs in highly noisy environments. This technique was used for weld testing [14]. Another signal processing technique, known as cepstral analysis has also been used
[15] to determine the separation of the peaks of the resonant frequencies, and to relate this to the time information of the received signals. In this paper, the above has been extended by applying pulse compression techniques to an EMAT system. This uses spiral pancake coils and swept-frequency (“chirp”) signals. Pulse compression has the ability to recover noisy signals without the use of high levels of signal averaging, and thus potentially increases the speed of measurements [16-18]. It has the advantage that it provides an extended time waveform such that high overall powers are transmitted, while still retaining wide bandwidth. It can also lead to excellent time resolution, while being able to recover small signals from well below the noise floor. Note that the technique has been used previously by various authors for air-coupled ultrasonic measurements, using either polymer-filmed capacitance devices or piezoelectric devices [19,20], but there is little reported work with EMATs. Experimental setup: Figure 2 shows a schematic diagram of an EMAT, which has been used throughout this paper. The transducer consists of a pancake coil, and a magnet. The pancake coil with 20 turns has a diameter of approximately 15mm. First experiment was performed to characterise the bandwidth of the transducer in trough transmission mode. This was achieved by capturing the received echo from a 10 mm thick aluminium plate. A Panametrics pulser/receiver was used to drive the EMAT with a -250V transient signal. The captured signal was sent to an Agilent oscilloscope and averaged over 1000 times, in order to improve the signal to noise ratio. Further experiments were performed using the pulse compression approach. These were implemented using an NCA 1000 pulser/receiver unit. The input signal to the source EMAT was a chirp signal with a centre frequency, fc and bandwidth, B of 2MHz. The chirp duration, T was set to 200µsec. When this was set, thickness evaluation using through-transmitted signals was carried out on different types of material placed in between the transducers, namely Aluminium, brass and copper plates of varying thicknesses. The measurements were then compared with a Kennedy digital calliper model 331-206. Imaging was also possible using an X-Y scanning stage, as shown in the block diagram of Figure 3. This included a digital oscilloscope and an external PC controller. The radially polarised shear waves generated by the source propagated through the sample, and the through-transmitted signal was received by the second EMAT. Output from the receiver was fed back into the pulse compression unit for data analysis. The pulse-compressed data was then recorded using a Tektronix TDS540 digital oscilloscope, before being transferred to a PC for data storage. The PC was also used to control the X-Y stages. The total area of the scan was set to 60mm x 60mm, at spatial intervals of 1mm. All scanning and data acquisition was controlled by LabViewTM software. This software also extracted peak amplitude data of the transmitted signal from each waveform in the scan, and stored the data into a grid file format. The image was then plotted using SurferTM version 7.0 software. The separation of the EMATs was approximately 8mm. For the purpose of imaging, a 6mm Aluminium plate was used. The plate had a 6.5mm diameter circular flat-bottomed hole, machined into one surface to a depth of 3mm. The plotted image using the EMAT-compression system was also compared with the image obtained using the Panametrics pulser/receiver system.
Figure 2: Schematic diagram of a pancake coil EMAT in Aluminium casing
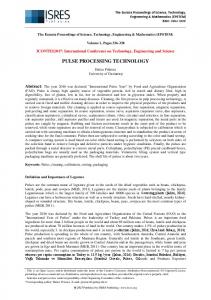
Figure 3: Experimental setup for through-transmission measurements and defect imaging using two pancake-coil EMATs. Results & Discussion: Initial experiments were performed to measure the frequency response of the pancake coil EMAT. The EMAT was driven by a Panametrics pulser and the received signal from a 10mm thick aluminium plate is shown in Figure 3(a). The captured signal was averaged over 1000 times on the oscilloscope. Without averaging, it was impossible to identify the signal. Figure 3(b) shows the FFT of the signal in Figure 3(a). It indicates that the constructed EMAT has wide bandwidth response of approximately 6 MHz at 3dB from the peak. In general, this type of wide bandwidth response is a typical behaviour of a pancake coil. However, the use of large amount of averaging (up to 1000) is inefficient, especially when comes to online measurements and imagings.
(a)
(b)
Figure 3: Results from a pancake-coil EMAT connected to a Panametrics pulse/receiver, for a 10 mm thick aluminium sample. 1000 averages were used. (a) Time waveform, and (b) corresponding frequency spectrum. In order to overcome this problem, a pulse compression signal processing technique has been used to recover the noisy signal. The same test was repeated using NCA1000 system and the result is shown in Figure 4. The figure was collected without using signal averaging. The arrival time of each peak can be clearly seen and has good SNR. Thus this shows that the technique can be used to improve SNR and allow faster data acquisition when performing online measurements.
Figure 4: Example of signal across 10 mm Aluminium in through-transmission mode using the pulse compression technique without averaging. Thickness measurements were performed on various metallic samples, including aluminium, brass and copper. The measurements were then compared with those from a Kennedy digital calliper model 331-206. Table 1 shows the results obtained, including the calculated difference between the two measurements. The results indicate that the measured thicknesses using the EMAT-compression system is well correlated with the Vernier calliper. The results for brass and copper are show in table 2 and 3. Sample Ultrasonic No. measurement (mm) 1 2.11 2 3.04 3 4.14 4 5.91 5 6.13 6 8.23 7 9.95 8 10.10 9 15.10 10 30.30
Vernier calliper (mm) 2.12 3.02 4.17 5.90 6.19 8.21 10.00 10.20 15.01 30.02
Percentage Error 0% 1% 1% 0% 1% 0% 1% 1% 1% 1%
Table 1: Comparison of thickness measurements using Vernier Calliper and EMAT pair of various Aluminium plates.
Vernier Percentage Sample Ultrasonic Error No. measurement calliper (mm) (mm) 1 3.95 4.00 1% 2 7.14 7.19 1% 3 9.89 9.96 1% 4 13.71 13.80 1% 5 16.83 16.90 0% Table 2: Comparison of thickness measurements using Vernier Calliper and EMAT pair of various Brass plates. Sample Ultrasonic Vernier Percentage No. measurement calliper Error (mm) (mm) 1 5.00 5.00 0 2 7.77 7.84 1% 3 10.25 10.30 0% 4 13.00 13.17 1% 5 15.10 15.03 0% Table 3: Comparison of thickness measurements using Vernier Calliper and EMAT pair of various Copper plates. The EMATs were now scanned in unison over the 6mm aluminium plate, into which was machined a 6.5mm diameter circular flat-bottomed hole of 3mm depth. The first image, shown in Figure 5(a), was obtained using an EMAT pair driven by the Panametrics pulser/receiver system with 20 averages on the oscilloscope. The illustrated image shows that the defect is unclear. By increasing the averaging to 200 on the oscilloscope, the resolution of the image is improved and this is shown in Figure 5(b). The scan was then repeated using the pulse compression approach with only 20 averages on the oscilloscope. It can be seen that the image in Figure 5(c) is much clearer compared to Figures 5(a) and 5(b). It can also be seen from these images that the EMAT pair is very sensitive to the change in air gap between the transducers and the sample, shown by the gradual DC shift across the images, caused by slight misalignment between the scanning stage and the sample.
Figure 5: Through transmission images of a 6 mm Aluminium plate having a 6.5 mm diameter circular hole, machined into one surface to a depth of 3 mm. (a) Panametrics pulse receiver 5052 PRX with 20 averaging, (b) Panametrics pulse receiver 5053 PRX with 200 averaging, and (c) Pulse compression signal processing techniques with 20 averaging. Some more images were created with an aluminium sample. Scans were performed on a sample with an internal defect in through-transmission. The defect is 3.4 mm diameter hole located at the center of the face of an uniform cross-section area. The cross-section is 10 mm thick, and the defect itself extended through 28 mm into the bulk of the specimen at right angle to the cross-sectional face. Figure 6(a), was obtained using an EMAT pair driven by the Panametrics pulser/receiver system with 20 averages on the oscilloscope, and Figure 6(b) was driven by pulse compression unit with 20 averages on the oscilloscope. It can be seen from these images that the resolution obtained from pulse compression is better than broadband pulse at the same level of averaging.
Figure 6: Through-transmission imagings of Aluminium plate with internal defect. (a) image obtained using Panameteric pulse/receiver with 20 averaging and (b) image obtained using pulse compression unit with 20 averaging.
Conclusions: This paper has shown that pulse compression signal processing techniques can be applied to EMATs, leading to a wide range of possible applications. It has been demonstrated that measurements of various thicknesses of metal plates can be conducted. An accuracy of up to 99% has been obtained for aluminium, and 99% for brass and copper samples. This paper also shows that the use of the pulse compression processing technique reduces the amount of averaging required for data acquisition and thus improves the time taken for imaging and real time measurements. The resolution of the image obtained using the pulse compression approach was also improved compared to a transient pulse signal from Panametrics pulser/receiver. It is thus suggested that the combination of EMATs and pulse compression can lead to a wide range of online applications where fast time acquisition is required. References: [1] B.W. Maxfield, A. Kuramoto and J.K. Hulbert, ‘Evaluating EMAT Designs for Selected Applications, Mat. Eval. , Vol 45, pp.1166-1183, (1987). [2] H.M Frost, ‘Electromagnetic-ultrasound transducers: principles, practice and applications’, Phys. Acous. Vol. XIV (Ed. Mason, W.P. and Thurstion, R.N.) Academic Press, New York, USA (1979). [3] F.R Dobbs, ‘Electromagnetic generation of ultrasonic waves Physical Acoustic: Principles and Methods’, Vol. 10 (Eds Mason. W.P. and Thurston, R.N.) Academic Press. New York, USA (1973). [4] R. Murayama, ‘Driving mechanism on magnetostrictive type electromagnetic acoustic transducer for symmetrical vertical-mode Lamb wave and for shear horizontal-mode plate wave, Ultrasonics, Vol. 34, pp. 729736, (1996). [5] S. Dixon, C. Edwards and S. B. Palmer, ‘The analysis of adhesive bonds using electromagnetic acoustic transducers’, Ultrasonics, Vol. 32, 425-430, (1994). [6] J. K Hu, Q. L. Zhang and D.A. Hutchins, ‘Directional characteristics of electromagnetic acoustic transducers’, Ultrasonics, Vol. 26, pp.5-13, (1988). [7] D.R. Billson and D.A. Hutchins, ‘Laser-EMAT Ultrasonic Measurements of Bonded Metals’, Non-dest. Test Eval., Vol. 10, pp. 43-53, (1991). [8] M.J. Bergander, ‘EMAT thickness measurement for tubes in coal-fired boilers”, Appl. Energy, Vol. 74, pp. 439444, (2003). [9] S. Dixon, C. Edwards, S.B. Palmer, ‘High accuracy non-contact ultrasonic thickness gauging of aluminium sheet using electromagnetic acoustic transducers’, Ultrasonics, 39, pp. 445-453, (2001). [10] S.S. Lee, and B.Y. Ahn, ‘EMAT application at high temperature”, Nondest. Test Eval., Vol. 7, pp. 253-261, (1992). [11] A. Idris, C. Edwards, and S.B. Palmer, ‘Acoustic wave measurements at elevated temperature using a pulsed laser generator and an electromagnetic acoustic transducer detector”, Nondest. Test Eval., Vol. 11, pp. 195-213, (1994). [12] G. M. Graham and I. C. Ume, ‘Automated System for laser ultrasonic sensing of weld penetration’, Mechatronics, Vol. 7, pp. 711-721, (1997). [13] S. Legendre, D. Massicotte, J. Goyette and T.K. Bose, ‘Wavelet-transform-based method of analysis for Lamb-wave ultrasonic NDE signals’, IEEE Trans. Instr. & Meas., Vol.49, pp.524-530, (2000). [14] S. Legendre, D. Massicotte, J. Goyette and T.K. Bose, ‘Neural classification of Lamb wave ultrasonic weld testing signals using wavelet coefficients’, IEEE Trans. Instr. & Meas., Vol.50, pp.672-678, (2001). [15] D. A. Hutchins, M. D. C. Moles, G. S. Taylor and S. B. Palmer, ‘Non-contact ultrasonic inspection of diffusion bonds in titanium’, Vol. 29, pp. 294-301, (1991). [16] N.A.H.K. Rao, and M. Aubry, ‘ Evaluation of a Pulse Coding Technique for Spatial Structure Characterisation’, IEEE Trans. Ultras. Ferr. Freq. Contr., Vol. 41, No.5, pp. 660- 663, (1994). [17] N.A.H.K. Rao, ‘Investigation of a pulse compression technique for medical ultrasound: a simulation study’, Medi. & Bio. Eng. & Comp., Vol. 32, pp.181 – 188, (1994).
[18] Y. Izuka,’ High signal to noise ratio ultrasonic testing system using chirp pulse compression’, Insight, 40, 282285, (1998). [19] T. H. Gan, D. A. Hutchins, D. R. Billson and D. W. Schindel, ‘The use of broadband acoustic transducers and pulse-compression techniques for air-coupled ultrasonic imaging, Ultrasonics, Vol. 39, pp. 181-194, (2001). [20] T. H. Gan, D. A. Hutchins, D. R. Billson and D. W. Schindel, ‘Preliminary studies of a novel air-coupled ultrasonic inspection system for food containers’, J. Food Eng., Vol. 53, pp. 315-323, (2002).