U Journal Logos (RGB) Open Access
Natural Hazards and Earth System Sciences
Nonlinear Processes in Geophysics Open Access
Open Access
tural Hazards Earth System Sciences
Open Access
Open Access
Nonlin. Processes Geophys., 20, 445–453, 2013
Advances in Annales www.nonlin-processes-geophys.net/20/445/2013/ doi:10.5194/npg-20-445-2013 Geosciences Geophysicae © Author(s) 2013. CC Attribution 3.0 License.
Chemistry Chemistry 1,2 , Q. Xia1,2 , Q. Cheng1,2,3 , and X. Wang1,2 Y. Liu and Physics and Physics
Open Access
Open Access
Discussions Application of singularity theory and logistic regression model for Atmospheric Atmospheric tungsten polymetallic potential mapping
1 State
Correspondence to: Y. Liu (
[email protected])Techniques Techniques
Open Access
Open Access
Key Laboratory of Geological Processes and Mineral Resources, China University of Geosciences, Discussions Wuhan 430074, China 2 Faculty of Earth Resources, China UniversityAtmospheric Atmospheric of Geosciences, Wuhan 430074, China 3 Faculty of Earth Resources, China University of Geosciences, Beijing 100083, China Measurement Measurement Discussions
Received: 18 February 2013 – Revised: 20 May 2013 – Accepted: 1 June 2013 – Published: 3 July 2013
Biogeosciences
Open Access
Open Access
ogeosciences Abstract.
Open Access
Open Access
mineral exploration. Specialized methods must be developed Geo-anomalies with complex structures in the Discussions for identifying geo-anomalies from background. earth’s crust may be defined as preferable hydrothermal oreAnomalous patterns created by mineralization processes forming targets. The separation and explanation of anomaly are often different in terms of spatial and frequency propfrom geological background have a profound influence on the analysis of geological evolution and the ore-forming Climateerties (Cheng et al., 1994; Cheng, 2003, 2008; Zhao et Climate al., 1996). Proper quantification of these spatial and specprocess. Usually one of the key steps to identify favorable of the Past tral properties can be essential for the identification of exploration targets is to determine the threshold to sepaof the Past Discussionsweak or complex anomalies. Recently developed methods rate anomaly from geological background. In this paper, of fractal and multifractal analysis provide powerful tools the singularity theory and concentration–area (C–A) fractal to quantitatively characterize the geo-anomalies and spamethod was applied in determination of the threshold of geotial structures across a range of scales in the context of anomalies. According to the thresholds, fourEarth singularSystem maps Earth System geo-complexity (Cheng et al., 1994; Cheng and Agtercan be each divided into two segments. Each of them is corDynamics berg, 1996b; Cheng, 2002, 2003; Cheng and Zhao, 2011; related to the anomaly and background of the geological obDynamics Discussions Agterberg et al., 1996; Ford and McCuaig, 2010; Zhao jects (e.g., faults, fault intersections and contacts), which reet al., 2011). Local singularity mapping technique and the veals that the various geo-anomalies can be characterized by concentration–area (C–A) fractal method, in the context of the singularities. The results indicate that the local singularity Geoscientific Geoscientific method can be used to identify the weak anomalies in a low fractal and multifractal analysis, have been widely applied nstrumentation for geochemical anomaly recognition (Cheng et al., 1994, background. Logistic regression model wasInstrumentation used to combine geo-singularity maps for mineral potential mapping, which Methods and Methods and1996a; Cheng, 2007, 2012; Gonc¸alves et al., 2001; Zuo et al., 2009a, b, c, 2012, 2013). provides a useful input for further mineral exploration in the Data Systems Data Systems The singularity analysis can be used to characterize geoNanling tungsten polymetallic belt, South China. Discussionschemical and geophysical anomalies based on continuous Geoscientificpatterns, and can also be used to characterize geological Geoscientific anomalies on the distribution of discrete features such as Model Developmentfaults, fault intersections and diversity of lithology (Wang et Development 1 Introduction Discussionsal., 2012). Quantification of those structure properties can assist in understanding the inner structure of the geo-anomalies The geo-anomaly is a geologic body or geologic body combithat often provide clues to anomaly identification. in composi-and Fault systems (e.g., faults, fault intersections) and lithosHydrology Hydrologynation andthat is different from its adjacent settings tion, texture, structure, and genetic sequence (Zhao and Chi, tratigraphic contacts as products of nonlinear geo-processes Earth Earth System 1991; Zhao et al., 1996; Zhao, 2007). Separation and System recogare frequently accompanied by energy released within short nition of geo-anomalies from background is a basic task in Sciences Sciences Open Access
Open Access
Open Access
Open Access
Open Access
Open Access
Open Access
Open Access
Discussions
Ocean Science Discussions
Open Acces
cean Science
Open Acces
Published by Copernicus Publications on behalf of the European Geosciences Union & the American Geophysical Union.
Major fault
446
414
0.5255
17.0816
0.1272
1.6913
0.2763
0.7747
Y. Liu et al.: Application of singularity theory and logistic regression model
415 Fig. 1. Geological map of the study area modified from existing 1:2 500 000 scale geological map (CGS, 2011). 21
spatial–temporal intervals. Wang et al. (2012) applied the singular theory to characterize singular physical properties caused by fault systems from a multifractal point of view. The implementations in this paper are mainly from a perspective of geological complexity to evaluate mineral perspectivity including fault singularity, fault intersection singularity and lithostratigraphic contact singularity, which may achieve some breakthroughs on contact-type tungsten polymetallic exploration in the Nanling belt. In addition to applying singularity theory to study geological singularities, the concentration–area (C–A) fractal method was used to separate anomalies, and finally the logistic regression model was used to integrate evidential maps for mapping tungsten polymetallic targeting areas. 2
Study area
2.1 Geological setting and mineral deposits The Nanling belt lies along the Hunan–Guangxi, Hunan– Guangdong, and Jiangxi–Guangdong provincial borders (Fig. 1). Since the early Paleozoic, this region has experienced multiple tectonic events, including the Caledonian and Indosinian orogenies and the Yanshanian Nonlin. Processes Geophys., 20, 445–453, 2013
tectono-magmatic event, leading to the formation of mineralized granitoids of various ages. The exposed strata in Nanling belt can be divided into three series. (i) The Sinian to Silurian clastic rocks are composed of deep marine flysch clastic construction more than 10 000 m thick, constituting the basement of the study area (Li et al., 1991). (ii) Covering rocks ranging from the Devonian to the Triassic in age, widely developed continental/marine paralic depositions are distributed in the Nanling belt with a large area of outcropping carbonate rocks, marlstone with interbedded clastic deposition and overall thickness of about 7000–8000 m. (iii) Since the Jurassic–Cretaceous period, the representative depositions are rift basin clastic, volcanic rocks and red beds (Mao et al., 2007). Tectonically, the Nanling belt is distributed on the strongly folded/deformed basement and developed the largest scale early Mesozoic granitoids and rift basins in South China. Major fault zones closely related to tectonic evolution of the Nanling belt impact on the size, distribution and direction of Meso-Cenozoic basins. The Nanling metallogenic belt is characterized by a record of repeated granitic magmatism since the Neoproterozoic. Mesozoic igneous rocks are the most widely exposed in the study area, and many are enriched in Sn, W, Bi, Mo, Pb, Zn,
www.nonlin-processes-geophys.net/20/445/2013/
Y. Liu et al.: Application of singularity theory and logistic regression model and Cu ore deposits (Hua et al., 2005; Hu and Zhou, 2012). Three main episodes of the Mesozoic magmatic events have occurred: Triassic, Jurassic, and Cretaceous. They are conventionally referred as the Indosinian, early Yanshanian, and late Yanshanian stages of orogeny (Zhou and Li, 2000; Li et al., 2004). On the lithology, alkali feldspar granite and syenogranite are the main mineralized rocks. Slates, phyllites, mudstone, clastic rocks, and carbonate in basement are characterized by high background contents of tungsten and other metallic element, which principally occurred in the Sinian, Cambrian, Ordovician, Devonian and Permian (Chen et al., 1990; Hua et al, 2010; Hu and Zhou, 2012). The evolution of contact-type tungsten mineralization occurred from Caledonian to Yanshanian in the Nanling belt. Especially Yanshanian larger scale ore-forming within a short interval time reveals the mineralization process exhibiting unexpectedness, singularity, uniqueness and complexity, which made the region become one of the most important metallogenic belts in the world. Rich and various mineral resources and huge potential for mineralization are the main driving forces for ongoing mineral exploration activities in this belt. 2.2
Deposit model
The Mesozoic mineralized granites are characterized by enrichment of W-Sn elements, and have undergone multi-stage differentiation, evolution, emplacement and mineralization in the Nanling belt (Chen et al., 1990; Mao and Tan, 1998; Liu et al., 2010). Genetic types of tungsten polymetallic deposits were significantly affected by granites and host rocks. In most cases, different host rocks determine different genetic types (Fig. 2). For example, skarn-type or skarn– greisen-type tungsten polymetallic deposits usually host in crystalline limestone and marble; vein-type tungsten polymetallic deposits usually host in metamorphic sandstone and slate near the contacts (Pei et al., 2009; Mao et al., 2009). Pei et al. (2009) proposed that tungsten–tin polymetallic mineralization was mainly controlled by the contact tectonic system of magma intrusions in the study area, and thus fault systems (e.g., faults, fault intersections) and lithostratigraphic contacts are important factors for tungsten polymetallic mineralization, which provide important hydrothermal transport channels in the process of magmatism that might result in the formation of tungsten polymetallic deposits in the context of contact tectonic system. 3 3.1
Methods and data Singularity index
Singularity as a special phenomenon is caused by anomalous energy release or material accumulation occurring within narrow spatial–temporal intervals (Cheng, 2007), which can be used to characterize the geological complexity associated www.nonlin-processes-geophys.net/20/445/2013/
447
with mineralization within a multifractal context. The phenomenon of singularity can be described by the following power-law model (Cheng, 1999a, 2008). ρ(r) ∝ r α−2 ,
(1)
where ρ(r) is the average density within a region (circle as special shape) of size r (scale), and α is the exponent of the power-law relationship. If the distribution of the exponent α is a constant, then the spatial pattern follows the monofractal distribution; otherwise, if α has multiple values, then the spatial pattern follows a multifractal distribution. In a two-dimensional singularity map, the dimension of the set with α is close to 2 (box-counting dimension), which corresponds to background values that occupy the greatest part of the map. The dimensions of the other areas are α 6 = 2, which imply that the areas with singular values are relatively small in comparison with the areas with nonsingular values (background values), corresponding to anomalies. Applying the concept of singularity analysis to a geo-complexity map, the positive singularity (α < 2) usually corresponds to “enhancement” of geo-complexity related to mineralization, whereas the negative singularity (α > 2) corresponds to “depletion” of geo-complexity related to mineralization. Therefore, the estimation of singularities from a geo-anomalous map might provide useful information for interpreting geological singular characteristics related to mineralization or local structures of geological objects. From an application point of view, the window-based method can be applied in the case studies to measure the singularities of geological complexity (Cheng, 1999b). The singularity index can be used to characterize distributed fault density (Wang et al., 2012). In this paper, we apply the singularity index to study the complexities of faults, fault intersections and lithostratigraphic contacts aided by ArcGIS and GeoDAS software (Cheng, 2000). 3.2
Concentration–area method
The C–A method is a simple density–area model for characterizing anisotropic scale invariance, which has been widely applied in distinguishing populations on the basis of distinct self-similarity or power-law relationships (Cheng et al., 1994, 1996b; Goncalves et al., 2001; Deng et al., 2010; Sun et al., 2010; Pazand et al., 2011). The concentration–area method is applied to analyze the structure of geochemical or density maps. A(ρ ≤ µ) = ρ −α ,
(2)
where α denotes the fractal dimension for the concentration– area method, and A(ρ) represents the cumulative areas enclosed by contours with values less than or equal to µ. Equation (2) can be fitted by straight lines on a log-log space. Different slopes of the straight lines (−α) correspond to different sets of similarly shaped contours. The breaks in slope Nonlin. Processes Geophys., 20, 445–453, 2013
416
Fig.1. Geological map of the study area modified from existing 1:2,500,000 scale geological map
417 448
(CGS, 2011)
Y. Liu et al.: Application of singularity theory and logistic regression model
418 Fig. 2. Deposit model of the contact structural system of magma emplacement (modified after Pei et al., 2009).
419
Fig.2. Deposit model of the contact structural system of magma emplacement (modified after Pei
on the power-law graph can be used to distinguish groups of et al., 2009) samples with different spatial and intensity characteristics. 1 pi = −(α+β x +β2 x2 +···+βn xn ) 1 1 1+e 3.3 Logistic regression model
420
ln[L(θ)] = ln[
Various regression models have been applied in mineral resource assessment for the past three decades (Agterberg and Divi, 1978; Agterberg, 1981; Carranza and Hale, 2001), among which the logistic regression model based on the logistic distribution is a powerful tool for the quantitative analysis of a dichotomous dependent variable, clarifying the impact factors of the dependent variable. Logistic regression model is a probabilistic nonlinear model, which is appropriate for constructing various complex real world phenomena (McCarthy et al., 1995). Logistic regression involves fitting the dependent variable in the following form:
Nonlin. Processes Geophys., 20, 445–453, 2013
n Y i=1
=
n X
y
pi i (1 − pi )1−yi ] =
n X
(i = 1, 2, · · · , m)
[yi ln(
i=1
pi ) + ln(1 − pi )] 1 − pi
(3) (4)
[yi (α + β1 x1 + β2 x2 + · · · + βk xk )
i=1
− ln(1 + eα+β1 x1 +β2 x2 +···+βk xk )] i = 1, 2, · · · , m),
where L(θ ) donates the product of the marginal distribution, and p is the probability that the dependent variable (y) is 1. p/(1 − p) is the likelihood ratio, α is the intercept, and β1 , β2 , · · · , βn are coefficients that measure the contribution of independent factors (x1 , x2 , · · · , xn ) to the variations in y. Note that all the variables in the model are binary variables representing presences or absences of the corresponding variables. 22
www.nonlin-processes-geophys.net/20/445/2013/
Y. Liu et al.: Application of singularity theory and logistic regression model
449
In logistic regression, the regression coefficients were obtained by maximum likelihood estimation using Newton’s method, performed in the compiled Matlab program. The relative importance of the independent variables can be assessed using the corresponding coefficients, and the significance can be assessed by the level of significance of the regression coefficients, especially Wald’s statistic, which approximately follows a chi-squared distribution. The natural exponent of the regression coefficient, exp(β), is called occurrence ratio. exp(β > 1) indicates the independent variable has a positive impact on the dependent variable; exp(β) = 1 indicates that the independent variable has no impact on the dependent variable, while exp(β) > 1 indicates that the independent variable has a negative impact on the dependent variable. 3.4
Data
421 422
The data used in this study consist of a 1:500 000 geological map compiled from the Chinese Geological Survey (CGS), which contains major faults, secondary faults and geological units. Fault intersections were extracted from secondary faults. Lithostratigraphic contacts were extracted between Yanshanian granitoids and formations. Those formations contain the Sinian, Cambrian, Ordovician, Devonian, and Permian. Fault systems (e.g., faults, fault intersections) and lithostratigraphic contacts were manipulated in ArcGIS to generate linear density map and point density map, and then a certain number of points were ran423 domly extracted from density maps, and then values of424α were calculated using GeoDAS (Cheng, 2000). We set square 425 426 windows with half window sizes ranging from rmin = 2 km, 6 km, 10 km, 14 km, . . . , rmax = 22 km with an interval of 4 km. A more detailed process of the values of α can be found in Cheng (2007) .
4
Results
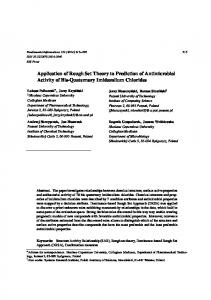
The C–A method was used to separate anomalies from background for all four singular maps, and then a logistic model was used to measure the importance of the binary singular maps and integrate four binary singular maps for tungsten polymetallic mineral potential assessment. On the basis of log-log plots of value versus area of cells, the C–A plots for these four geological singular maps can be modeled with two segments, which represent anomalies and background, respectively. For the Yanshanian granitic contact (Fig. 3a, b), the left-hand line segment represents background value, whereas the right-hand line segment represents anomalies, corresponding to the singular value equal to or smaller than 1.97. For the secondary fault (Fig. 4a, b), the left-hand line segment represents background value, whereas the right-hand line segment represents anomalies, corresponding to the singular value equal to or smaller than www.nonlin-processes-geophys.net/20/445/2013/
A
B Fig.3. (A) Map showing the Yanshanian granitic contacts density singularity, and (B) Log–log plotsFig. for the3.Yanshanian contacts. (A) Mapgranitic showing the Yanshanian granitic contacts density
singularity, and (B) Log-log plots for the Yanshanian granitic contacts.
1.97. For the major fault (Fig. 5a, b), the left-hand line segment represents background value, whereas the right-hand 23 line segment represents anomalies, corresponding to the singular value equal to or smaller than 1.98. For the fault intersection (Fig. 6a, b), the left-hand line segment represents background value, whereas the right-hand line segment represents anomalies, corresponding to the singular value equal to or smaller than 1.95. The estimated logistic regression coefficients and their corresponding statistical indicators of significance are given in Table 1. The coefficients of regression were converted to the power of the natural log(e) in the fifth column headed exp(β). If the coefficient is positive, its transformed log value will be greater than one, meaning that the event is more likely to occur. Otherwise, its transformed log value will be less than one and the odds of the event occurring decrease. The exp(β) values show that all the binary singular map predictors (independence variables) have a better predictive ability (Table 1). The significance can be examined by Wald’s Nonlin. Processes Geophys., 20, 445–453, 2013
450
Y. Liu et al.: Application of singularity theory and logistic regression model
427 428
433
A
434
A
429 430 431 432
435 B Fig.4. (A) Map showing the secondary faults density singularity, and (B) Log–log plots for the436 secondary Fig. 4.faults. (A) Map showing the secondary fault density singularity, and 437 438
(B) Log-log plots for the secondary faults.
24 follows a chi-squared distristatistic, which approximately bution (Ohlmacher and Davis, 2003). Wald’s value of secondary fault is the most statistically significant map predictor, because there is a largest Wald value equal to 114.7. Wald’s value of major fault is least statistically significant, because there is a smallest value equal to 17.08. However, with one degree of freedom and a confidence level of 95 %, it is also significant. The results indicate that secondary faults control the occurrence of deposits spatially and have more impact on tungsten polymetallic mineralization, corresponding to major faults. The logistic regression model does not require the assumption of conditional independence and hence its output is not affected by the correlations amongst the input predictor maps. Four binary maps are integrated by the logistic regression model: (1) secondary fault, (2) major fault, (3) fault intersection, and (4) lithostratigraphic contact. Figure 7 shows that the southeast, northeast and central parts of the area are well-explored, and a few of the large and giant tungsten polymetallic deposits are located in those high potential
Nonlin. Processes Geophys., 20, 445–453, 2013
B Fig.5. (A) Map showing major faults density singularity, and (B) Log–log plots for the secondary faults. 5. (A) Map showing major fault density singularity, and Fig.
(B) Log-log plots for the secondary faults.
25 areas, such as supergiant deposits of Shizhuyuan, Yaogang and Piaotang, and large deposits of Dajishan, Xiaoshan and Dabaoshan. However, west and southwest parts of the area are not well-explored. The highest prospectivity zone occurs in the central parts of the study area, such as zone A, zone B, zone D and zone E, mainly resulting from the emplacement of the Yanshanian intrusive rocks, especially the emergence of small intrusive rocks that are often accompanied by intensive mineralization, leading to the formation of several large giant deposits, such as Shizhuyuan tungsten polymetallic deposit with 750 000 tons of resources. The higher prospectivity zone also occurs in the north borders between the Nanling belt and Shihang belt (Mao et al., 2011), associated with the large-scale tungsten and tin mineralization at 160–150 Ma caused by subducted plate window in the central part in South China and bounded in the west by the Shihang suture (Mao et al., 2011). The prospectivity zones, such as zone I, zone G and zone Q, extend northeast trending.
www.nonlin-processes-geophys.net/20/445/2013/
Y. Liu et al.: Application of singularity theory and logistic regression model
451
Table 1. Coefficients of the logistic regression and corresponding statistical indicators of significance of four binary singular map predictors.
Intercept Granitic contact Secondary fault Fault intersection Major fault
β
Wald’s
SE
exp (β)
95 % ConLow
95 % ConUp
−4.8375 0.8446 1.5692 1.2705 0.5255
1127.888 45.5015 141.771 103.0695 17.0816
0.144 0.1252 0.1318 0.1251 0.1272
0.0079 2.3271 4.8029 3.5625 1.6913
−5.1199 0.5992 1.3109 1.0252 0.2763
−4.5552 1.09 1.8275 1.5157 0.7747
439 440
A
446 447
Fig.7. Potential map generated by logistic regression modeling
Fig. 7. Potential map generated by logistic regression modeling.
5
441 442 443 444
B Fig.6. (A) Concentration–area map for the secondary fault intersections, and (B) Log–log plots for the secondary intersections. Fig. 6. (A)fault Concentration–area map for the secondary fault intersec-
445
tions, and (B) Log-log plots for the secondary fault intersections.
26 zone occurs in the southeast The other high prospectivity part of the area along the margin of the southwest–northeasttrending major faults, from zone G, after zone F, to zone N, extending more than 400 km. Two large tungsten polymetallic deposits were discovered: Dajishan and Jubankeng. In the western part of the study area, there are also some high prospectivity zones occurring, such as zone K, zone L, zone O and zone P. However, those zones are not wellexplored, but have potential for future exploration.
www.nonlin-processes-geophys.net/20/445/2013/
Discussion and conclusion
The novelty of this research lies in using geological singularities for mineral resource potential assessment. The singularity index is the exponent of the power-law associating density with scale of geo-anomaly, and determines an essential dimensional property of geo-anomaly that is independent of its geometrical scale, which is capable of enhancing weak geoanomalies caused by these ore-controlling factors. Fault density, fault intersections and lithostratigraphic contacts were investigated as potential controlling factors as they had already been shown to be important for tungsten polymetallic mineralization (Chen et al., 1990; Hua et al., 2005; Mao et al., 2007). The patterns of27α values calculated for these ore-controlling factors illustrate that the areas with α values < 2 are spatially coincident with the locations of the most known tungsten polymetallic deposits. The paper shows that geo-anomalies can be quantitatively and spatially characterized by the geo-singularities of linear (e.g., fault, fracture, contact) density and point (e.g., intersection, deposit, chemical sampling) density, and result in a better understanding of the geological complexities. The evidential maps produced Nonlin. Processes Geophys., 20, 445–453, 2013
452
Y. Liu et al.: Application of singularity theory and logistic regression model
by singular analysis and concentration–areas method can be combined to estimate the likelihood of the presence of mineral resources in a given area. Logistic regression model is a probabilistic nonlinear model, which is appropriate for constructing various complex real world phenomena. However, it is very hard to process the large amount of data in the statistical package (Lee and Min, 2001; Yilmaz, 2009). In the paper, the data were converted to ASCII, and then performed in logistic regression model compiled by the Matlab program. Finally, the logistic probabilities were converted to grid format. This case study demonstrates that the singularity value can provide new information for characterizing local structural properties of geo-anomalies, and is significant for prediction of undiscovered mineral deposits. Although the Nanling belt has undergone significant exploration effort and expenditure, large areas of the belt are still under-explored because of the dense vegetation and rugged mountainous terrain. The potential of prospectivity map was demonstrated using followup assessments, which resulted in several newly discovered targets (Fig. 6), such as the zone H, zone L, zone M, zone N, and zone P. Many of the large and giant tungsten polymetallic deposits were located within areas of high favorability, and several other new potential tungsten polymetallic targets were identified. Prior to conducting follow-up work, it is important to evaluate the tungsten polymetallic prospectivity maps based on how well each map has predicted the known tungsten polymetallic prospects.
Acknowledgements. Thanks are due to Renguang Zuo for his helpful discussion and constructive comments that improved the manuscript. Thanks are also due to F. P. Agterberg and an anonymous author for their good comments that improved our English language. This research benefited from the joint financial support from the Program of Integrated Prediction of Mineral Resources in Covered Areas (Nos. 1212011085468), a research project on “Quantitative models for prediction of strategic mineral resources in China” (201211022) by China Geological Survey, the Program on “Mineral Resource Quantitative Assessment in China” (1212011121045, 1212011121040) by China Geological Survey, and MOST Special Fund from the State Key Laboratory of Geological Processes and Mineral Resources, China University of Geosciences (No. MSFGPMR201003). Edited by: L. Telesca Reviewed by: R. Zuo and F. Agterberg
References Agterberg, F. P.: Application of image analysis and multivariate analysis to mineral resource appraisal, Econom. Geol., 76, 1016– 1031, 1981. Agterberg, F. P. and Divi, S. R.: A statistical model for the distribution of copper, lead, and zinc in the Canadian Appalachian region, Econ. Geol., 73, 230–245, 1978.
Nonlin. Processes Geophys., 20, 445–453, 2013
Agterberg, F. P., Bonham-Carter, G. F., Cheng, Q., and Wright, D. F.: in: Weights of evidence modeling and weighted logistic regression in mineral potential mapping, edited by: Davis, J. C. and Herzfeld, U. C., Computers Geol., Oxford Univ. Press, New York, 13–32, 1993. Agterberg, F. P., Cheng, Q., Brown, A., and Good, D.: Multifractal modeling of fractures in the Lac du Bonnet Batholith, Manitoba. Comput. Geosci., 22, 497–507, 1996. Carranza, E. J. M. and Hale, M.: Logistic Regression for Geologically Constrained Mapping of Gold Potential, Baguio District, Philippines, Explor. Mining Geol., 10, 165–175, 2001. Chen, Y., Pei, R., and Zhang, H.: Mineral deposit of nonferrous metal and rare metal associated with Mesozoic granite in the Nanling region, Bull. Chinese Academy Geol. Sci., 20, 79–85, 1990 (in Chinese). Cheng, Q.: Multifractal interpolation, 245–250, in: Proc. Annu. Conf. Int. Assoc. for Mathematical Geol., edited by: Lippard, S. J., Naess, A., and Sinding-Larsen, R., Trondheim, Norway, 6–11 August 1999, 1, Norw. Univ. Sci. Technol., Trondheim, 1999a. Cheng, Q.: Multifractality and spatial statistics, Comput. Geosci., 25, 949–961, 1999b. Cheng, Q.: GeoData Analysis System (GeoDAS) for mineral exploration: user’s guide and exercise manual. Material for the TrainingWorkshop on GeoDAS held at York University, Toronto,Canada, 1, 204 pp., available at: http://www.gisworld. org/geodas, 2000. Cheng, Q.: Multifractal modeling and GIS spatial analysis of complex fault systems, Japan Soc. GeoInformatics, 190–193, 2002. Cheng, Q.: Fractal and multifractal modeling of hydrothermal mineral deposit spectrum application to gold deposits in Abitibi area, Ontario, Canada, J. China University Geosci., 14, 199–206, 2003. Cheng, Q.: Mapping singularities with stream sediment geochemical data for prediction of undiscovered mineral deposits in Gejiu, Yunnan Providence, China. Ore Geology Rev., 32, 314–324, 2007. Cheng, Q.: Modeling Local Scaling Properties for Multiscale Mapping, Vadose Zone J., 7, 525–532, 2008. Cheng, Q.: Singularity theory and methods for mapping geochemical anomalies caused by buried sources and for predicting undiscovered mineral deposits in covered areas, J. Geochem. Explor., 122, 55–70, 2012. Cheng, Q. and Zhao, P.: Singularity theories and methods for characterizing mineralization processes and mapping geo-anomalies for mineral deposit prediction, Geosci. Frontiers, 2, 67–79, 2011. Cheng, Q., Agterberg, F. P., and Ballantyne, S. B.: The separation of geochemical anomalies from background by fractal methods, J. Geochem. Explor., 51, 109–130, 1994. Cheng, Q., Agterberg, F. P., and Bonham-Carter, G. F.: A spatial analysis method for geochemical anomaly separation, J. Geochem. Explor., 56, 183–I95, 1996a. Cheng, Q. and Agterberg, F. P.: Multifractal modeling and spatial statistics, Math. Geol., 28, 1–16, 1996b. China Geology Survey (CGS): China geological map of scale 2,500,000, 2011. Deng, J., Wang, Q., Yang, L., Wang, Y., Gong, Q., and Liu, H.: Delineation and explanation of geochemical anomalies using fractal models in the Heqing area, Yunnan Province, China, J. Geochem.
www.nonlin-processes-geophys.net/20/445/2013/
Y. Liu et al.: Application of singularity theory and logistic regression model Explor., 105, 95–105, 2010. Ford, A. and McCuaig, T. C.: The effect of map scale on geological complexity for computer-aided exploration targeting, Ore Geology Rev., 38, 156–167, 2010. Gonc¸alves, M. A., Mateusa, A., and Oliveira, V.: Geochemical anomaly separation by multifractal modelling, J. Geochem. Explor., 72, 91–114, 2001. Hu, R. Z. and Zhou, M. F.: Multiple Mesozoic mineralization events in South China – an introduction to the thematic issue, Miner Deposita, 47, 579–588, 2012. Hua, R., Chen, P., Zhang, W., Yao, J., Lin, J., Zhang, Z., and Gu, S.: Metallogeneses and their geodynamic settings related to Mesozoic granitoids in the Nanling range. Geological Journal of China Universities, 11, 291–304, 2005 (in Chinese with English abstract). Hua, R., Li, G., Zhang, W., Hu, D., Chen, P., Chen, W., and Wang, X.: A tentative discussion on differences between large-scale tungsten and tin mineralizations in South China, Mineral Deposits, 29, 9–23, 2010 (in Chinese with English abstract). Lee, S. and Min, K.: Statistical analyses of landslide susceptibility at Yongin, Korea, Environ. Geol., 40, 1095–1113, 2001. Li, X. X., Chun, S. L., Zhou, H. W., Luo, C. H., Liu, Y., and Chen, C. H.: Jurassic intraplate magmatism in southern Hunan-eastern Guangxi 40 Ar/39 Ar dating of geochemistry, Sr-Nd isotopes and implication for the tectonic evolution of SE China, Geo. Soc. London Spec., 226, 193–215, 2004. Li, Y. Q. and Zhong, X. Y.: Mineralogy of tungsten deposits in Nanling and neighboring area, China. Wuhan: China University of Geosciences Press, 1–455, 1991 (in Chinese with English abstract). Liu, B., Chen, Y., Fan, S., Xu, J., Qu, W., and Ying, W.: The second ore-prospecting space in the eastern and central parts of the Nanling metallogenic belt: evidence from isotopic chronology, Geology in China, 37, 1034–1049, 2010 (in Chinese with English abstract). Mao, J. and Tan, H.: The geological and geochemical characterisitics of Shizhuyuan W-Sn-Mo-Bi polymetalliclic deposit, in southern Hunan Province, Beijing-Geology Publish House, 34– 56, 1998 (in Chinese with English abstract). Mao, J., Xie, G., Guo, C., and Chen, Y.: Large-scale tungsten-tin mineralization in the Nanling region South China: Metallogenic ages and corresponding geodynamic processes. Acta Petrologica Sinica, 23, 2329–2338, 2007 (in Chinese with English abstract). Mao, J., Chen, M., Yu, S., and Guo, C.: Geological characteristics of the Qinhang (or Shihang) metallogenic belt in South China and spatia-temporal distribution regularity of mineral deposits, Acta Geol. Sinica, 85, 636–658, 2011. McCarthy, M. A., Burgman, M. A., and Ferson, S.: Sensitivity Analysis for Models of Population Viability, Biological Conservation, 73, 93–100, 1995. Ohlmacher, G. C. and Davis, J. C.: Using Multiple Logistic Regression and GIS Technology to Predict Landslide Hazard in Northeast Kansas, USA, Eng. Geol., 69, 331–343, 2003. Pazand, K., Hezarkhani, A., Ataei, M., and Ghanbari, Y.: Application of multifractal modeling technique in systematic geochemical stream sediment survey to identify copper anomalies: A case study from Ahar, Azarbaijan, Northwest Iran, Chemie der Erde, 71, 397–402, 2011.
www.nonlin-processes-geophys.net/20/445/2013/
453
Pei, R., Wang, Y., and Wang, H.: Ore-forming specialty of the tectono-magmatic zone in Nanling region and its emplacement dynamics for metallogenic series of W-Sn polymetalliclic deposits, Geology in China, 36, 483–489, 2009 (in Chinese with English abstract). Sun, X., Gong, Q., Wang, Q., Yang, L,. Wang, C., and Wang, Z.: Application of local singularity model to delineate geochemical anomalies in Xiong’ershan gold and molybdenum ore district, Western Henan province, China, J. Geochem. Explor., 107, 21– 29, 2010. Wang, W., Zhao, J., Cheng, Q., and Liu, J.: Tectonic–geochemical exploration modeling for characterizing geo-anomalies in southeastern Yunnan district, China, J. Geochem. Explor., 122, 71–80, 2012. Yilmaz, I.: Landslide susceptibility mapping using frequency ratio, logistic regression, artificial neural networks and their comparison: A case study from Kat landslides (Tokat–Turkey), Comput. Geosci., 35, 1125–1138, 2009. Zhao, J., Chen, S., Zuo, R., and Carranza, E. J. M.: Mapping complexity of spatial distribution of faults using fractal and multifractal models vectoring towards exploration targets, Comput. Geosci., 37, 1958–1966, 2011. Zhao, P. D.: Quantitative mineral prediction and deep mineral exploration, Earth Sci, Frontiers, 14, 1–10, 2007 (in Chinese with English abstract). Zhao, P. D. and Chi, S. D.: Discussion of geo-anomaly, Earth Sci., 16, 241–248, 1991(in Chinese with English abstract). Zhao, P. D., Chi, S. D., and Chen, Y. Q.: A thorough investigation of geo-anomaly: a basis of metallogenic prognosis, Geol. J. China Universities, 2, 361–373, 1996 (in Chinese with English abstract). Zhou, X. M. and Li, W. X.: Origin of Late Mesozoic igneous rocks in Southeastern China: implication for lithosphere subduction and underplating of mafic magmas, Tectonophysics, 326, 269– 280, 2000. Zuo, R. and Cheng, Q.: Mapping singularities – a technique to identify potential Cu mineral deposits using sediment geochemical data, an example for Tibet, west China, Mineral. Magazine, 72, 531–534, 2008. Zuo, R., Cheng, Q., Agterberg, F. P., and Xia, Q.: Application of singularity mapping technique to identify local anomalies using stream sediment geochemical data, a case study from Gangdese, Tibet, western China, J. Geochem. Explor., 101, 225–235, 2009a. Zuo, R., Cheng, Q., Xia, Q., and Agterberg, F. P.: Application of fractal models to distinguishing between different mineral phases, Math. Geosci., 41, 71–80, 2009b. Zuo, R., Cheng, Q., Xia, Q., and Agterberg, F. P.: Application of fractal models to characterization of vertical distribution of geochemical element Concentration, J. Geochem. Explor., 102, 37– 43, 2009c. Zuo, R., Carranza, E. J. M., and Cheng, Q.: Fractal/multifractal modelling of geochemical exploration data, J. Geochem. Explor., 122, 1–3, 2012. Zuo, R., Xia, Q., and Zhang, D.: A comparison study of the C–A and S–A models with singularity analysis to identify geochemical anomalies in covered areas, Appl. Geochem., 33, 165–172, 2013.
Nonlin. Processes Geophys., 20, 445–453, 2013