EVALUATION OF MACHINE SHOP LOGISTIC ALTERNATIVES USING SIMULATION Edward J. Williams Dean Darwactor Lisa Shorkey 2251 Engineering Complex, Department of Industrial and Manufacturing Systems Engineering University of Michigan – Dearborn Dearborn, Michigan 48128 U. S. A. E-mail:
[email protected]
KEYWORDS Machining operations, logistics, process simulation ABSTRACT Manufacturing, one of the first economic sectors to use simulation, has long been one of its most prolific users. In recent years, simulation, once used almost exclusively in large corporations with dedicated analytical staff, has achieved acceptance in smaller and smaller companies. In this study, a team of engineers and managers employed by a small, specialized company collaborated with simulation analysts from the University of Michigan – Dearborn to assess the potential merit of a proposed major reorganization of production. INTRODUCTION The client company in this study is relatively small (about two dozen employees) and was formed by the merger of two smaller companies four years ago. The company is primarily a Tier 2 automotive industry supplier, inasmuch as most of its business consists of ultra-precision prototyping and grinding of parts sold to Tier 1 automotive industry suppliers (those suppliers who sell parts directly to major automotive manufacturers). Most jobs are small production runs of parts produced to explicit customer order via a series of idiosyncratic steps; hence the company is a job shop (Sipper and Bulfin 1997). At the end of 1999 this client company began manufacturing three types of couplings, all of which are threaded, barbed, or tapered. During the past six months, orders for these couplings have increased significantly, and client managers expect this increase in demand to continue. On the other hand, competition, including overseas competition, is increasing apace. Therefore, these managers wish to continue machining the couplings, while decreasing per piece cost and simultaneously increasing volume. Company management was considering undertaking a significant capital expenditure for the purchase of a separate facility dedicated to production of the three types of couplings via a revised machining process, but demurred pending the
availability of analytically quantitative predictions of the consequences. The value of simulation for this purpose, in the conceptual sense of “making mistakes quickly and cheaply in a virtual context,” is documented in a variety of studies and contexts; see, for example, (Lopatenok 2000), (Mosca et al. 1999), and (Arer and Özdemirel 1997). OVERVIEW OF CURRENT OPERATIONS The operations modeled in this project comprised those immediately pertinent to the production of aluminum couplings for polyvinyl chloride pipes widely used in the telecommunications industry. Polyvinyl chloride pipes combine low cost with severe mechanical weakness and notch sensitivity, but excellent resistance to chemicals (El Wakil 1998); hence their suitability, in buried cable applications, in which mechanical strength is immaterial but imperviousness to caustic agents is vital. The couplings are used to connect PVC tubing that in turn protects buried fiber optic cabling. The tubing has sufficient strength to protect the fiber optic cables from ground movement and inclusions – i.e. rocks, stones, etc. – while being economical and readily available. As noted above, the client company is traditionally an automotive supplier; this application represents a deliberate diversification from the company’s core business. Such diversification is expected to at least partially insulate the company from the notoriously volatile and cyclical economic status of the automotive economic sector, particularly in southeastern Michigan (Levin 2001). The couplings are produced in three different sizes, here referred to as sizes “A,” “B,” and “C,” according to customer demand. Size “A” couplings are purchased as raw material pre-cut to the correct size; the other two sizes “B” and “C” are purchased as pipes which are originally three and six meters long, respectively, and must be sawed to size in the client’s facility before machining operations can begin. Originally uncut pipe can be either cut to size by a saw and then moved to a machining operation, or loaded into a computer numerically controlled [CNC] machine which coalesces the sawing and machining operations. The shop has a total of four machines: one saw and three CNC
25% Size A
Lathe A
Lathe B
Turning
Ship or Scrap Ship or Scrap
75% 60% Lathe A
Lathe B
Ship or Scrap
Saw
Turning
Ship or Scrap
Sizes B and C
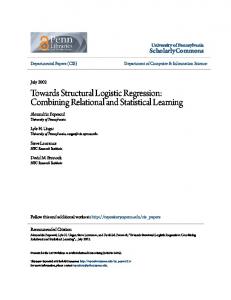
40% Figure 1: Overall Process Flow
machines (two lathes and one turning machine). However, only one of these three CNC machines can saw incoming pipe. A summary of this process flow is shown in Figure 1 above. The client performs extensive in-process quality inspections and no instances of low, or even deteriorating, quality have emerged recently. Regular preventive maintenance is performed on each of the three CNC machines during the first thirty minutes and the last thirty minutes of each nine-hour shift. Downtime occurs on these CNC machines due to either tool failure (unpredictable) or accumulation of chips (predictable). One of the CNC machines has a chip-removal conveyor and consequently suffers only tooling-induced downtimes. At the other two machines, the operator removes chips whenever the machine runs out of parts, forcing the operator to fetch a fresh batch of parts. The chips represent marketable scrap, although, as would be expected, the sale price of the scrapped chips represents a loss relative to the original cost of raw material. The client was considering purchasing capital funds for the purchase of another building dedicated to the machining of these three sizes of couplings. However, before accepting this risk, its management wished to evaluate the current machining process and the one proposed for the hypothetical new building by comparative simulations. Specifications for the two simulation models required that the client be able to assess the effects of changes in resource cost, percentage of pre-cut and uncut material purchased, machine allocation, and resource [worker] allocation by changing parameters. The client’s managers and engineers planned to use these two models “side-by-side” to both obtain an accurate assessment of current costs per part and search for an alternative to reduce those costs (the aggressive target being a 40% reduction in costs).
DATA COLLECTION The most difficult data to collect and analyze were the data on arrival of raw materials (pre-cut for size “A,” pipes for sizes “B” and “C”). Since the company had been manufacturing these couplings for only a year, and since orders typically were for large quantities, hence occurring seldom, very few data points were available. These sparse data points (only nine for size “A,” seven for size “B,” and six for part “C”) were examined to characterize interarrival times of orders and quantities of raw material arriving. Examination of each of these six data sets (three of interarrival times and three of incoming order sizes) for normality using a normal probability plot available in MinitabÔ (Ryan and Joiner 2001) indicated approximate normality – a shaky assumption at best due to the small size of these data sets. Of greater consequence, these data were strongly positively correlated: a large time interval between two successive arrivals tended, as might be expected, to end with the arrival of a large order. Hence, raw material arrival times and quantities of raw material arriving were modeled as correlated bivariate normal (Banks et al. 2001). Analysis of this system also required data concerning times required for each of the four machines and the workers operating them to complete certain tasks. The machines were “semi-automatic” – that is, they required intervention from a worker at the beginning and at the end of a cycle (for example, to load or unload workpieces), but needed no attention from a worker in the central portion of a cycle. Collecting data on the lengths of automatic cycles was routine, but collecting data on manual operations encountered the Hawthorne effect – a psychological phenomenon in which the very act of observing a worker’s performance changes that performance (Kroemer and Grandjean 1997). Ultimately,
the danger of data contamination by this effect faded for three reasons: a) Strong interpersonal skills of the two team members who collected these data enabled them to develop rapport with the workers being observed; b) Data collection over an extended period of time helped these team members to become psychologically inconspicuous; c) A large reservoir of trust of the workers in their management, painstakingly established over a long period of time by enlightened management practices, helped the workers trust assurances that data were being collected for process improvement, not as a prelude to censure. As an additional precaution, a few atypical data points collected early (while being observed was still psychologically a novelty to the workers) were discarded if clearly shown to be outliers. MODEL CONSTRUCTION, VERIFICATION, AND VALIDATION Model Construction The model was built using the ProModelÔ software (Harrell and Price 2000) routinely used for simulation instruction and project work at the University of Michigan – Dearborn. This software provided many built-in constructs useful in this analysis, such as the ability to model workstations needing manual intervention during only a specified portion of their work cycles, and the ability to construct path networks along which material-handling vehicles transport work-in-progress from one workstation to another. ProModel Ô resources represented workers using this material-handling equipment. However, the total number of entities (pieces of raw material and couplings in various stages of fabrication) circulating in the initial model was so large that model performance became dramatically and unacceptably slow. The analysis team therefore decided to let one ProModelÔ entity represent ten couplings during machining processes. This coalescence of entities has long been characteristic of simulation in the food and beverage processing industry; for example, an entity may represent a case of bottles, not an individual bottle (Gittlitz 1990). Run times then shortened by a factor of more than 10, since some processing algorithms typical of simulation software have run times of worse-than-linear order relative to the lengths of the current and future events chains (Schriber and Brunner 2000). Model Verification Several methods of model verification were used. Counters specifying the amount of work in process, cumulative numbers of couplings completed at each machine, number of boxes of each part type, and amount of accumulated scrap for sale were added to the model; these counters updated
dynamically on the animation screen. Inserting “PAUSE” statements, which momentarily stop model execution and allow the analyst to check the status of intermediate results, made other checks possible. This technique was used to verify that the correct resource was being used to transport boxed parts to storage from the various machines, and to verify that the saw operator was loading the correct type of parts into the saw. Model Validation To undertake model validation, in view of the importance of sparse data concerning arrival quantities and intervals, a separate, very small submodel containing only the arrival process was built and shown to the client. The client deemed the characterization described above, using a correlated bivariate normal distribution, unacceptable; indeed arrival times and quantities of raw materials failed a Turing test (Law and Kelton 2000). Replacing this method by empirical arrival generation using the available data to drive a discrete empirical distribution yielded only a very slight improvement. The client then pointed out that their suppliers do not require ordered quantities to be chosen from a small set of specified values. Changing the empirical distribution from discrete to continuous (i.e., allowing interpolation), which required only several mouse clicks, then produced an arrival process which passed a Turing test. Since this validation step involved a submodel, it permitted direct client involvement when the client would otherwise have been in abeyance awaiting results from the primary model. This ongoing client involvement, highly recommended by Musselman (1994), maintained high client interest and helped achieve model credibility. Also, the model was run under a hypothesized 50% increase and under a hypothesized 50% decrease in arrival rate of raw materials (both deliberately chosen implausibly large). Examination of performance metrics, such as queue lengths, machine utilizations, and amount of completed work, confirmed that they all moved in the correct numerical direction. Another validation item was the confirmation that the fixed ¾-hour meal break during each shift could be ignored, since all work was suspended during that time. OUTPUT ANALYSIS AND RESULTS A second model was constructed from the base model of the current system by: a) Reassigning specified workers to fetch raw materials and box completed couplings, thereby freeing the two lathe operators to concentrate on machining work; b) Revising the part routings so machines are more nearly dedicated to couplings by size (the current job shop thus approaches the definition of “flow shop”) (Pinedo 1995); c) Removing the saw – in view of (b) above, raw material arriving as pipe is directed only to the CNC
machine capable of sawing the pipe before undertaking actual machining work. This revised model represented the proposed system. In view of the client’s objective of studying system performance metrics (e.g., cost per part, elapsed time, and machine and worker utilization) during the fabrication of a menu of specified, typical, incoming orders, the models were run on a terminating basis. Examination of outputs proved that, for both models, twenty replications were ample to support the construction of sufficiently narrow confidence intervals for performance metrics, the client having specified a significance level of α = 0.05. To enhance the comparability of results from the current and the proposed system, the technique of common random numbers [CRN] was used to reduce the variance of estimated differences in performance metrics (Goldsman and Tokol 2000). Comparative results showed the economic performance of the proposed system to be markedly worse than that of the current system, both in throughput rates and in the key costper-part metric. The client’s management was thus forewarned of a potentially expensive error. Therefore, these managers decided to shelve plans for the intended highly committal and disruptive capital expenditure of a new building until significant improvements to the current process could be identified and confirmed. Also, the results confirmed not only that the saw should be kept, but also that allocation of a specific worker to the saw was unnecessary and expensive. SUMMARY AND CONCLUSIONS In addition to warning its client away from an expensive error, this project successfully introduced engineers and managers of a small company to the methods, capabilities, and limitations of simulation. Evidence of the client’s high interest in simulation appeared repeatedly in the form of requests for additional models and analyses. Due to the time constraints imposed on this project, these requests were regretfully declined in the short term. However, one of the authors has agreed to continue work with the client as the definition of the senior engineer “capstone” project. This work will investigate potential revisions to machining processes, alternative manufacturing methods, and rearrangement of the layout of the shop floor. ACKNOWLEDGMENT Dr. Onur M. Ülgen, a full professor at the University of Michigan – Dearborn and also president of Production Modeling Corporation (a simulation, scheduling, and analytical consulting firm in Dearborn, Michigan) graciously contributed valuable criticisms and suggestions improving the content and clarity of this paper. Suggestions of an anonymous referee were also very helpful.
REFERENCES Arer, M. Murat, and Nur E. Özdemirel. 1997. Simulation of Capacity Expansion and Sequencing Alternatives for a Make-toOrder Sheet Metal Producer. In Proceedings of the 11th European Simulation Multiconference, editors Ali Rõza Kaylan and Axel Lehmann, 336-343. Banks, Jerry, John S. Carson, II, Barry L. Nelson, and David M. Nicol. 2001. Discrete-Event System Simulation, 3rd edition. Upper Saddle River, New Jersey: Prentice-Hall, Incorporated. El Wakil, Sherif D. 1998. Processes and Design for Manufacturing, 2nd edition. Boston, Massachusetts: PWS Publishing Company. Gittlitz, Stuart. 1990. A Case Study: Simulation of Packaging Line Control Logic. In Proceedings of the 1990 Winter Simulation Conference, editors Osman Balci, Randall P. Sadowski, and Richard E. Nance, 699-708. Goldsman, David, and Gamze Tokol. 2000. Output Analysis Procedures for Computer Simulations. In Proceedings of the 2000 Winter Simulation Conference, Volume 1, editors Jeffrey A. Joines, Russell R. Barton, Keebom Kang, and Paul A. Fishwick, 39-45. Harrell, Charles, and Rochelle N. Price. 2000. Simulation Modeling and Optimization Using ProModel. In Proceedings of the 2000 Winter Simulation Conference, Volume 1, editors Jeffrey A. Joines, Russell R. Barton, Keebom Kang, and Paul A. Fishwick, 197-202. Kroemer, K. H. E., and E. Grandjean. 1997. Fitting the Task to the Human, 5th edition. London, UK: Taylor & Francis Limited. Law, Averill M., and W. David Kelton. 2000. Simulation Modeling and Analysis, 3rd edition. Boston, Massachusetts: The McGrawHill Companies, Incorporated. Levin, Doron. 2001. Don’t Fret Over Michigan Recession. Detroit Free Press 170(308) [8 March 2001]:E1 Lopatenok, Velery. 2000. Simulation in Industrial Manufacturing. In Proceedings of the Second International Conference on Simulation, Gaming, Training and Business Process Reengineering in Operations, editors Yuri Merkuryev, Birger Rapp, and Galina Merkuryeva, 91-95. Mosca, Roberto, Maurizio Schenone, Alessandra Frigato Bonello, and Flavio Tonelli. 1999. Internal Material Handling Rationalisation, Through Simulative Approach, of a Company Producing Automotive Components. In Proceedings of the 1999 Harbour, Maritime & Industrial Logistics Modelling and Simulation Conference, editors Agostino G. Bruzzone, Yuri A. Merkuriev, and Roberto Mosca, 284-290. Musselman, Kenneth J. 1994. Guidelines for Simulation Project Success. In Proceedings of the 1994 Winter Simulation Conference, editors Jeffrey D. Tew, Mani S. Manivannan, Deborah A. Sadowski, and Andrew F. Seila, 88-95. Pinedo, Michael. 1995. Scheduling Theory, Algorithms, and Systems. Englewood Cliffs, New Jersey: Prentice-Hall, Incorporated. Ryan, Barbara, and Brian L. Joiner. 2001. MinitabÔ Handbook, 4th edition. Pacific Grove, California: Brooks/Cole. Schriber, Thomas J., and Daniel T. Brunner. 2000. Inside DiscreteEvent Simulation Software: How It Works and Why It Matters. In Proceedings of the 2000 Winter Simulation Conference, Volume 1, editors Jeffrey A. Joines, Russell R. Barton, Keebom Kang, and Paul A. Fishwick, 90-100. Sipper, Daniel, and Robert L. Bulfin, Junior. 1997. Production: Planning, Control, and Integration. New York, New York: The McGraw-Hill Companies, Incorporated.
AUTHOR BIOGRAPHIES EDWARD J. WILLIAMS holds bachelor’s and master’s degrees in mathematics (Michigan State University, 1967; University of Wisconsin, 1968). From 1969 to 1971, he did statistical programming and analysis of biomedical data at Walter Reed Army Hospital, Washington, D.C. He joined Ford in 1972, where he works as a computer software analyst supporting statistical and simulation software. Since 1980, he has taught evening classes at the University of Michigan, including both undergraduate and graduate simulation classes using GPSS/HÔ, SLAM IIÔ, SIMANÔ, or ProModelÔ. He is a member of the Association for Computing Machinery [ACM] and its Special Interest Group in Simulation [SIGSIM], the Institute of Electrical and Electronics Engineers [IEEE], the Institute of Industrial Engineers [IIE], the Society for Computer Simulation International [SCS], and the Michigan Simulation Users' Group [MSUG].. He serves on the editorial board of the International Journal of Industrial Engineering – Applications and Practice. During the last several years, he has given invited plenary addresses on simulation and statistics at conferences in Monterrey, México; İstanbul, Turkey; Genova, Italy; and Rīga, Latvia. DEAN DARWACTOR is currently in his senior year of a bachelor’s degree in Industrial & Manufacturing Systems at the University of Michigan – Dearborn. His concentration is in manufacturing systems and optimization of manufacturing processes. From 1989-1997 he worked at K. J. Law, Engineers, Incorporated, Novi, Michigan, first as a Field Service Technician and later as an Applications Specialist. Primary responsibilities included programming and integration of automated gauging systems with a Tier 1 supplier and end user manufacturing equipment. At K. J. Law, he was assigned to coordinate a research and development team which investigated a competitive solution to an air-to-electronic converter module. This team was very successful, resulting in a new company product. Joining Atlas Copco Tools, Incorporated, Farmington Hills, Michigan in 1997, he managed the electric product department’s special applications and engineering functions including research, development and manufacturing of custom interfaces. He has worked as a project manager for Atlas Copco Assembly Systems in Sterling Heights, Michigan since January 2001. He is a member of Alpha Pi Mu engineering honor society and will be pursuing a master’s degree in Industrial Engineering in 2002. LISA M. SHORKEY holds a bachelor’s degree in Electrical and Computer Engineering (Wayne State University, 1990). She joined EDS in 1991, where she worked in embedded systems software development, specializing in software requirements analysis. In 1994 she joined Ford Motor Company, where she continued to work in embedded systems software development. She was part of a team that implemented the Capability Maturing Model Levels 1 through 3 in the software development process at Visteon. In
1999, she joined the Ford RVT E/E Climate Control group. She is currently the E/E climate control application engineer on all Ford truck programs. Since 1996 she has been working on her master’s degrees in business and industrial & manufacturing engineering (University of Michigan), to be completed in 2002.