International Journal of Fluid Machinery and Systems Vol. 2, No. 1, January-March 2009
Original Paper
Application of Surrogate Modeling to Design of A Compressor Blade to Optimize Stacking and Thickness Abdus Samad and Kwang-Yong Kim Department of Mechanical Engineering, Inha University Incheon, Republic of Korea Abstract Surrogate modeling is applied to a compressor blade shape optimization to modify its stacking line and thickness to enhance adiabatic efficiency and total pressure ratio. Six design variables are defined by parametric curves and three objectives; efficiency, total pressure and a combined objective of efficiency and total pressure are considered to enhance the performance of compressor blade. Latin hypercube sampling of design of experiments is used to generate 55 designs within design space constituted by the lower and upper limits of variables. Optimum designs are found by formulating a PRESS (predicted error sum of squares) based averaging (PBA) surrogate model with the help of a gradient based optimization algorithm. The optimum designs using the current variables show that, to optimize the performance of turbomachinery blade, the adiabatic efficiency objective is improved substantially while total pressure ratio objective is increased a very small amount. The multi-objective optimization shows that the efficiency can be increased with the less compensation of total pressure reduction or both objectives can be increased simultaneously. Keywords: Compressor Blade, Optimization, Surrogate Modeling, Stacking Line, Thickness of Blade, Efficiency
1. Introduction Optimization techniques combined with three-dimensional numerical analysis of flow field have reduced the experimental expenses to design turbomachinery blades in recent years. Flow field inside a transonic axial compressor is extremely complex due to three-dimensional, unsteady and vortical flow structure in the blade passage. However, with recent development of computational fluid dynamics (CFD), accuracy of prediction for the flow becomes acceptable for the purpose of blade design. On the other hand, systematic design process using various optimization techniques becomes widely used replacing the trial and error approaches for turbomachinery blade design. Flow analysis for NASA rotor 37, a transonic axial compressor rotor has been discussed in details in AGARD advisory report [1] and by Reid and Moore [2]. As the test data are available in these references, many researchers have made efforts to validate their computational codes, and also to optimize the rotor. The efforts for design optimization include single objective as well as multi-objective and multi-disciplinary optimizations. The blade shape defining stacking line, airfoil shapes, etc. are modified to get better efficiency, pressure ratio, surge margin, etc. A set of papers contributed to single and multi-objective optimizations of turbomachines to enhance their performance. It has been reported that the efficiency is increased due to movement of separation lines towards downstream direction reducing the separation vortex, end-wall losses, etc. Samad et al. [3] reported on the optimization of stacking line of blade with three objectives, i.e., efficiency, total pressure, and total temperature using several different surrogate models. Jang and Kim [4] and Yang et al. [5] also reported the modifications of stacking line of compressor blade by optimization. Multi-disciplinary and multiple operating point optimizations at fixed rotor rotational speed were reported by Pierret et al. [6]. Oyama et al. [7] reported blade profile modification with the help of B-spline curve of NASA rotor 67 to increase adiabatic efficiency by 2%. Chen et al. [8] optimized camber line, thickness distribution and stacking line by polynomial curve to define compressor blade and gained 1.73% improvement of adiabatic efficiency. Maximum camber location effect was studied by Chen et al. [9]. Benini [10] defined blade section profiles by Bezier curve using multi-objective optimization considering total pressure ratio and adiabatic efficiency as objectives for design of a compressor blade. He employed camber line and thickness profile as design parameters. Keskin and Bestle [11] reported Bezier curve parameterization of blade shape to optimize with Pareto optimal design. Total pressure enhancement modifying hub curve and sweep of blade using Bezier curve has been reported by Wu et al. [12]. Optimization of controlled diffusion compressor blade has been reported by Sanger [13]. Received October 3 2008; accepted for publication November 12 2008: Review conducted by Prof. Huang Diangui. (Paper number O08029) Corresponding author: Kwang-Yong Kim, Professor,
[email protected]
1
The surrogate models being used widely in multi-disciplinary optimizations should be evaluated in two important aspects; computational economy that requires as few data points as possible for constructing a surrogate model, and accuracy in representing the characteristics of the design space. Queipo et al. [14] and Li and Padula [15] reviewed various surrogate based models used in aerospace applications. Goel et al. [16] developed weighted average surrogate model and concluded that weighted average surrogate model is more reliable prediction method than individual surrogates. Samad et al. [3, 17] reported on the performances of several surrogate models in optimizing a heat transfer augmentation device and a turbomachinery blade shape, respectively, and presented that weighted average surrogate model developed by Goel et al. [16] is reliable in prediction. In the present work, three-dimensional Reynolds-averaged Navier-Stokes (RANS) analysis coupling with a weighted average surrogate method has been used to find optimum blade shapes of a transonic axial compressor rotor (NASA rotor 37) to enhance its adiabatic efficiency and total pressure ratio. Blade stacking line and thickness are defined by six design variables and modified with the help of Bezier polynomial. Single and multi-objective optimizations have been performed and several optimum designs are presented.
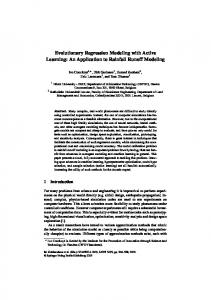
2. Numerical Formulation NASA rotor 37 [2], an axial-flow compressor rotor having a low-aspect ratio, is used for blade shape optimization. The detailed specifications of the compressor are summarized in Table 1. The blade airfoil sections are defined by multiple-circular-arc (MCA). The rotor tip clearance is 0.356 mm (0.45 percent span). The measured choking mass flow rate is 20.93 kg/s, which corresponds to 103.67% of the design flow rate. The meridional view of the axial compressor is shown in Fig. 1. Flow parameters like total pressure, total temperature, adiabatic efficiency, etc. in relation to the mass flow rates are measured at inlet (station 1) and outlet (station 2). These stations are located at 41.9 mm upstream of the tip leading edge of the rotor and at 101.9 mm downstream of the tip trailing edge of the rotor, respectively. The commercial code ANSYS-CFX 11.0 [18] is used for flow analysis. Blade profile creation, computational mesh generation, initial and boundary condition definitions and flow simulation are performed by Blade-Gen, Turbo-Grid, CFX-Pre, CFX-Solver, respectively. Structured grid system with O-type grids at near blade surface and H-type grids at the other zones are employed. The O-grid having width factor 0.5 and 15 elements is assigned to shroud tip clearance. Nodes in at blade to blade and streamwise direction are 46 and 119, respectively. The inlet and outlet blocks contain 30,000 grid points each and the main passage contains 240,000 grid points, approximately. Approximately, total 300,000 nodes are used for computations for a blade passage consisting of single blade out of 36 blades of the compressor considered. The number of grid points is selected after generating different meshes with different resolution at near wall, tip and other zones, etc. The inlet total temperature and total pressure are set to 288.15K and 1.0atm, respectively. The design flow rate which is 0.56083 kg/s per passage is set at outlet. Steady state simulation with air as ideal gas is considered. The three-dimensional finite element based finite volume method is used to discretize the governing equations. Thus, the solver retains the geometric flexibility of the finite element method as well as the important conservation properties of the finite volume method. Each node is Table 1 Design specifications of NASA rotor 37 Mass flow, kg/s
20.19
Rotational speed, rpm
17188.7
Pressure ratio
2.106
Inlet hub-tip ratio
0.7
Inlet tip relative Mach no.
1.4
Inlet hub relative Mach no.
1.13
Tip solidity
1.288
Rotor aspect ratio
1.19
Number of rotor blades
36
Fig. 1 Meridional view of Rotor 37
2
surrounded by a set of surfaces that define the control volume. All the solution variables and fluid properties are stored at the element nodes. However, various terms in the equations require solutions or solution gradients to be approximated at integration points. Finite element shape functions are consequently used to evaluate the solution and its variation within mesh elements. Adiabatic walls with no slip and hydraulically smooth walls are considered at solid boundaries. Periodic boundary is set at the blade passage interface, and tip clearance is modeled. In boundary setting, viscous work is included, and 5% turbulence intensity is assigned at inlet. The grid resolution is made near wall region in such a way that scalable wall function can work with k-ε model. The k-ε model is stable and numerically robust and has a well established regime of predictive capability [18]. The most difficult task in transonic flow is to get properly converged solution. In AGARD advisory report [1], the conditions reported for convergence are such that the calculated mass flow for rotor 37 blade at the inlet should match the mass flow at the exit within 0.017%, and deviation in mass flow should be within 0.004% for the last 200 iterations. Hence, the similar conditions were checked for the present calculations at the design flow rate. As current problem contains number of different geometries to simulate, some cases were producing large mass imbalance although the residual criteria were fulfilled. Time scale, RMS value and number of iteration for those cases were changed so that the mass imbalance becomes lower. In general, residual target were set to 3.0E-05 (=RMS) and imbalances were kept below 1.0E-02. Time scale was kept smaller initially and gradually increased to make faster and better convergence. Number of iterations was about 500 for a single converged solution, and CPU time for single simulation is approximately 8 hours in a personal computer with an Intel Pentium IV CPU of 3.0 GHz speed. Benini [10] and Beheshti et al. [19] also reported on the simulations for NASA rotor 37 using same computer code. They used approximately 240,000 grid points and set convergence criteria to RMS=5.0E10-7 and 1.3E-5, respectively.
3. Objective Function and Design Variables In the present study, adiabatic efficiency (ηad) and total pressure ratio (Pt) which are to be maximized are selected as objective functions for the shape optimizations of the rotor blades. These objectives are defined as follows:
FEff =ηad =
(Pt )(k−1) / k −1 T0exit T0inlet −1
FPt = Pt = P0exit / P0inlet
(1)
(2)
where, P0 and T0 are total pressure and total temperature, respectively. Another objective, Fwf is formulated using the weighted sum of the objectives to make multiple objectives into a single objective Here, the above defined objectives, FEff and FPt are combined with a weighting factor, wf and formulated as:
Fwf = FEff + w f FPt
(3)
where, value of wf is simply a ‘designer’s choice’. This multi-objective approach has also been reported in the other works [3, 17]. Here, these three single objectives (FEff, FPt and Fwf) are to be maximized. Hence, two designs for maximization of efficiency and maximization of total pressure are presented and a set of designs changing value of wf has been presented for combined objective (Fwf). The design variables are defined by Bezier curve of degree n. The main advantage of parameterization of the blade curves by Bezier curve is that some limited number of points called control points can control the curves and the curves are smooth and free from discontinuities. The blade shape can be changed by moving the control points. A Bezier curve of order n is defined by the Bernstein polynomials: n
C (t ) = ∑ Bi ,n (t ) Pi
(4)
⎛n⎞ Bi ,n (t ) = ⎜⎜ ⎟⎟t i (1 − t ) n−1 ⎝i⎠
(5)
i =0
where, Bezier blending function is as follows:
n
If Pi = (xi,yi), then x(t ) = ∑ xi Bi ,n (t ) and y (t ) = i =0
n
∑yB i =0
i
i ,n
(t ) .
Here, t denotes the parameter of the curve normalized in [0 1] and Pi are the coordinates of the control points. The control points of Bezier curve are considered variables. In present problem, to reduce the number of designs, some control points are kept fixed and only five control points are defined each for camber line and thickness distributions. The blade tip control points are moved equally normal to the chord line so that blade can be leaned. Hence a single variable is considered for blade tip-leaning. Similar movement of control points of mid span camber line produces one more variable. Therefore, two design variables are produced among 10 control parameters: the variables at tip and mid span of blade to define lean (γ). Figure 2 (a) shows the definition of blade lean. The blade sections from hub to tip are interpolated by cubic spline curve. The cubic spline interpolation is a piecewise continuous curve passing through each of the coordinates. Points [xi, yi], i=1,2,…,n for the function y=f(x) produces n+1 points with n intervals. There is separate cubic polynomial for each interval, each with its own coefficients and the polynomials become:
3
(a) Blade lean
(b) Thicknesses Fig. 2 Definitions of variables
Si (x)=ai (x–xi )3+bi(x-xi )2+ci (x–xi )+di,
x ∈ [ xi , xi +1 ]
(6)
where, coefficients a, b, c and d are functions of x. Together, these polynomial segments are denoted as S(x). Since there are n intervals and four coefficients for each, it requires total 4n parameters to define the spline S(x). Airfoil thicknesses are also defined by Bezier curve and the definitions of variables from thickness are shown in Fig. 2(b). The multiple circular arc (MCA) profile of blade is defined by Bezier polynomial of five control points; P1, P2, P3, P4 and P5. As similar curves are used for hub and tip, hence total control points are coming to be ten. The point P3 is moved normal to the chord line (α) and along the chord line (β) and P3 at hub produces two design variables. Other control points (P1, P2 P4 and P5) are kept fixed. Similarly P3 at tip produces two more variables while other control points are kept fixed. Hence, the among 20 control parameters, 6 design variables are selected for optimization. Variable α is considered positive if the control point P3 is moved from chord line and variable β is considered positive if the control point P3 is moved towards the trailing edge of the blade.
4. Optimization Methodology General optimization problem is defined as
Maximize F = F ( X ) Subject to G j ( X ) < 0, j = 1, m.
(7)
X il ≤ X i ≤ X iu , i = 1, n where, F is the objective function and X is a vector consisting of the design variables. Xil and Xiu are the lower and upper bounds on each design variable. The optimization procedure is shown in flow chart (Fig. 3). Initially, the variables and objective functions are defined. The design space constituted by Xil and Xiu is decided, and design points within design space are selected with the help of Latin hypercube sampling (LHS) as design of experiment (DOE) [20]. The objective function values at these design points are evaluated using flow solver, and surrogate based procedure is applied with these evaluations. Problem dependency of surrogates produces different data fitting and hence produces different optimal designs. As PRESS (predicted error sum of squares) based averaging (PBA) model is robust in prediction [3, 17], the design predicted by PBA is used in this work. This model is basically weighted average of the basic surrogates; second order polynomial response surface approximation (RSA) [21], radial basis neural network (RBNN) [22] and Kriging (KRG) [23]. PBA model which is originally WTA3 model suggested by Goel, et al. [16] and renamed by Samad et al. [3, 17] is adopted in the present investigation. The predicted response is defined as follows for the PBA model: N SM
Fˆ PBA ( x) = ∑ wi ( x) Fˆ i ( x)
(8)
i
where, NSM is the number of basic surrogate models used to construct weighted average model. ith surrogate model at design point
x produces weight w ( x ) , and Fˆ (x) is the predicted response by ith surrogate model. For the present problem, eqs. 7 and i i
4
8 can be written in simplified form as:
Fwt .avg = wRSA FRSA + wKRG FKRG + wRBNN FRBNN Xjl < xj < Xju , j= 1,2, 3, …,6.
(9)
where, FRSA, FKRG or FRBNN is constructed using RANS evaluated responses. No constraint is applied in the present problem. Weights are decided such that the basic surrogate which produces higher error has lower weight, and thus lower contribution towards the final weighted average surrogate, and vice-versa. In this work, global weights are calculated from each basic surrogate using generalized mean square cross-validation error (GMSE) or PRESS (in RSA terminology), that is a global data-based measure of goodness. In cross validation (CV), the data is divided into k subsets (k-fold CV) of approximately equal size. A surrogate model is constructed k times, each time leaving out one of the subsets from training, and using the omitted subset to compute the error measure of interest. The generalization error estimate is computed using the k error measures obtained (e.g., average). If k equals the sample size, this approach is called leave-one-out CV (or PRESS). The weighting scheme used in PBA surrogate is given as follows:
Fig. 3 Optimization procedure
5
λ
⎞ ⎛ E wi* w = ⎜ i + ζ ⎟ , wi = ⎟ ⎜E ∑ wi* ⎠ ⎝ avg * i
i
Eavg =
Ei =
N SM
Ei
∑N i =1
; λ < 0, ζ < 1
(10)
SM
GMSE i , i = 1, 2,..., N SM
Two constants α and β are chosen as α = 0.05 and β = -1 [16]. After constructing the PBA model, sequential quadratic programming (SQP) [24] algorithm of optimization is used to search for optimal point from the PBA model. Since the SQP is dependent on initial guess of optimal point, hence a series of trials have been performed before getting the final optimal point from any surrogate. SQP is a gradient based search algorithm.
5. Results and Discussion Proper determination of design space constituted by lower and upper limits of the design variables is very important to reduce the iteration in present optimization procedure shown in Fig. 3. To decide the range of each variable, effects of each variable on objective functions are tested first. This needs some preliminary designs to simulate to set the ranges of variables. The design variables for blade lean are presented in radians, and those for blade thickness are defined in the form of percentage change as shown in Table 2. The surrogates are problem dependent and proper distribution of design points in design space is necessary for better constructions of surrogates. Better constructed surrogate implies a better curve fitting in surrogate model and less error in prediction of optimum design. As already stated, the PBA model having the property of robustness in prediction is used in this problem. The number of designs selected by LHS method on the basis of RSA model [25] is 55 for 6 design variables.
Table 2 Design space Limits of variables
Variables normal to chord line
Variables along chord line
Blade lean
αt (%)
αh (%)
βt (%)
βh (%)
γt (radians)
γm (radians)
Lower
-22.52
-6.00
-5
-5
-0.105
-0.035
Upper
22.52
6.00
15
15
-0.035
0.035
Table 3 Results of optimizations (a) design variables Designs
Variables normal to chord line
Variables along chord line
Blade lean
αt (%)
αh (%)
βt (%)
βh (%)
γt (radians)
γm (radians)
Ref
0.000
0.000
0.000
0.000
0.000
0.000
Eff_opt
-2.741
-4.034
7.048
12.267
-0.101
0.002
Pt_opt
6.379
4.804
0.932
6.675
-0.035
-0.003
Multi_opt
-1.432
-4.016
8.149
11.531
-0.094
-0.003
(b) Objective functions Designs
Predicted
RANS computed
% improvement
Fsurrogate
FPt
FEff
FPt
FEff
Ref
---
2.105
85.251
---
---
Eff_opt
86.74
2.055
86.684
-2.375
1.681
Pt_opt
2.115
2.110
85.762
0.238
0.599
Multi_opt
0.9966
2.067
86.681
-1.805
1.677
Fwf = 0.9908
6
Fwf = 1.23
Fig. 4 Result validations with experimental data Table 4 Weights assigned to surrogates to construct PBA model (c) For Multi_opt blade
(b) For Pt_opt blade
(a) For Eff_opt blade
Cross validation Weight error (Ecv) 0.060 0.295
Cross validation Weight error (Ecv) 6.78E-03 0.220
RBNN
Cross validation error (Ecv) 0.259
RSA
0.165
0.400
RSA
0.060
0.295
RSA
4.13E-03
0.353
KRG
0.197
0.339
KRG
0.042
0.410
KRG
3.38E-03
0.426
MODEL
Weight
MODEL
0.261
RBNN
MODEL RBNN
The above designs are evaluated using RANS solver to get the FPt, FEff and Fwf objectives. In multi-objective optimized (Multi_opt) design, Fwf is calculated with wf = 0.06. Table 3 represents the reference and optimum shapes and their objective function values. It is found that PBA gives excellent predictions for optimum efficiency and total pressure in comparison with the values calculated by RANS analysis. For efficiency optimized (Eff_opt) blade, the blade lean shows that if blade is moved towards the direction of rotation FEff is increased. The blade thickness is little reduced and maximum thickness is moved toward trailing edge (TE). The FEff is increased by 1.681% while FPt is reduced by 2.375% in this case. In the same table (Table 3), it is seen that the FPt and FEff are increased by 0.238% and 0.599%, respectively, in the case of total pressure ratio optimized (Pt_opt) blade. The blade moved towards the rotation direction. Maximum thickness is increased a little and maximum thickness is moved towards the trailing edge (TE). Although the paper describes about the blade thickness change which is having the mechanical consequences, the authors leave the problem considered in future works. Multi_opt blade shows the objective function Fwf (eq. 3) value is increased by 1.225% while FEff is increased by 1.677%, and FPt is reduced by 1.805% when wf=0.06 is assumed. The objective function values of optimum designs computed by RANS analysis presented in Fig. 4. Obviously, the FEff and FPt have increased in Eff_opt and Pt_opt blades in the vast operating range by this optimization, respectively. The Multi_opt results show that the adiabatic efficiency line is almost coinciding with the Eff_opt result line but total pressure ratio line is showing some difference with the same result. This is also seen from the Table 3(b) that the FEff for the Eff_opt blade is same as that of the Multi_opt blade while that of the FPt is different for these cases. The RSA, KRG and RBNN surrogates are constructed and errors in data fitting are calculated through their k-fold cross validation error. These errors are used to find PRESS and weights. Finally PBA model is constructed by as per eq. 9. In Table 4, the weights assigned to each surrogate (RSA, KRG or RBNN) to construct PBA model are presented. The least cross validation error (Ecv) is produced by RSA model and hence the weight assigned to RSA to construct PBA model is highest for Eff_opt blade (Table 4(a)). In the case of Pt_opt blade (Table 4(b)), the Ecv is equal for RSA and RBNN and hence weights are also equal for these surrogates. KRG produced lowest Ecv and hence the weight assigned to KRG is highest. For Multi_opt case (Table 4(c)) also, KRG produced highest weight as it produced least Ecv. As better performing surrogate is having lower error (Ecv), and hence higher weight is assigned to the surrogate by eq. 10. This protects PBA model from poor performance even when any surrogate performs bad for prediction. The performance of individual surrogate is strongly dependent on the problem as suggested by Samad et al. [3]. In present problem, the third objective (Fwf) which is the combination of FEff and FPt is made through a weighting factor; wf. Figure 5(a) shows variations of the six design variables and objective function (Fwf) values with weighting factor, wf when Fwf is optimized. The variables presented are normalized in 0 to 1 range. With increasing the contribution of FPt in Fwf, the objective function value increases. Variable of blade lean at tip (γt) gets increased while the variable of blade lean at mid point (γm) is not affected so much with increase of wf. Blade thicknesses (αt and αh) gets reduced while location of maximum thicknesses (βt and βh) of blade doses not change remarkably with the increase of wf. Here, it can be noticed that wf=0.0 implies the Eff_opt blade. Figure 5(b) shows the variations of FEff and FPt with wf. It is found that if one objective increases, other objective decreases with increasing weighting factor. Reference and optimized blade shapes are presented in Fig. 6.
7
αt βh Fwf
βt γm 1.2
0.75
1.1 1
0.5 0.25
0.9
0
0.8 0.12
0
0.04
wf
0.08
Fwf
Variable values
1
αh γt
(a) Variables and Fwf values
(b) FEff and FPt values
Fig. 5 Variables and objective function values with different weighting factors
Fig. 6 Reference and optimized blade shapes
Figure 7 shows the Mach number profiles at 10, 50 and 90 % of span for the reference and optimized blades (wf=0.06). Near hub (10% span), the Mach number profiles are almost same for the reference and optimized blades. Similar trend is also shown for the 50% span for all the three reference and optimized blades. However, this trend is changed for the near tip (90% span) region. The visible change is found in the case of Eff_opt and Multi_opt blades. The shock lines are moved towards TE, and the separation zone is also moved towards TE. The shock intensity is also reduced. For pressure optimized blade, the change is visible but less as compared to Eff_opt or Multi_opt blade. Another figure of Mach numbers (Fig. 8) on suction surfaces of the blades shows the shock beyond 50% span is moved towards TE in all cases. As the Pt_opt blade has the low increase in FPt and that’s the reason why increase in pressure has not affect much the flow structure. Figure 9 shows that streamlines on suction surface are change noticeably by the optimizations. The Eff_opt or Multi_opt blade shows the separation line is moved largely towards TE beyond 50% span of the blade. However, Pt_opt blade shows only slight changes. Pressure contours on blade suction surfaces are shown in Fig. 10. The contours near mid chord above 50% of span moved towards TE for the optimized blades. This shows the same pattern as the Mach number contours on suction surfaces shown in Fig. 8. The shock loss decreases with enlarging the front flat portion of the blade profile. The maximum thickness location is moved towards TE increasing the flat portion and hence increasing efficiency. The movement of separation lines towards TE has also been reported by Samad et al. [3] and Jang and Kim [4] by stacking line optimizations to enhance efficiency. Stacking line and airfoil profile modifications also produce the weaker shock strength [8]. As the blade thickness is changed and the blade is leaned due to optimization, a structural analysis can be performed to check the endurance limit and flutter of blade, this has not been studied in the present work.
8
(a) 10% span
(b) 50% span
(c) 90% span Ref
Eff_opt
Pt_opt
Fig. 7 Mach number contours at different span of blade
Fig. 8 Mach number contours on blade suction surfaces
9
Multi_opt
Fig. 9 Stream lines on blade surfaces (units are in ms-1)
Fig. 10 Pressure contours on blade surface (units are in atm) Blade loadings at different span locations are presented in Fig. 11. At mid-span, almost same loadings are shown for different blades. But, at near tip location (at 80% span), a large variation in loading is shown especially near leading edge on pressure surface for Eff_opt and Multi_opt blades which show almost same loading profiles. Pt_opt blade shows only some decrease in loading near leading edge on pressure surface in comparison with the reference blade.
6. Conclusion A transonic axial compressor blade shape has been optimized numerically to enhance its performance in terms of adiabatic efficiency and total pressure ratio. The design variables from blade stacking line and airfoil thickness have been considered. A weighted average surrogate (PBA) model is used for data fitting. Three single objectives (adiabatic efficiency, total pressure ratio and one combined objective of these two objectives) with six design variables are considered. When adiabatic efficiency is considered as objective, adiabatic efficiency is increased by 1.68% while total pressure ratio is reduced by 2.68%. And, when total pressure is considered as objective, the total pressure ratio is increased by 0.24% and adiabatic efficiency is increased by 0.60%. The multi-objective optimization combining these two objectives produced enhanced efficiency
10
150000
100000 50000 0 Ref Eff_opt Pt_opt Multi_opt
-50000 -100000
Loading (80% span), Pa
150000 Loading (50% span), Pa
Loading (20% span), Pa
150000
100000 50000 0 -50000 -100000
0
0.2
0.4
0.6
0.8
1
Streamwise location
(a)
100000 50000 0 -50000
-100000 0
0.2
0.4 0.6 0.8 Streamwise location
1
0
(b)
0.2
0.4 0.6 0.8 Streamwise location
1
(c)
Fig. 11 Blade loadings: (a) 20% span, (b) 50% span, and (c) 80% span. with less total pressure ratio decrement. For efficiency optimized blade, the separation and attachment lines moves towards trailing edge of blade enhancing the blade performance. The blade maximum thickness is reduced and moved towards the trailing edge increasing the flat portion of the blade front area. The blade maximum thickness is increased and moved towards the trailing edge for pressure optimized blade. Blade is leaned towards the rotational direction in both the pressure and efficiency optimized blades.
Acknowledgments The authors acknowledge the support from KISTI (Korea Institute of Science and Technology Information) under The Tenth Strategic Supercomputing Support Program.
Nomenclature a,b,c,d Bi,n(t) Ecv F GMSE k LE NSM P Pi Pt PRESS
Coefficients of cubic polynomials Bezier blending function Cross validation error Objective function Generalized mean square error Ratio of specific heat Leading edge Number of surrogate models Pressure Coordinates of control points Total pressure Predicted error sum of squares
T t TE wi wf x, y α β γ ηad ζ, λ
Temperature Normalized parameter of a curve Trailing edge weight for weighted average model Weight for weighted sum of objective model Spatial Coordinates Variable of normal to chord line Variable of along chord line Variable of blade lean Adiabatic efficiency Constants of PBA surrogate model
Subscripts avg inlet Eff exit
Average Inlet Efficiency Exit
h, m and t Pt wf 0
Hub, mid span and tip, respectively Total pressure ratio With weighting factor Total
References [1] Dunham, J., 1998, “CFD Validation for Propulsion System Components,” AGARD Advisory Report 355, ISBN 92-836-1075X. [2] Reid, L., and Moore, R. D., 1978, “Design and Overall Performance of Four Highly-Loaded, High-Speed Inlet Stages for an Advanced, High-Pressure-Ratio Core Compressor,” NASA TP-1337. [3] Samad, A., Kim, K. Y., Goel, T., Haftka, R. T., and Shyy, W., 2007, “Multiple Surrogate Modeling for Axial Compressor Blade Shape Optimization,” Journal of Propulsion and Power, (Accepted for publication). [4] Jang, C.M., and Kim, K.Y., 2007, “Applications of Numerical Optimization Techniques to Design of Axial Compressor Blades,” Journal of Aerospace Power, Vol. 22, No. 4, pp. 29-36. [5] Yang, L., Ouyang, H., and Hui, D. Z., 2007, “Optimization Design and Experimental Study of Low-Pressure Axial Fan with Forward-Skewed Blades,” International Journal of Rotary Machinery, Vol. 2007, Article ID 85275, 10 pages, doi:10.1155 /2007/85275. [6] Pierret, S., Coelho, R. F., and Kato, H., 2007, “Multidisciplinary and multiple operating points shape optimization of threedimensional compressor blades,” Structural and Multidisciplinary Optimization, Vol. 33, No. 1. pp. 61-70. [7] Oyama, A., Liou, M.S., Obayashi, S., 2004, "Transonic Axial-Flow Blade Optimization: Evolutionary Algorithms/ThreeDimensional Navier-Stoke Solver,” Journal of Propulsion and Power, Vol. 20, No. 4, pp. 612-619. [8] Chen, N., Zhang, H., Xu, Y., and Huang, W., 2007, “Blade Parameterization and Aerodynamic Design Optimization for a 3D
11
Transonic Compressor Rotor,” Journal of Thermal Science, Vol. 16, No. 2, pp. 105-114. [9] Chen, N.X., Zhang, H.W., Du, H., Xu, Y.J., and Huang, W.G., 2005, “Effect of Maximum Camber Location on Aerodynamic Performance of Transonic Compressor Blades,” ASME Turbo Expo 2005, Nevada, USA, GT2005-68541. [10] Benini, E., 2004, “Three-Dimensional Multi-Objective Design Optimization of a Transonic Compressor Rotor,” Journal of Propulsion and Power, Vol. 20, No. 3, pp. 559-565. [11] Keskin, A. and Bestle, D., 2006, “Application of Multi-Objective Optimization to Axial Compressor Preliminary Design,” Aerospace Science and Technology, Vol. 10, pp. 581–589. [12] Wu, H., Li, Q. and Zhou, S., 2007, “Optimization of Loaded Fan Rotor Based on Through Flow Model,” ASME Turbo Expo, Montreal Canada, GT2007-27603. [13] Sanger, N. L., 1983, “The Use of Optimization Techniques to Design-Controlled Diffusion Compressor Blading,” Journal of Engineering for power, Vol. 105, pp. 256-264. [14] Queipo, N. V., Haftka, R.T., Shyy, W., Goel, T., Vaidyanathan, R. and Tucker, P.K., 2005, “Surrogate-based analysis and optimization,” Progress in Aerospace Sciences, Vol. 41, pp. 1-28. [15] Li, W., and Padula, S., 2004, “Approximation Methods for Conceptual Design of Complex Systems,” Eleventh International Conference on Approximation Theory (eds. Chui, C., Neaumtu, M., Schumaker, L.). [16] Goel, T., Haftka, R., Shyy, W., and Queipo, N., 2007, “Ensemble of Surrogates,” Structural and Multidisciplinary Optimization, Vol. 33. No. 3, pp. 199-216. [17] Samad, A., Shin, D. Y., Kim, K. Y., Goel, T., and Haftka, R. T., 2007, “Surrogate Modeling for Optimization of a Dimpled Channel to Enhance Heat Transfer Performance,” Journal of Thermophysics and Heat Transfer, Vol. 21, No. 3, pp. 667-670. [18] Ansys CFX-11.0, 2006, Ansys Inc. [19] Beheshti, B. H., Teixeira, J. A., Ivey, P.C., Ghorbanian, K., and Farhanieh, B., 2004, “Parametric Study of Tip Clearance Casing Treatment on Performance and stability of a Transonic Axial Compressor,” Journal of turbomachinery, Vol. 126, pp. 527535, JMP® 5.1, 2004, SAS Institute, Inc. [20] Myers, R. H., and Montgomery, D. C., 1995, “Response Surface Methodology-Process and Product Optimization Using Designed Experiments,” John Wiley & Sons, Inc: New York. [21] Orr, M. J. L., 1996, “Introduction to Radial Basis Neural Networks,” Center for Cognitive Science, Edinburgh University, Scotland, UK. http://anc.ed.ac.uk/rbf/. [22] Martin, J. D., and Simpson, T. W., 2005, “Use of Kriging Models to Approximate Deterministic Computer Models,” AIAA Journal, Vol. 43, No. 4, pp. 853-863. [23] MATLAB®, The Language of Technical Computing, Release 14, 2004, The MathWorks Inc. [24] Guinta, A. A., 1997, “Aircraft Multidisciplinary Design Optimization Using Design of Experimental Theory and Response Surface Modeling Methods,” Ph. D. Dissertation, Department of Aerospace Engineering, Virginia Polytechnic Institute and State University, Blacksburg, VA.
12