thalamotomy, pallidotomy, and subthalamic nucleus deep-brain stimulation. The average displacement was 3.21mm±0.80mm, indicating the potential capability ...
Proceedings of the 2005 IEEE Engineering in Medicine and Biology 27th Annual Conference Shanghai, China, September 1-4, 2005
Application of T1 and T2 Maps for Stereotactic Deep-Brain Neurosurgery Planning T. Guo1, S. C. L. Deoni3, K. W. Finnis4, A. G. Parrent2, and T. M. Peters1 1 Robarts Research Institute, London, ON, Canada 2 London Health Sciences Center, London, ON, Canada 3 Centre for Neuroimaging Sciences, Institute of Psychiatry, King’s College, London, UK 4 Atamai Inc., London, ON, Canada Abstract—This work presents the application of a quantitative magnetic resonance imaging (MRI) technique in stereotactic deep-brain neurosurgery planning procedures. The high spatial resolution T1 and T2 maps acquired using this imaging method have been normalized to the standard CJH-27 brain coordinate system and integrated into a neurosurgical visualization and navigation system to improve the accuracy of surgical target localization. The T1 and T2 maps, along with the standardized anatomical and functional information within this system, can be navigated, non-rigidly registered, and arbitrarily processed. Once applied to individual patients, these maps facilitate the delineation of surgical targets. Our preliminary studies compared the centroids of segmented deepbrain nuclei based on the T1 and T2 maps with those according to Schaltenbrand and Wahren atlas, and with the actual surgical targets of 15 patients who had undergone thalamotomy, pallidotomy, and subthalamic nucleus deep-brain stimulation. The average displacement was 3.21mm± ±0.80mm, indicating the potential capability of this system to accurately initiate target identifications. Keywords—Brain atlas, electrophysiological database, Parkinson’s disease, stereotactic deep-brain neurosurgery, T1 and T2 maps.
I. INTRODUCTION The surgical outcomes for the treatments of Parkinson’s disease, essential tremor, and chronic pain, are highly dependent on the accuracy and precision of the surgical target localization within the deep-brain. The clinical practice of targeting comprises two steps: the first is the surgical target initiation based on computed tomography (CT) or magnetic resonance (MR) images with the assistance of printed or digitized anatomical brain atlases [1,2]; the second refines and finalizes the surgical target with electrophysiological explorations, including microrecording and electrical stimulation data. The current commonly-employed imaging techniques do not provide sufficient information to permit direct delineation of either the motor nuclei of the thalamus, the internal segment of the globus pallidus (GPi), or the subthalamic nucleus (STN) (the targets for the surgical treatments of Parkinson’s disease) from the surrounding
0-7803-8740-6/05/$20.00 ©2005 IEEE.
structures. Moreover, the striking intersubject variability and other inherent pitfalls of anatomical atlases limit their ability to localize the surgical target. Although T2-weighted MRI has shown promise in better visualizing these targets, especially the STN [4], the consistency between the targets defined on these images and those refined with electrophysiological explorations is not guaranteed [6,7]. Methodologies using diffusion tensor magnetic resonance imaging (DT-MRI) to differentiate the thalamic nuclei have been reported in the literature [8,9]. However partial volume effects, the relatively low anisotropy, and the incapability of presenting multiple differently-oriented fiber bundles may affect their applicability in precisely distinguishing fine subcortical regions. Due to the above problems, additional intra-operative electro-physiological measurements, identifying the functional organization of different subcortical regions and mapping somatotopy, are necessary to refine the optimal surgical targets. However such measurements are carried out with multiple invasive exploratory trajectories, which may cause intracranial hemorrhage, brain tissue damage, and other related complications. A quantitative MR imaging approach [10], which is capable of delineating parcellations of thalamus and other deep-brain nuclei from adjacent grey matter according to their characteristic longitudinal (T1) and transverse (T2) relaxation times, has been developed to complement the existing surgical targeting techniques. This paper describes the incorporation of the high resolution standardized T1 and T2 maps obtained with this imaging method into our neurosurgical visualization and navigation system, and its application in stereotactic neurosurgical planning procedures.
II. MATERIALS AND METHODS A. Acquisition of T1 and T2 Maps High-resolution (0.34 mm3 isotropic) and signal to noise ratio T1 map and T2 maps of the deep brain region of a healthy 26 year-old male volunteer were generated by mutually co-registering and averaging 55 T1 maps and 25 T2
5416
maps. The maps were acquired using the DESPOT1 and DESPOT2 methods, which extract voxel-wise quantitative T1 and T2 values from a series of spoiled gradient recalled echo (SPGR) and fully-balanced steady-state free precession (SSFP, True-FISP) images, respectively, acquired over a range of flip angles with constant repetition time (TR) using 1.5T General Electric CV/i clinical scanner. The imaging parameters were TR / TE 11.4 / 2.9ms, flip angles 4° and 16°, BW ±7.81kHz for DESPOT1, and TR / TE 4.2 / 2.1ms, flip angles 15° and 55°, BW ±62.5kHz for DESPOT2. The two maps indicated that differences among some deep-brain nuclei that appear homogeneous on previous pre-operative MR images may actually be visible. B. Segmentation of Deep-brain Nuclei In order to facilitate the analysis of the morphometric characteristics of deep-brain nuclei and to improve the specification of surgical regions, an automatic segmentation approach was applied to segment the GPi, the STN, and the primary subsections of the thalamus on the three dimensional T1 and T2 maps. This segmentation algorithm, which utilizes a genetic algorithm (GA) framework and incorporates characteristics of the k-means clustering algorithm [5], comprises six principal computational components: (1) initialization of candidate solutions, (2) assessment of the fitness of each candidate, (3) selection of the fittest existing candidate solutions, (4) combination of the chosen solutions and new solutions, (5) successive replacement of candidate solutions, (6) ultimate determination of optimal solutions. The centroid locations of the nuclei, which were computed from the digitized Schaltenbrand and Wahren atlas [1] normalized to the CJH-27 brain coordinate system [12], served as the starting elements to generate the initial clusters of candidate solutions. The CJH-27 dataset was the average of 27 co-registered T1-weighted MR images of a healthy male individual. C. Surgical Visualization and Navigation System A comprehensive neurosurgical visualization and navigation system, which incorporates the digitized and segmented Schaltenbrand atlas, a 3D electrophysiological database, and collections of real surgical targets, has been created to simplify the complexity of the pre-operative planning procedures, improve the precision of surgical target differentiation, and shorten the surgical duration for stereotactic deep-brain neurosurgeries. To overcome the striking anatomical variance between each individual patient brain image and the standard brain template, a fast three-dimensional non-rigid registration algorithm [11] was adopted. This completely unsupervised multi-resolution method maximizes the normalized crosscorrelation and a similarity metric to minimize the differences between the source and target images.
Both T1 and T2 maps and their 3D segmented representations of major subcortical nuclei were non-rigidly scaled to the standard brain space and integrated into this neurosurgical planning and guidance system to act as a noninvasive quantitative imaging means component of the image-guided surgery planning system.
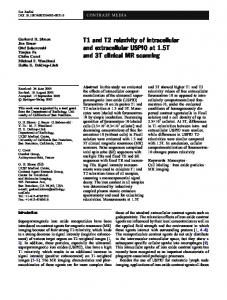
Figure 1. The primary interface of the neurosurgical visualization and navigation system, which displays the patient image (upper) and the standard brain template (lower). The digitized brain atlas and the segmented STN are registered and fused with each image. The color spheres represent the previously collected electrophysiological data registered in the patient brain space and the standar brain coordinate system. The virtul trajectories are also displayed on the two images.
This system can interactively display the 3D image volumes and 2D image planes of both an individual patient brain image and the standard brain template. The digitized version of the Schaltenbrand and Wahren atlas [13], segmented subcortical nuclei based on this atlas, T2weighted images, and the special T1 and T2 maps can be non-rigidly registered, adjusted, and fused with the patient pre-operative image and standard brain image simultaneously or independently. These images can be displayed either in regular grey-scale or in color-map, meanwhile, the segmented nuclei can be represented either as color-coded images or as 3D objects, to achieve the best visualization. In addition to these anatomical references, our system also provides an electrophysiological database, which contains the registered micro recording and electrical stimulation data acquired from 161 stereotactic functional procedures upon 131 patients with movement disorders. The coded functional data from the electrophysiological database after non-rigid registration to the patient brain space, can be presented either as clouds of 3D spheres or as 2D probability maps. Prior to surgeries, 1 to 5 virtual surgical trajectories that
5417
have specifications equivalent to their physical counterparts, can be simulated and manipulated to help the neurosurgeon estimate and determine the possible surgical pathways. Intraoperatively, the electro-physiological measurements obtained along each exploratory trajectory can be collected alongside individual patient brain images, and transformed to the standard database repository. Clinical information, such as the actual surgical target location of each patient, was non-rigidly mapped to the standard brain coordinate and categorized into eight different databases. This system is capable of calculating the center of mass (COM) and the statistical distribution of the previous final surgical target positions, to benefit the presurgical planning for new patients who will be undergoing similar surgical procedures, e.g. left right thalamotomy, pallidotomy, thalamus DBS, and STN DBS.
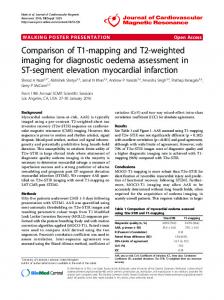
registration error of 1.04mm±0.65mm [11]. Figure 2 shows the segmented thalamus placed alongside the stereotactic atlas [3], indicating excellent similarity of size and location between them, demonstrating strong agreement between the homologous nuclei obtained from the T1 and T2 maps and the stereotactic thalamus atlas. Difference Avg. (mm) Max (mm) Min (mm) Sd (mm)
x 0.45 0.65 0.18 0.20
y 0.45 0.77 0.03 0.33
z 0.94 1.81 0.04 0.73
d(x,y,z) 1.28 1.91 0.34 0.54
Table 1. Absolute differences between the locations of the centroids of segmented deep-brain nuclei based on T1 and T2 maps and those based on Schaltenbrand and Wahren atlas
III. CLINICAL APPLICATION The applicability of T1 and T2 maps built within neurosurgical visualization and navigation system was evaluated with respect to the following aspects. First, the T1 and T2 maps were compared with the commonly used Schaltenbrand and Wahren atlas. Left GP and a portion of the left thalamus on the T1and T2 maps were segmented with the proposed segmentation algorithm. The coordinates of the centroid of each nucleus were calculated automatically by our system. The 3D displacement between the centroid of each segmented nucleus and that of its homologous nucleus on Schaltenbrand atlas was computed. The segmented T1 and T2 maps loaded on our system were also visually inspected and compared with a stereotactic thalamus atlas [3]. We then analyzed the applicability of the T1 and T2 maps for the surgical target planning and estimation. The segmented Vim, GPi, and STN in standard brain space were non-rigidly registered to brain images of 15 patients who had undergone thalamotomy, pallidotomy, and STN DBS procedures respectively. The difference between the final surgical target location of each patient, determined by an experienced neurosurgeon, and that of the corresponding centroid of segmented nucleus after registration was measured. IV. RESULTS A. T1 and T2 Maps vs. Anatomical Brain Atlases Table 1 reports the absolute difference between the two sets of centroid coordinates of the segmented deep-brain nuclei, based on T1 and T2 maps and the Schaltenbrand and Wahren atlas, in left-right, posterior-anterior, and inferiorsuperior directions. Since the segmentation results were derived from the T1 and T2 maps non-rigidly registered to the standard brain template, possible errors may partially come from the registration algorithm, which has a mean
Figure 2. Left: segmented T1 and T2 maps of the thalamus; Right: Stereotactic thalamus atlas.
B. Applicability in Surgical Targeting Currently, the Vim, the GPi, and the STN are the most popular surgical target loci for the treatment of Parkinson’s disease. However, due to the inadequacy of the information provided by regular imaging means, estimating their precise locations prior to the surgeries can be very difficult for the surgeon. If the quantitative T1 and T2 maps allow accurate differentiation of these deep-brain nuclei, the efficiency of pre-operative surgical target localization will be significantly enhanced. Therefore we compared the spatial relationship between the actual surgical targets of 5 thalamotomy, 5 pallidotomy, and 5 STN DBS procedures, and the centroids of specific segmented nuclei non-rigidly mapped to the patient brain images (Figure 3). The average distances between the surgical targets of thalamotomy, pallidotomy, and STN DBS, and the centroids of Vim, Gpi, and STN were 3.23±0.69mm, 3.37±0.58mm, and 3.03±1.16mm respectively. Since the theoretical optimal surgical targets are usually at the peripheral region of these nuclei, the results are reasonable. The integration of the T1 and T2 maps with other standardized functional and anatomical information,
5418
contained within the neurosurgical visualization and navigation system, can compensate their inherent shortcomings and strength their unique advantages.
REFERENCES [1] [2] [3]
[4]
[5]
[6] Figure 3. Absolute differences between the locations of the centroids of segmented deep-brain nuclei based on T1 and T2 maps and the real surgical targets
[7]
V. DISCUSSION The quantitative T1 and T2 MR maps non-rigidly registered to the standard brain coordinate are valuable in localizing the pre-operative surgical target. The segmented results of Vim, GPi, and STN, which are nearly indistinguishable from the surrounding grey matter on common brain images, enable better definition of the functional borders of the surgical targets of interest. The visualization and navigation system equipped with multiple reference resources has been used both pre- and intraoperatively to refine the targeting, reduce the difficulty, and eliminate some avoidable invasive measurements. Preliminary experiments revealed encouraging results for the utilization of the quantitative T1 and T2 maps, as well as the integration of the surgical system in a surgical planning and guidance platform. Although segmentation of the T1 and T2 maps has been demonstrated to be useful in prediction of surgical targets and delineation of primary deep-brain nuclei, further studies are necessary to refine the differentiation of smaller functional subsections of these nuclei. Thorough clinical validation is needed for application of the T1 and T2 maps and this system in stereotactic functional deep-brain neurosurgeries.
[8]
[9]
[10]
[11]
[12]
[13]
ACKNOWLEDGMENTS The authors would like to acknowledge the financial support from the Canadian Institute of Health Research (CIHR), the Ontario Research & Development Challenge Fund (ORDCF), the Canada Foundation for Innovation (CFI), the Ontario Innovation Trust (OIT), and the University of Western Ontario (UWO).
5419
G. Schaltenbrand and W. Wahren, Atlas for Stereotaxy of the Human Brain. Stuttgart, Germany: Thieme, 1977. J. Talairach and P. Tourneau, Co-planar stereotaxic atlas of the human brain. Stuttgart, Germany: Thieme, 1988 A. Morel, M. Magnin, and D. Jeanmonod, “Multiarchitectonic and stereotactic atlas of the human thalamus,” J. of Comparative Neurology, vol. 387, pp. 588-630, 1997. N. K. Patel, P. Heywood, K. O’Sullivan, S. Love, and S. S. Gill, “MRI-directed subthalamic nucleus surgery for Parkinson’s disease,” Stereotact. Funct. Neurosurg., vol. 78, no. 3-4, pp. 132-145, 2002. S. C. L. Deoni, B. K. Rutt, and T. M. Peters, “Segmentation of thalamic nuclei using high resolution quantiative magnetic resonance imaging and a modified k-means algorithm,” In Proc. 13th ISMRM, no. 168, 2005. E. Cuny, D. Guehl, P. Burbaud, C. Gross, V. Dousset, and A. Rougier, “Lack of agreement between direct magnetic resonance imaging and statistical determination of a subthalamic target: the role of electrophysiological guidance,” J. Neurosurg., vol. 97, no. 3, pp. 591-597, 2002. C. Hamani, E. O. Richter, Y. Andrade-Souza, W. Hutchison, J. A. Saint-Cyr, and A. M. Lozano, “Correspondence of microelectrode mapping with magnetic resonance imaging for subthalamic nucleus procedures,” Surg. Neurol., vol. 63, no. 3, pp. 249-253, 2005. M. R. Wiegell, D. S. Tuch, H. B. W. Larsson, and V. J. Wedeen, “Automatic segmentation of thalamic nuclei from diffusion tensor magnetic resonance imaging,” NeuroImage, vol. 19, pp. 391-401, 2003. T. E. J. Behrens, H. Johansen-Berg, M. W. Woolrich, S. M. Smith, C. A. M. Wheeler-Kingshott, P. A. Boulby, G. J. Barker, E. L. Sillery, K. Sheehan, O. Ciccarelli, A. J. Thompson, J. M. Brady, and P. M. Matthews, “Non-invasive mapping of connections between human thalamus and cortex using diffusion imaging,” Nat. Neurosci., vol. 6, no. 7, pp. 750-757, 2003. S. C. L. Deoni, B. K. Rutt, and T. M. Peters, “Rapid combined T1 and T2 mapping using gradient recalled acquisition in the steady state,” Magn. Reson. Med., vol. 49, pp. 515-526, 2003. T. Guo, Y. P. Starreveld, and T. M. Peters, “Evaluation and validation methods for intersubject non-rigid 3D image registration of the human brain,” in Proc. SPIE Medical Imaging. Bellingham,WA: SPIE, 2005, vol. 5744, Visualization, Image-Guided Procedures, and Display, no. 65. C. J. Holmes, R. Hoge, D. L. Collins, R. Woods, A. W. Toga, and A. C. Evans, “Enhancement of MR images using registration for signal averaging,” J. Comput. Assist. Tomogr., vol. 22, no. 2, pp. 324–333, 1998. P. St-Jean, A. F. Sadikot, D. L. Collins, D. Clonda, R. Kasrai, A. C. Evans, and T. M. Peters, “Automated atlas integration and interactive 3-dimensional visualization tools for planning and guidance in functional neurosurgery,” IEEE Trans. Med. Imag., vol. 17, pp. 672– 680, Oct. 1998.