ments . Using tensor decomposition (TD), xijk can be decomposed as xijk = â. â1,â2,â3. G(â1,â2,â3)xâ1ixâ2jxâ3k where G(â1,â2,â3) â R. NÃMÃK is a core ten-.
Application of tensor decomposition based unsupervised feature extraction to bioinformatics/テンソル分解を用いた教師なし学習による変数選択のバイオイン フォマティクスへの応用 Y-h. Taguchi/田口善弘 Department of Physics, Chuo University/中央大学物理学科,https://researchmap.jp/Yh_Taguchi/ Other applications We have developed tensor decomposition based unsupervised feature extraction and applied it to various bioinformatics analysis. In the poster, we summarize from some mathematical basics to real applications.
Fundamental mathematics A tensor, xijk ∈ RN ×M ×K , is the ith gene expression/promoter methylation/any other omics feature of the sample under the jth and the kth treatments . Using tensor decomposition (TD), xijk can be decomposed as G(ℓ1, ℓ2, ℓ3)xℓ1ixℓ2j xℓ3k
stress 5 days 10 days 5 days 10 days 24h 1.5 w 24h 6w RP 24h 1.5 w 24h 6w AY 3,2 5,4 3,4 3,4 HC 3,5 4,5 5,4 4,5 MPFC 4,5 5,5 3,4 4,4 SE 3,2 2,3 3,3 3,3 ST 5,5 5,5 5,4 4,4 VS 5,5 5,5 3,4 5,4 BLD 5,5 5,5 4,5 4,5 HT 5,5 4,5 5,5 5,5 HB 5,5 4,5 5,5 5,5 SP 5,5 5,5 5,4 5,5 RP: rest period, AY: amygdala, HC: hippocampus, MPFC: medial prefrontal cortex, SE: septal nucleus, ST: striatum, VS: ventral striatum, BLD: blood, HT: heart, HB: hemibrain, SP: spleen. (A) 0.6
xijk =
X
Table 1: Samples used in this study. Numbers before/after comma are control/treated samples. h: hours, w: weeks.
xijk = ∑l i k
xijk
1,l2,l3
G(l1,l2,l3)xl i xl j xl 1
l1 i
Core tensor G
j
l3 k
Tensor
2
3k
xl1i xl j 2
l2 xl k j Singular 3
value matrix
Figure 1: Schematic illustrates TD. xijk ∈ RN ×M ×K is decomposed to product sum of G(ℓ1, ℓ2, ℓ3) ∈ RN ×M ×K , xℓ1i ∈ RN ×N , xℓ1i ∈ RM ×M , and xℓ1i ∈ RK×K
In order to extract these genes, we assumed multiple Gaussian distribution for the selected xℓ′1is. Then, P -values are attributed to the ith genes using χ2 distribution. Pi =
Pχ2 >
2 X xℓ′ i 1 σℓ′1 ℓ′1
where Pχ2[> x] is the cumulative probability assuming χ2 distribution that the argument is larger than x and σℓ′1 is standard deviation. If corrected P -values using multiple comparison comparison adjustment are less than 0.01, these genes are identified to share ordered common gene expression. TD was repeated using only selected genes when we need feature extraction (FE).
Tensor decomposition-based unsupervised feature extraction identifies candidate genes that induce post-traumatic stress disorder-mediated heart diseases Although post-traumatic stress disorder (PTSD) is primarily a mental disease, it can also induce other disorders in remote tissues. The examples include cardiovascular, respiratory, musculoskeletal, neurological, and gastrointestinal disorders, diabetes, chronic pain, sleep disorders and other immunemediated disorders.
0.4 0.2 −0.2 0.0
−0.2
where G(ℓ1, ℓ2, ℓ3) ∈ R is a core tensor, xℓ1i ∈ RN ×N , xℓ2j ∈ RM ×M , and xℓ3k ∈ RK×K are singular value matrices that are supposed to be orthogonal matrices. Since xijk is as large as G(ℓ1, ℓ2, ℓ3), it is obviously over complete. Using higher order singular value decomposition (HOSVD) algorithm, we can expect that summation in right hand side employing small number of Gs can well approximate xijk . Feature selection was proposed by using the TD. Suppose that singular value matrices with two sets of {ℓ′2} and {ℓ′3} are expected to represent expected dependence upon treatments, e.g., tissue specificity, over expression under some treatments or enhanced drug responses. Then select a set of {ℓ′1} associated with G(ℓ′1, ℓ′2, ℓ′3)s with larger absolute values. This enables us to identify xℓ′1is associated with expected treatments dependence specified above.
−0.6
N ×M ×K
0.2
0.6
ℓ1,ℓ2,ℓ3
j1
j2
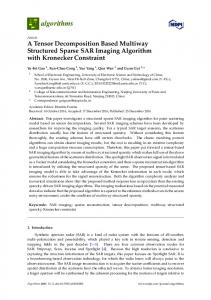
Figure 2: Singular value vectors employed (A) The second control-related or treatment-related singular value vector, xℓ1=2,j1 . Control: j1 = 1, and treatment (stress): j1 = 2. (B) The fourth tissue singular value vector, xℓ2=4,j2 , AY: j2 = 1, HC: j2 = 2, heart: j2 = 8, hemibrain: j2 = 9, and spleen: j2 = 10.
We [1] applied TD based unsupervised FE to gene expression of various stressed mouse tissues with changing stress conditions (Table 1). Gene expression profiles were formatted as a tensor, xi,j1,j2,j3,j4 ∈ RN ×2×10×2×3, of the ith probe, subjected to j1th treatment (j1 = 1: control, j1 = 2: treated [stress-exposed] samples), in the j2th tissue [j2 = 1: amygdala (AY), j2 = 2: hippocampus (HC), j2 = 3: medial prefrontal cortex (MPFC), j2 = 4: septal nucleus (SE), j2 = 5: striatum (ST), j2 = 6: ventral striatum (VS), j2 = 7: blood, j2 = 8: heart, j2 = 9: hemibrain, j2 = 10: spleen], with the j3th stress duration (j3 = 1: 10 days, j3 = 2: five days) and j4th rest period after application of stress (j4 = 1: 1.5 weeks, j4 = 2: 24 hours, j4 = 3: 6 weeks). Zero values were assigned to missing observations (e.g., measurements at 6 weeks after a 5-day period of stress are not available). After applying TD to xi,j1,j2,j3,j4 as xi,j1,...,j4 =
X
G(ℓ1, . . . , ℓ5) · xℓ5,i
ℓ1,...,ℓ5
4 Y
xℓk ,jk
k=1
we found that ℓ1 = 2 represents distinction between treated and control conditions and ℓ2 = 4 represents co-expression among brain subregions and heart. Then we tried to find which G(ℓ1 = 2, ℓ2 = 4, ℓ3, ℓ4, ℓ5)s have larger absolute values (Table 2). It is obvious that ℓ5 = 1, 4, 11 are associated with Gs with larger absolute values. Table 2: Top-ranked G(ℓ1 = 2, ℓ2 = 4, ℓ3, ℓ4, ℓ5) with greater absolute values.
ℓ3 1 1 2 2 2 2
ℓ4 1 1 2 3 3 2
We have applied TD based unsupervised FE to other various applications. More advanced discussions about the methods used for drug discovery [2, 3] is found in Ref. [4]. Applications of TD based unsupervised FE to integrated analysis of multiomics data set is found in Ref. [5]. Genetic and epigenetic background and miRNA transfection mediated sequence non-specific side effect are also discussed in APBC2018 [6] and GIW2017 [7], respectively. Correlation between miRNA expressin and DNA methylation was studied [8], too. Figure 3: Intuitive illustration of the present strategy.
Identification of candidate drugs using tensor-decomposition-based unsupervised feature extraction in integrated analysis of gene expression between diseases and DrugMatrix datasets
(B) 0.8
Abstract
ℓ5 G(2, 4, ℓ3, ℓ4, ℓ5) 11 -35.0 1 -30.8 1 -30.3 4 -30.0 1 28.7 4 28.5
After that, 801 probes associated with adjusted P values less than 0.01 were selected as outliers using these three gene singular value vectors. Genes associated with these identified 801 probes were validated and turned out to be biologically reliable (see Ref. [1] for more details).
In the next application of TD based unsupervised FE, we aimed in silico drug discovery[2]. Suppose there is a tensor, xj1j2i, which represents the ith gene expression at the j2th time point after the j1th compound is given to a rat; these data are taken from the DrugMatrix dataset (Fig. 3). There is also a matrix, xj3i, which represents the ith gene expression of the j3th sample; samples typically include disease samples and control samples. Tensor x˜j1j2j3i was generated as a ‘mathematical product’ of xj1j2i and xj3i. Then, tensor x˜j1j2j3i is decomposed, and singular value matrix of compounds uℓ1j1, singular value matrix of time points uℓ2j2, sample singular value matrix uℓ3j3, and gene singular value matrix uℓ4i are obtained. Among them, I selected the combinations of ℓk , 1 ≤ k ≤ 4, which are simultaneously associated with all of the following: i) core tensor G(ℓ1, ℓ2, ℓ3, ℓ4) with a large enough absolute value, ii) a singular value vector of time points, uℓ2j2, whose value significantly varies with time, and iii) sample singular value vector uℓ3j3. These parameters are different between a disease (red filled circles) and control samples (cyan filled circles). Finally, using gene singular value vector uℓ4i and compound singular value vector uℓ1j1, compounds (filled pink circles) and genes (filled light-green circles) associated with G(ℓ1, ℓ2, ℓ3, ℓ4)s with large enough absolute values are selected. Next, if the selected genes are coincident with the genes associated with a significant alteration when gene X is knocked out (or overexpressed), then the compounds are assumed to target gene X. Table 3: Fisher’s exact test (PF ) and the uncorrected χ2 test (Pχ2 ) of known drug target proteins regarding the inference of the present study. Rows: known drug target proteins (DINIES). Columns: Inferred drug target proteins using ‘Single Gene Perturbations from GEO up’ or ‘Single Gene Perturbations from GEO down’. OR: odds ratio
F T F PTSD T F ALL T F diabetes T F renal carcinoma T F cirrhosis T heart failure
Single Gene Perturbations from F T PF Pχ 2 521 517 3.4 × 10⁻⁴ 3.9 × 10⁻⁴ 13 39 500 560 3.8 × 10⁻² 3.1 × 10⁻² 6 18 979 89 2.7 × 10⁻¹ 3.0 × 10⁻¹ 10 2 889 177 1.2 × 10⁻² 7.1 × 10⁻³ 15 9 847 219 2.0 × 10⁻² 1.2 × 10⁻² 14 10 572 219 1.1 × 10⁻² 8.1 × 10⁻³ 8 10
GEO up Single Gene Perturbations from GEO down RO RO F T PF Pχ 2 628 416 3.02 1.3 × 10⁻³ 7.3 × 10⁻⁴ 2.61 19 33 532 529 2.67 6.1 × 10⁻³ 4.5 × 10⁻³ 3.81 5 19 1009 57 2.19 1.0 × 100 12 0 936 130 3.00 3.6 × 10⁻⁴ 2.0 × 10⁻⁵ 5.13 14 10 895 169 2.75 4.3 × 10⁻² 2.2 × 10⁻² 2.64 16 8 595 169 2.91 1.6 × 10⁻³ 1.1 × 10⁻³ 3.81 7 8
Table 3 shows the result. For five diseases other than ALL, identified combinations of drugs and target proteins are significantly overlapped with known pairs of drugs and target proteins.
References [1] Y-.H. Taguchi. Tensor decomposition-based unsupervised feature extraction identifies candidate genes that induce post-traumatic stress disorder-mediated heart diseases. BMC Med. Genomics, 10(S4):67, 2017. [2] Y. h. Taguchi. Identification of candidate drugs using tensor-decomposition-based unsupervised feature extraction in integrated analysis of gene expression between diseases and DrugMatrix datasets. Scientific Reports, 7(1):13733, oct 2017. [3] Y.-H. Taguchi. Drug candidate identification based on gene expression of treated cells using tensor decomposition-based unsupervised feature extraction for large-scale data. BMC Bioinformatics, 2019. in press. [4] Y h. Taguchi. Tensor decomposition-based unsupervised feature extraction applied to matrix products for multi-view data processing. PLOS ONE, 12(8):e0183933, aug 2017. [5] Y h. Taguchi. One-class differential expression analysis using tensor decomposition-based unsupervised feature extraction applied to integrated analysis of multiple omics data from 26 lung adenocarcinoma cell lines. pages 131–138, 2017. IEEE 17th International Conference on Bioinformatics and Bioengineering. [6] Y.-H. Taguchi. Tensor decomposition-based and principal-component-analysis-based unsupervised feature extraction applied to the gene expression and methylation profiles in the brains of social insects with multiple castes. BMC Bioinformatics, 19(S4):99, may 2018. [7] Y.-H. Taguchi. Tensor decomposition-based unsupervised feature extraction can identify the universal nature of sequence-nonspecific off-target regulation of mRNA mediated by MicroRNA transfection. Cells, 7(6):54, jun 2018. [8] Y h. Taguchi and Ka-Lok Ng. Tensor decomposition–based unsupervised feature extraction for integrated analysis of TCGA data on microRNA expression and promoter methylation of genes in ovarian cancer. pages 195–300, 2018. IEEE 18th International Conference on Bioinformatics and Bioengineering, in press.
Acknowledgements These studies are supported by KAKENHI 17K00417.