Available online at www.sciencedirect.com
ScienceDirect Procedia Materials Science 3 (2014) 1161 – 1166
20th European Conference on Fracture (ECF20)
Characterizing ductile damage and failure: Application of the direct current potential drop method to uncracked tensile specimens Victoria Brinnela*, Benedikt Döbereinera, Sebastian Münstermanna a
Department of Ferrous Metallurgy, RWTH Aachen University, Intzestrasse 1, D-52072 Aachen, Germany
Abstract Modern high-strength steels exhibit excellent ductility properties but their application is hindered by traditional design rules. A characterization of necessary safety margins for the ductile failure of these steels is therefore required. Direct observation of ductile damage within tests is currently not possible, only limited measurements can be made with synchrotron or X-ray radiation facilities. The direct current potential drop (DCPD) method can determine ductile crack propagation with low effort in fracture mechanics. This study investigates the applicability of the DCPD method in notched round bar tensile specimens. The potential measurement is strongly influenced by continuous necking, which decreases the available cross section and thereby increases the specimen’s electrical resistance. A possibility is presented to distinguish the geometrically induced potential rise from the one induced by damage to determine the onset of damage. The results help to develop an effective way to characterize the improved ductile failure behaviour of high-strength steels. © 2014 2014 Elsevier The Authors. Published by Elsevier Ltd. license. Ltd. Open access under CC BY-NC-ND Selection and under responsibility of the University of Science and Technology (NTNU), (NTNU), Department Selection andpeer-review peer-review under responsibility ofNorwegian the Norwegian University of Science and Technology Department of of Structural Engineering Structural Engineering. Keywords: Ductile failure; Ductile damage, Direct current potential drop; In situ
1. Introduction Modern high-strength steels exhibit excellent ductility properties and are therefore suitable materials for lightweight, efficient design. However, their application, e.g. in civil engineering, is hindered by traditional design rules, which do not consider ductile crack initiation and define safety margins relative to the onset of yielding as
* Corresponding author. Tel.: +49 241 8025421 E-mail address:
[email protected]
2211-8128 © 2014 Elsevier Ltd. Open access under CC BY-NC-ND license. Selection and peer-review under responsibility of the Norwegian University of Science and Technology (NTNU), Department of Structural Engineering doi:10.1016/j.mspro.2014.06.189
1162
Victoria Brinnel et al. / Procedia Materials Science 3 (2014) 1161 – 1166
Münstermann et al. (2013) describe. An optimization of these design rules for modern steel alloys demands a precise characterization of necessary safety margins. The design focus should hereby be ductile failure behaviour since brittle failure is excluded by the specification of sufficient transition temperatures and large plastic deformation can occur in application. Hence, a precise in situ detection of the onset and development of ductile damage is required. In steels, ductile damage is a continuous process. Voids initiate at inclusions, grow in dependence of the state of stress and finally form a crack, see the reviews of Benzerga and Leblond (2010) and Besson (2010) for details. After final failure, this process can easily be verified microscopically on the fracture surface, which is dimpled. Contrary to that, the in situ observation of ductile failure is complicated. Current research has achieved to explore void development and formation by X-ray tomography or synchrotron laminography. However, the sample size and thickness is limited to dimensions of approximately 1 mm, see Morgeneyer et al. (2011, 2013). Consequently, these methods are rather suitable to enhance the general understanding of the ductile failure process than to quantify ductile failure behaviour for a large amount of materials. Studies of the last decade have proven that the stress state has a significant influence on the ductile failure behaviour. Considering the stress triaxiality j to characterize the local ductile failure strain has been a standard since the findings of Johnson and Cook (1985). However, Bao and Wierzbicki (2004) have shown that j is not sufficient to completely describe ductile failure. The third invariant of the stress deviator tensor, J3, has to be considered to discriminate axisymmetric stress states from shear-dominated ones. Several plasticity and damage models have been developed to account for this influence e.g. by Bai and Wierzbicki (2008) and Nashon and Hutchinson (2008). The calibration of these damage models requires the testing of samples of varying shape to cover different stress states. The most common concept consists of notched round bars (NRB) with varying notch geometry, covering different values of stress triaxiality, Benzerga and Leblond (2010). Due to their dimensions, tomography or laminography is not applicable to these specimens and therefore no in-situ method for the characterization of ductile damage is available. In fracture mechanics however exists a reliable testing method for in situ measuring of the onset and development of stable ductile cracks: the direct current potential drop (DCPD) method. It is used in pre-cracked specimen with low effort. A transfer of the DCPD method to tensile samples of different shape could enable an in situ testing method for ductile failure and thereby provide new perspectives for the application of high-strength steels. Such an approach has been proposed by Münstermann et al. (2006) and been demonstrated by Lian et al. (2013) for thin sheet samples providing some metallographic evidence. However, for samples made out of heavy plates with a larger cross section, such as NRBs, the cross section of the specimens is significantly reduced due to geometrical necking during testing. This leads to a potential increase which is not induced by damage. Both effects need to be separated. The aim of this study is therefore to investigate the effect of necking on the potential rise during tensile testing of NRB specimen. 2. Methods and Materials 2.1. Application and limits of the DCPD method Electric potential difference methods have been established in the 1950s. They are nowadays essential methods for the detection of crack growth in fatigue, creep, hydrogen embrittlement and stress corrosion problems; see Ritchie and Bathe (1979) and Ljustell (2011). An important field of application is also the crack growth monitoring in large scale structures, such as pipes and pressure vessels. ASTM E647 defines details of application procedures and requirements. Their basic principle is that a crack disturbs the electric potential field between two measurement leads due to the reduction of the effective cross section. Therefore, the potential increases with crack growth. The methods can be applied with alternating or direct currents. Alternating currents may allow for a higher resolution but require a more complex testing setup and, for high frequencies, also include the skin effect, which reduces the consideration of crack growth to the surfaces. In contrast, the DCPD method requires a simpler test setup and considers the complete cross section of the specimen but is more prone to disturbance from thermoelectric effects, see ASTM E647. DCPD measurements are used in fracture mechanics testing to either define the onset of stable crack growth, as described in ASTM E647, or to actually measure the crack growth. The latter requires calibration curves, which
1163
Victoria Brinnel et al. / Procedia Materials Science 3 (2014) 1161 – 1166
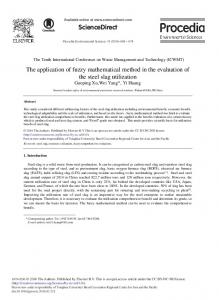
relate the amount of potential rise to a crack growth increment and account for the geometry of the specimen or component. Gandossi et al. (2001) give an overview on the analytical, empirical and numerical approaches for the derivation of such calibration curves. The finite element method (FEM) may be used for the numerical derivation, see Gandossi et al. (2001) and Ritchie and Bathe (1979). Calibration curves may be used as long as the crack growth is according to the small scale yielding criteria defined by the respective standards since under these conditions no significant geometry change occurs. This is different for large scale yielding conditions and consequently the DCPD method has rarely been applied in such problems. A recent study from Ljustell (2011) investigates the influence of large scale yielding conditions on the calibration curve for a stainless steel. His main conclusion is that the DCPD method can measure the crack length under large scale yielding if the reference potential is adjusted at every major change of plastic deformation. In addition to geometric effects the materials’ resistivity is influenced by an increasing dislocation density during plastic deformation. This also may affect the measured potential; however, Ritchie and Bathe (1979) as well as Ljustell (2011) consider this effect to be of minor importance. These studies outline the challenges that result from a transfer of the DCPD method to tensile specimens, which are not pre-cracked and will fail under ductile failure. First, in an uncracked specimen, the emerging voids and cracks are on the micron scale and consequently, cover a much smaller area in the specimen. Tada et al. (1997) have shown in an analytical study, that the potential disturbance of distributed, small internal defects is large enough to be detected (1-10% of the reference potential) for creep problems. A discussion on the resolution of the measuring system and the corresponding size of detectable defects is required. Second, the effect of geometrical necking is significant in tensile specimen and has to be considered. By subtracting the potential rise induced from necking from the measured one it is possible to discriminate between the geometrical and material-intrinsic effects, such as void formation and increased resistivity. An approach to achieve this is presented in this study to enable the application of the DCPD method for the characterization of ductile failure. 2.2. Calculation of the geometrically induced potential drop and determination of the deformed geometry The resistance of the deformed sample has to be computed to determine the potential rise induced by necking. Ohm’s law defines the resistance of a uniform conductor out of the material’s resistivity t, the length l and the cross section A. However, the samples used for ductile testing are, except for smooth round bar samples, no uniform conductors and moreover change their geometry during deformation. The resistance of a conductor with nonuniform cross section can be determined by a differential approach as Wolff (2003) describes. As displayed in Fig. 1(a), the varying cross sections can be subdivided in infinitesimally small parts. The overall resistance of the conductor can then be constructed as a series circuit of the single slices with individual cross section (1). This approach allows computing a deformed sample’s resistance if the material’s resistivity and the shape of the sample are known. As recorded values are always discrete an approximation of the resistance via the sum formation in (1) can be a reasonable compromise.
Fx dx R ? lim  t v ? Ð t N ›¢ Av 0 A( x) v ?1 N
l
Ât N
i ?v
Fxv Av
(1)
The deformed geometry of the sample has to be known in every time step of the experiment to apply (1). It can either be obtained by optical measurements performed in the experiments or by finite element (FE) simulations, as long as it is validated that the simulations provide the correct deformation. An optical measurement can be implemented in one direction; however, this is not sufficient for samples which deform in width and thickness. Measuring two directions requires large optical measurement facilities, which are available at not many research facilities. Therefore, in this study the approach to obtain the deformed shape from FE simulations shall be explored.
1164
Victoria Brinnel et al. / Procedia Materials Science 3 (2014) 1161 – 1166
Fig. 1. (a) Scheme for computing the resistance of a conductor with non-uniform cross section according to Wolff (2003); (b) Schematic drawing of the test setup.
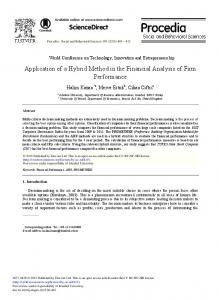
For this purpose simulations of all tested samples are performed within ABAQUS Standard, Version 6.13. A flow curve from tensile tests is employed within an axisymmetric simulation of the NRBs build of the element type C3D8R. The deformed geometry of the notch is exported for every time step into a program code, which determines the l/A-share for each element layer. By multiplication with the material’s resistivity and applied current the theoretical resistance of the sample can be compared to the experimental results. 2.3. Material characteristics, testing and evaluation Notched round bar samples of the pipeline steel X70 and the structural steel S690 were investigated in this study. The notch geometry was varied by changing the radius R between 2 and 8 mm and the ligament diameter L between 4 and 6 mm; the diameter outside the notch was 8mm. The nomenclature in the following is e.g. R2L4 for a radius of 2 mm and a ligament of 4 mm. X70 has a ferritic-pearlitic microstructure and a yield strength of 797 MPa. S690 has a bainitic microstructure and a yield strength of 551 MPa. The resistivity of both materials was computed from measurements of the resulting potential over a range of currents from 1-15 A in a uniform portion of a sample. X 70 showed a resistivity of 0.286 Ωm/mm² and S690 one of 0.323 Ωm/mm². All tests were performed on Zwick tensile testing machines with a deformation speed of 0.1 mm per second; the samples were hold in isolated clamps. For four geometries an additional online measurement of the smallest diameter by a video extensometer was performed to validate the deformation detected by the FE simulation. The voltage was measured according to Fig. 1(b) with a nanovoltmeter. The current source showed a stability of ± 0.02A during the test; the applied current was 1.5 A. Due to small disturbances in the setup the absolute value of the measured potential at the beginning of the test deviated by ±10% from the computed one. To account for this the difference between the current and the initial potential, V-V0, was evaluated. 3. Results Fig. 2(a), (c) and (e) show the results of the measured voltage difference as well as the overall force as a function of the displacement for samples of X70. Fig. 2(b), (d) and (f) show the results of the S690 samples. For both materials, an agreement between the computed and the measured potential course can be found. However, for X70 R2L4 and R6L4 as well as S690 R8L6 the computed potential difference exceeds the measured one. One reason for X70 might be a slight anisotropy, which was not considered in the simulations. Slight deviations in the elastic part and overall force level for the material S690 result from a different testing machine with varying stiffness and a strong variation in internal cleanness and can therefore be accepted. Fig. 2(g)-(h) show the measured and simulated notch ground diameters for four samples. The actual diameter of the samples slightly deviates from the theoretical ligament value; this initial offset was added to the simulation results. The maximum difference between measured and simulated notch ground diameter is 0.2 mm.
Victoria Brinnel et al. / Procedia Materials Science 3 (2014) 1161 – 1166
1165
Fig. 2. (a) – (f) Potential difference and force as a function of displacement in tensile tests on notched round bar samples with varying notch geometry for samples out of X70 and S690; (g) – (h) Comparison of notch ground radius resulting from measurement and simulation.
4. Discussion and Conclusions The course of the measured potential rise could be captured by the computed one, which is only induced by necking. The assumption that most of the potential rise is caused by necking can consequently be confirmed. The described procedure is therefore a suitable approach to separate the necking effect from ductile damage. The detection of the deformation via FE simulations is able to describe the deformation behaviour sufficiently, although small differences may occur. However, to be able to detect the effect of void formation on the measured potential,
1166
Victoria Brinnel et al. / Procedia Materials Science 3 (2014) 1161 – 1166
the measuring accuracy has to be improved. Small internal defects cause a potential rise of 1-10% of the absolute potential value according to Tada et al. (1997). The absolute values of the measured potentials were in the range of 0.2 to 0.5 mV. Therefore, possible potential rises induced by void formation would be in the range of 1-10 μV. This is detectable with the nanovoltmeter but the deviations of the current source introduce too large errors for a suitable detection. Additionally, the computation of the geometrically induced potential rise has to be improved, since it sometimes exceeds the measured one. A direct numerical simulation of the potential rise in electromechanical simulations could be beneficial as well as a consideration of anisotropy. After improvement of the procedure it should be validated by metallographic investigations. To conclude, the presented approach enables the application of the DCPD method in tensile specimens by subtracting the necking effect. The main advantage of it is the very low experimental effort for an in situ detection of ductile damage initiation. Additionally, the method can be applied to a large variety of samples covering a broad selection of stress states. This is of special importance to derive a sufficient data basis for the calibration of advanced damage mechanics models. Thereby, a precise experimental characterization of the ductile behaviour of modern steel alloys can be achieved. Acknowledgements Hassan Majedi and Stefan Neudecker are gratefully acknowledged for valuable discussions and practical help concerning the test setup. References Bai, Y., Wierzbicki, T., 2008. A New Model of Metal Plasticity and Fracture with Pressure and Lode Dependence. International Journal of Plasticity 24, 1071-1096. Bao, Y., Wierzbicki, T., 2004. On Fracture Locus in the Equivalent Strain and Stress Triaxiality Space. International Journal of Mechanical Sciences 46, 81-98. Benzerga, A., Leblond, B., 2010. Ductile Fracture by Void Growth to Coalescence. Advances in Applied Mechanics 44, 169 – 305. Besson, J., 2010. Continuum Models of Ductile Fracture: A Review. International Journal of Damage Mechanics 19, 3-52. Gandossi, L., Summers, S.A., Taylor, N.G., Hurst, R.C., Hulm, B.J., Parker, J.D., 2001. The Potential Drop Method for Monitoring Crack Growth in Real Components Subjected to Combined Fatigue and Creep Conditions: Application of FE Techniques for Deriving Calibration Curves. International Journal of Pressure Vessels and Piping 78, 881-891. Johnson, G., Cook, W., 1985. Fracture Characteristics of Three Metals Subjected to Various Strains, Strain Rates, Temperatures and Pressures. Engineering Fracture Mechanics 21, 31-48. Lian, J., Sharaf, M., Archie, F., Münstermann, S., 2013. A Hybrid Approach for Modelling of Plasticity and Failure Behaviour of Advanced High-Strength Steel Sheets. International Journal of Damage Mechanics 22, 188-218. Ljustell, P., 2011. The Effect of Large Scale Plastic Deformation on Fatigue Crack Length Measurement with the Potential Drop Method. Journal of Testing and Evaluation 39, 985-1002. Morgeneyer, T.F., Helfen, L., Sinclair, I., Proudhon, H., Xu, F., Baumbach, T., 2011. Ductile crack initiation and propagation assessed via in situ synchrotron radiation-computed laminography. Scripta Materialia 65, 1010-1013. Morgeneyer, T.F., Helfen, L., Mubarak, H., Hild, F., 2013. 3D Digital Volume Correlation of Synchrotron Radiation Laminography Images of Ductile Crack Initiation: An Initial Feasibility Study. Experimental Mechanics 53, 543-556. Münstermann, S., Schruff, C., Lian, J., Döbereiner, B., Brinnel, V., Wu, B., 2013. Predicting Lower Bound Damage Curves for High-strength Low-Alloy Steels. Fatigue & Fracture of Engineering Materials & Structures 36, 779-794. Münstermann, S., 2006. Numerische Beschreibung des duktilen Versagensverhaltens von hochfesten Baustählen unter Berücksichtigung der Mikrostruktur, in: „Bericht aus dem Institut für Eisenhüttenhüttenkunde Band 4“. Shaker Verlag, Aachen. Nahshon, K., Hutchinson, J.W., 2008. Modification of the Gurson Model for Shear Failure. European Journal of Mechanics A/Solids 27, 1-17. Ritchie, R.O., Bathe, K.J., 1979. On the Calibration of the Electrical Potential Technique for Monitoring Crack Growth Using Finite Element Methods. International Journal of Fracture 15, 47-55. Tada, N., Hayashi, Y., Kitamura, T., Ohtani, R., 1997. Analysis on the Applicability of Direct Current Electrical Potential Method to the Detection of Damage by Multiple Small Internal Cracks. International Journal of Fracture 85, 1-9. Wolff, I., 2003. Grundlagen der Elektrotechnik Band 1: Das elektrische und das magnetische Feld. Verlagsbuchhandlung Dr. Wolff, Aachen.