Chen1. Anal.. (Warsaw), 46, 529 (2001)
Application of the Discrete Wavelet Transforms for Denoising inGC Analysis by J.Lasal,2~:, I. SIiwka 1, J. Rosiek2 and K.Wal1 Ifnstitute o.fNuclearPhysics, 152 Radzikolt'skiegoStr., 31-342 Cracow,· Poland 2Acadenly o.fMining and Metallurgy, 30 A. Mickievvicza Avenue., 30-059 Cra co vv, Poland
Key words: GC-ECD, CFC's analysis, detection level, signal to noise ratio, discret wavelet transforn1 (DWT),.chromatogran1s denoising
The nlinilnal detection level in gas chromatography (GC) depends strongly on the noise atnplitude ofa particular detector response. The reduction ofthe noise an1plitude leadsto the increased signal to noise ratio and can be achieved by using appropriate noise filters, like the Fourier transform (FT), Savitzky-Golay (SG) approach or a discrete wavelet transform (DWT), in addition to the stabilization of the pneumatic, tern1ic and electronic factors also influencing the GC response. In this paper, theDWT 111ethod has been used, and the choice of the optitnal wavelet function in DWT fordenoising ofchrolnatogranls has been described. This Inethod was applied for denoising the chromatogranls of various chlorofluorocarbons (F-Il and F-113, freons, chloroforn1, I, I, I-trichloroethane, and carbon tetrachloride) detected in air· salnples in ppt concentrations. As ideal· chronlatogratns, which should be obtained after denoising filtration, a synthetic Chr0111atogralll and the mean of sum of40 experimental chronlatogranls were used. It was shown that the application of the DWT filtration causes a three-fold increase in the accuracy of the concentration Ineasuren1ents of the above nlentioned compounds. The decrease of the noise anlplitude in1proves the accuracy of peak areas integration, which then depends Inainly on the accuracy of the determination of the concentration of the cOlnpounds in applied standards.
* Concsponding author. E-rnail:
[email protected]
530
J Lasa et al. W chromatograficznej metodzie analitycznej minimalna wykrywalnose okreslona jest amplitud(l szumu sygnalu detektora. Obnizenie amplitudy SZU111U prowadzi do wzrostu stosunku sygnalu do szunlU. Obnizenie aInplitudy szumow nl0zna uzyskae przez stabilizacjt( czynnikow pnelunatycznych i elektronicznych wplywaj(lcych na prac« chronlatografu oraz maze bye dokonane przez stosowanie odpowiednich fiItrow obnizaj(lcych poziom szumu, takichjak transformata Fouriera (Fourier Transfornl- FT), przyblizenie Savitzky-Golay' a (SG) lub dyskretnej transformacji falkowej (Disccrete Wavelet Transform - DWT). W pracy przedstawiono metodt( DWT i sposob wyboru otynlalnej funkcji falkowej do odszumiania chromatogramow. Metodt( zastosowano w analizach zwi(lzkow chlorowcowych 0 stt(zeniach na poziomie ppt. Doswiadczalne chromatogralny dotyczyly analizy freonu F-ll i F-113, chloroformu, 1,1, I-trichloroetanu i czterochlorku wt(gla. Jako chronlatogram "idealny", do ktorego powinno prowadzie odszumianie stosowano chrolnatogram syntetyczny oraz chromatogram bt(d(lcy SUln(l 40 chrolnatograInow doswiadczalnych. Wykazano, ze zastosowanie fiItru typu DWT do odszulniania chrolnatoranl0w prowadzi do trzykrotnego zwit(kszenia dokladnosciponliaru stt(zenia wylnienionych zwi(lzkow. Obnizenie amplitudy szumu poprawia dokladnose pOlniaru powierzchni pikow analizowanych zwi(lzkow w probce powietrza i standardzie wzglt(denl ktorego prowadzone S(l obliczenia ilosciowe.
In gas chromatographic analysis a Ininimal detection limit is defined as a concentration or mass of the analyzed cOlnpound which generate a detector response two tilnes greater than the noise amplitude [1]. Thus, the reduction oftlle noise anlplitude leads to the decrease of the detection lilnit and allows to increase the accuracy of the Ineasurements, particularly for low concentrations of cOlnpounds. The noise of a GC detector depends on many factors connected with the pnelunatic and electronic systeIns, as well as the colulnn temperature. The ilnprovelnent of the GC stability is Inainly obtained by careful stabilization of these paralneters. Further decrease of of the signal to noise ratio can be achieved by the application of the properly chosen denoising filter. Recently, an increased.interest in the application offiltration methods to spectroscopy has been observed. The Inost popular filtration methods include: Fourier transforin (FT), Savitzky-Golay (SG), and various discrete wavelet transforins (DWTs). The last method is the best for filtered chrolnatogralns containing sharp peaks with widths and alnplitudes varied in time. It is evident froln the papers ofBarcly et ale [2] and Cai et ale [3] that DWT Inethod allows to decrease the noise amplitude several tiines. This paper presents the application of the DWT filtration n1ethod to denoising of the chrolnatograms, obtained froin GC systeln, which is periodically used for Inonitoring chlorofluorocarbons (CFCs) in air in the ppt range. The CFCs used were: freon F-ll, F-II3, chloroforln, 1,1, I-trichloroethane and carbon tetrachloride. The smallest peaks, corresponding to chloroforln, are only several tilnes higher than the noise alnplitude. The application ofthe filtration Inethods allows to increase both accuracy and precision of detection of these CFCs.
531
Denoising in GC analysis
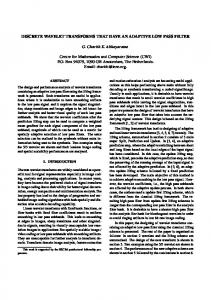
EXPERIMENTAL Equipment The measuring system consists of a computer controlled GC (Fisons 8000). The air and standard satnples, both 5cn13 in volulue, are injected alternatively at tilne intervals of 30 min. The computer records the chromatograms of the air and standard samples, which include the sequence of peaks ofF-II, F-I13, chloroform, 1,1, I-trichloroethane, andCCI 4 .Next, the integrated peak areas are transferredto the Excel program. The columns of the Excel Sheetcontain the date and the time of the sanlple injected, the retention time, the height, and the peak areas of each sanlple and a standard. As. a standard, a cylinder filled with air was selected out of5 cylinders produced by AGA Firm. This air saInple was previously calibrated vs the primary standard of the Scripps Oceanography Institute (USA). This secondary standard contains 264.87 ± 0.12 ppt ofF-II, 79.47 ± 0.15 ppt ofF-1I3, 15-.98 ± 0.14 ppt of chlorofofln, 86.26 ± 0.14 ppt of 1,1, I-trichloroethane andJOO.13 ±0.087 pptofcarbontetrachloride.An example of a chronlatogram containing the standard and air sample analysis is presented in Figure 1. The detaileddescription of the instrument, and of the primary standard used, are given in the preceding papers [4, 5J. 4800 "..····f···I
·..If·..··
·..·..·..·..·..·
· ···
···· · ··,
· ··..·..·· · .. ··1..·1..· ·"·
F-11
·
H
~
F-11
,/
4700
·..·•..···· ····· ·
/
4600 CH3CCI3
CH3CCI3
~ 4500
-; c:
C)
'en 4400 a.. 0
1)
oSQ) c 4300 4200
4100 Standard sample
Air sample
4000 0
10
20
30
40
50
60
Time, min
Figure i ..Example of standard and air sample chrolnatogranls Description of the denoising method DWT denoising method is described in many papers [6, 7, 8]. The DWT denoising procedure includes three steps. First, a data object is transformed into the wavelet domain. Second, SOlne coefficients are selected and zero-filled or "shrunk" by sonle criterion. Third, the shrunk coefficients are inversely transformed to the original domain, which is the denoised data [3]. The ternl "shrunk" is used in statistical literature and refers to the attenuation ofa wavelet coefficient magnitude. For optimization ofDWT filter in the first step, selecting ofthe best wavelet type for specific data must be chosen. The difference between ideal, noiseless chronlatograms, s(k), and chro!natograms after denoising,y(k), is a measure of denoising effectiveness. This effectiveness is expressed as root nlean square (rI11s) in the shape:
532
J. Lasa et al. L(s(k) - y(k))2
rms
= 11......:k~
(1)
_
L:k
where k is an index of a particular tneasured data. This criterion may be applied only for tnodel systems, for which a mathen1atical description of the signal and a well-defined noise spectrum is known. In practice, this ideal shape of chrolnatogramis not known and the above criterion can only be used with some 1110dificatiolls. Two of thenl are commonly used. In the first one, a synthetic chromatogratn which contains several chromatographic peaks analogous to the experimental ones, should be created. In the second Inodification, a denoised chrolllatogranl lnay be used as a reference.
RESULTS AND DISCUSSION
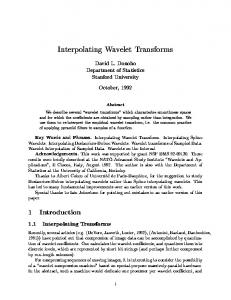
Choosing the optimal parameters of wavelet filter For fast and approxhnate choice of optilnal paralneters of wavelet filter a Matlab progralTI was used. Unfortunately, for a synthetic chrolnatogralTI containing several chrolnatographic peaks with Gauss shape and statistical noise of knovln alnplitude, searching for a basic wavelet function was not effective. Each tilne, a return to the initial noiseless chrolnatograln was seen, thus precluding the choice of optilnal paralneterse An "ideal" shape of the chrOlnatograln, to which denoising Inethod should lead, was obtained as the Inean of several chrOlnatogralns for the standard saillple. In Figure 2, this chroinatogralll, consisting of a lllean of 40 chrOlnatograllls, is presented in enlarged view. In this figure, the basic and filtered chroillatograills are also presented. 4200 4190 4180 Mean of 40 chromatograms
4170
>
~ 4160 'iU c:: 0)
"iii 4150 (;
0Q)
a;
4140
c
4130 4120
Basic chromatogram after denoising
4110 4100 0
2
4
6
10
12
14
16
18
20
Time, min
Figure 2. Enlarged shapes ofbasic and denoised chromatogralTIS and ofthe lTIean of 40 chro111atogran1s
533
Denoising in GC analysis
The effectiveness ofDWT Inethod was exainined (Fig. 2) using an experilnental chroinatograin and, by experiinentally choosing basic wavelet functions, in order to obtain the last chromatograln closest to "ideal". Daubechies five-order wavelet (DB5) in five level ofanalysis and hard threshold for zero coefficient were used. After denoising, rl1'lSparalneter was calculated. It should be equal to zero for ideal filtration, but, in practice, this is impossible, so the hard threshold for zero was chosen to obtain thesinallest rms value. This point of hard threshold was equal to 3.5 and gave filtered chromatograin presented in Figure 3 and also shown enlarged in Figure 2. It can clearly be seen [roin both figures that, after denoising, the shape of the chrolnatagran1 is nearer to the 'ideal', i.e. to the IneanSUln of40 chromatograIns? 4800 .,..w.wN:t······lwN..n-.wm....•w~.•w~w .wowu.w•...,..
~·~·.w ••ww.m.·.·.·.·.·..·.·.·.·.·.N.·.wNm.·.·.·.·.·
.w.w.·••
~.....•...,..•.....................•.·.·.·m..•..w.w.w•.~.•...........~
w'·.ll'w.•,..·.·.·
NU~W.·.·.w~·.·.·.·.·.·.·.·.·.·.· •.·.·.,·.·.·.·-.,·
CCI4
j
4700
,.•·.w.·.·.·.·~·.·.·.·.· ·•·.·•·.·•.·.·.w.·..·.w.·.·".·
,wm.·.·...•..,v.·.· ·.·..:
I
4600
> ~ ctI
· ·.·.·.·•·•.·.·,,·.·.·.·.·.·.·~w.·.·.·
CCI4
CH3CCI3 CH3CCI3 F-113
4500
c
0)
j.CHCI3
·iii
o 4400 1)
SQ)
c
4300
4200 4100
~
~ v-
\ ,,I II
\J
_---------'l.,~ \ v
L-J\--
Standard sample
lli r
LJ\-\------
Air sample
4000 - j - - - - - - - - - , : - - - - - - - - - r - - - - - - , - - - - - - r - - - - - , . . . . - - - - . . . . . . . . . . . . - i 10 20 30 40 50 60
o
Time, min.
Figure 3. Example of a chromatogram after denoising
Effectiveness of denoising The effectiveness of denoising was examined on the base-line of the chroInatograin for the tilne interval equal to lInin. In the analysis, the standard and experilnental samples were compared. The base lines before and after denoising, as well as a Inean Slun of40 chromatogralns are shownin Fig. 4. The standard deviation for the line before denoising is 1.96 ~V and decreases to 0.,59 ~V after denoising, i.e. the ratio of these deviations is 3.32. Clearly, the DWT filtration results in a three fold decre.ase of the noise alnplitude. For the line representing the Inean of40 chroInatograins ('ideal' run) the standard deviation,is equal to 0.0066.~V.
J. Lasa et al.
534
Mean of 40 chromatograms, cr = 0.0066
~lV
4165
4160 Noise of the base line, cr = 1.96
~ 4155
~N
(U t:
en
'jjj
4150
~
.
.2o oS
~
4145
4140
After denoising, cr = 0.59
~lV
------------------------------
4135
4130 + - - - - - . . . . . , . . - - - - - - r - - - - - - - - r - - - - r - - - - - - , . . . - - - - - - t - - - - - - - i
23.8
24
24.2
24.4
24.6
24.8
25
25.2
Time, min
Figure 4. Run ofzero-line for basic and denoised chromatogralTI and for the mean of40 chromatograms
The influence of denoising on measurement accuracy In continuous Ineasurelnents of CFCs concentration by GC Inethod, using alternative injections of standard and air salnples, the concentration of the kth-colnpound in ith-air salnple is calculated as follows: k
Fi
k
c· = - - - x w 1
k
(2)
Fik(W)
where P i k is the kth-colnpound peak area of the ith-salnple in ~V x s; w k is the concentration of the kth-colnpound in the standard in ppt, and Fik(W) is a function deterlnining standard peak area W for kth-coinpound ofith-sainple analysis, obtained by nleans of the five-points interpolation Inethod [9]. The relative error of the single Ineasurelnent of the kth-compound concentration of the ith-sainple is deterinined by the following forinuia [9]:
i1C.
k
__ I
k
cj
;=:
J (+
ffi·( i1P k 2 x •
pj
k
•
l
(c.k
k
(a(R
k)J2( 1 0.7406 x--'.J2"1+____ +L1W - -)2 w
k
J
Rk
w
k
(2)
th where LlC ikis the total error of single Ineasureinent concentration (c jk) of k -COInpound ofthe ith-sainple in ppt; LlP j k is the error of deterinination of the peak areapj k of kth-compound of the itl~_ salnple in JlV x s; LllV k is the error of the deterinination of
535
Denoising in GC ana(vsis
kth-coinpound concentration in the standard in ppt; a(R k ) is the standard deviation of k the relative temporary detection. sensitivity (R ) of the GC for k-colnpound [9]. For the systelns under consideration, the a(Rk)IR k ratio is equal to 0.0062, 0.0262, 0.205, 0.0286 and 0.0111 for F-11, F-113, CI-ICI}, CH3 CCl 3 and CCI 4 , respectively. The relative total error of the k-colnpound (f!et let) in the air salnple depends on the relative error ofthe concentration ofthis cOlnpound in the standard (f! wk/w k ). The values f!wk/wk for the standard used are equal to 0.0017,0.00892,0.143,0.0155 and 0.0132 for F-11, F-113, CHCI 3 ,CH 3 CCI 3 and CCI 4 , respectively. The inaccuracy of the peak areas, AP\ for particular k-colnpounds were deterlnined as follows:
APk=Nx Wh x 1.065
(3)
where vVh is the peak width athalfheight, s; N= 4 x (JNis the noise alnplitude, aNis the standard deviation of the base line noise. The standard deviation (aN) isequal1.96 1-1 V for noised and 0.59 ~V for denoised chrolnatograms (Fig. 4). Tablel depicts f!pk and f!pklpk values, expressed in units of area and in percents, respectively, and calculated for experilnentally deterlnined vVh andP values for the analyzed compound. These data refer to noised and denoised chrolnatogralns. Thecolnparisonofthe data in Table 1 shows thatdilninishingofthe noise alnplitude results in the decrease of the f!PIP paralneter [equation (2)]. This is particularly importal1t for calculation of lneasurelnent error for freon F-113, chloroforln and CI-I 3 CCI 3 . Table 1. Influence of denoising on 111easured areas of chro111atographic peaks
C0111pOUl1ds
F-ll
wh
p
s
~Vxs
10.2
F-113
12.6
CI-ICh
17.1
32000 2500 350
Before denoising
After denoising
an =1.96 ~V
an = 0.59gV
b,.p
b,.P/P
M
b,.P/P
~Vxs
%
~Vxs
%
0.265
25.6
0.08
85 105
4.2
143
40.8
31.6 43
1.26 12.28
CI-I3 CCh
21
3800
175
4.6
52.8
1.38
CCl 4
23
14000
195
1.4
58.8
0.42
In order to show the influence ofDWT filtration on the accuracy of the lneasureInents, the errors, Ae, for one air salnple frOln data set collected frOln 1 to 6 August of 1999, were calculated for noised and denoised chroinatograills and are sUlnnlarized in Table 2. It can clearly be seen froin this Table that the application ofDWT filtration increases'the accuracy ofineasureinents. For F-11 and CCI 3 , this increase is close to 5%, but for F-113, CRCl 3 and CH 3 CCl 3 it is lnuch higher, ea 30%. It should also be noted that the peak areas for the cOlnpounds F-ll and CC1 4 are large and the influence of f!P value on the APIP ratio is mininlal.
J Lasa et al.
536
It is evident from Table 2 that the application of the DWT filtration causes the diminishing in the measureinent errors and the increase in the precision of the Ineasurements. Also, the filtration effect depends on the peak height of the analyzed cOlnpound and on the accuracy of the deterlnination ofthe cOlnpound in the standards used. Table 2. The single measurement error of CFC-s compounds of air san1ple analyzed on 2 nd Septen1ber, 16:45 before and after denoising COlnpound c,
ppt
F-11
F-113
CRCl 3
CH 3CCh
CCl 3
265.93
79.73
51.42
62.36
109.66
30.09
5.89
5.81
22.26
3.92
5.52
26
33.4
4.9
Before denoising ~c,
2.66
ppt
5.77 After denoising
~c,
2.52
ppt
4.07 Rise in accuracy
~Cbe'l)re - ~cal1er ~cbefl)re
X
100, % 5.3
29.4
CONCLUSIONS The application of the DWT filter for denoising ofchroinatograins leads to the increase of the accuracy of the CFCs concentration Ineasurelnents in air. We can see froin Figure 2 that the DWT filter relnoves the high frequency cOlnponent of the noise. The reinaining noise contains the low frequency cOlnponent (Fig. 3), which is three tilnes lower than the high frequency component. For packed chroinatographic coluinns, used in the experilnents presented in this work, the peak widths at half height (Wh) ofthe analyzed cOlnpounds are in the tilne range from 10 to 25 s. For these peaks, the low frequency noise cOlnponent deterlnines the detection level of the applied analytical systeln. For capillary collllnns, for which the tiIne of peak width at halfheight is in range of seconds, this cOlnponent Inay be neglected and denoising effectiveness should be higher. The application of the DWT filter is very effective in trace analysis, when the peaks of the analyzed cOlnpounds are only several tilnes higher than noise amplitude. The relative error of the concentration measurelnents depends Inainly on the accuracy of the standard used. Acknowledgements This "vork was acco111plished as a part o.fthe grant No 9 T12 B049 17fr0111 the State COl1llnitteefor Scient(fic Research.
Denoising in GC analysis
537
REFERENCES 1. Chro111atographic nomenclature, Witkiewicz Z., [Soczewillski E., Suprynowicz Z., Eds.] Polish Chen1ical Society, .Warszawa 1996, (in Polish). 2. Barclay VJ., Bonner R.F, Hmnilton LP., Anal. Chen1., 69, 78 (1997). 3. Cai C., Harrington PB., J. Chen1. Co111pUt. Sci., 38, 1161 (1998). 4. Sliwka I. and Lasa J., Optilnization o.fthe syste111 analysis o.fthe halogenated compounds active in Earth ozone layer destruction", Proceedings of Sympositlln: 16-18 Septeo1ber, 1997 Tonul (in Polish). 5. Sliwka 1. and J. Lasa, "Quantitative lneasure111ents o.fthe halogenated C0111pound concentration in air", Proceedings ofSymposium: Ecoanalytics in Environn1ental Chemistry, 8-10 Septen1ber, 1998 Tonul (in Polish). 6. Daubechies, Ten lectures on wavelets, SIAM, Philadelphia, Pennsylvania 1992. 7. An introduction to Wavelets: http://www.an1ara.con1/IEEEwave/IEEEwavelet.htlnl 8.•http://playfair.Stanford.edu/--wavelab/ 9. Sliwka 1. and J. Lasa A methodfor the iJnproven1ent o.fprecision and accuracy in concentration 111easure111ents based on external standard, Chern. Anal. (Warsaw), (in press).
Additional reference: 10. Mittermayr C.R., Nikolov S.G., Hutter H. and Grasserbauer M., ChenlOlJletrics and Intelligent Lab. Systems, 34, 456 (1996). 11. Mittermayr C.R., Frischenschlager H., Rosenberg E. and M. Grassenbauer, Fresenius J. Anal. Chen1., 358,456 (1997). Received May 2000 Accepted Janucuy 2001