International Journal of Control and Automation Vol.8, No.10 (2015), pp.135-144 http://dx.doi.org/10.14257/ijca.2015.8.10.13
Application of Transfer Function ARIMA Modeling for the Sedimentation Process on Water Treatment Plant Sang-Hyuk Park1,1, Jayong Koo2,2 1 Korea Institute of Civil Engineering and Building Technology, 283, GoyandaeRo Ilsanseo-Gu, Goyang-Si, Gyeonggi-Do, 411-712, Korea 2 University of Seoul, Seoulsiripdae-ro 163, Dongdaemun-gu, Seoul, 130-743, Korea Abstract This research applied the model that simulates the effects of inflow water quality, treatment flow rate and outflow water quality on drinking water treatment plant. The model is not a physical chemistry model. However it can evaluate the performance of sedimentation process as a statistical model. The model used transfer function ARIMA model for the prediction of turbidity on sedimentation reservoir outflow. By using the applied model, performance evaluation was executed according to the control factor per process. Coefficients of determination of the selected model were 0.95 in case of using optimal model for the transfer function model, and predictive results were estimated 0.99. Transfer function ARIMA model can replicate dynamic status of system where it is possible to diagnose system using the model in the perspective of expressing actual operation status. Keywords: Transfer Function ARIMA(Auto-Regressive Moving Average), Sedimentation Process, Diagnosis, Prediction, Water Quality
1. Introduction Research on the coagulant dose in the mixing process has been actively researched until now, but research has not been active on the prediction area of outflow in sedimentation reservoir. Research related to sedimentation reservoir modeling is a theoretic model of sedimentation process where research related to sedimentation speed of particles was performed. Stokes Equation induced under the hypothesis of influence by size, density, formation, and viscosity of sediments was used for function related to sedimentation speed. However, sedimentation speed increases compared to the square law of particle diameter for Stokes Equation. Furthermore, it does not match with the actual speed when the sedimentation velocity of particle is big; thus, different equation such as Allen Equation or Newton Equation was used (John et al., 2012). Also, sedimentation process in sedimentation reservoir shows different aspects according to the relationship with settled materials or influence between particles. These kinds of equation are matched to special condition. Thus, in order to match these conditions, the recent modeling uses equation exponentially reduced on sedimentation speed of particle on maximum speed (Eckenfelder, 1989). Existing modeling on sedimentation tank make approaches in microscopic perspective on the sedimentation speed. The sedimentation tank is divided into various layers, sedimentation type is hypothesized in each layer, and then the calculation is made through 1 2
Researcher, Korea Institute of Civil Engineering and Building Technology (
[email protected], Corresponding author) Prof., Dept. Environmental Engineering, University of Seoul (
[email protected] )
ISSN: 2005-4297 IJCA Copyright ⓒ 2015 SERSC
International Journal of Control and Automation Vol.8, No.10 (2015)
numerical analysis method (White and Verdone, 2000). However, the interpretive model of sedimentation process analyzing this type of sedimentation phenomenon of particle in microscopic perspective is difficult to use for control in the actual field. Thus, research was performed by using statistical analysis method to predict sedimentation phenomenon of actual field rather than making approach in macroscopic perspective. Park et al. (2006) used real-time measurement variables (time, coagulant dose, turbidity of raw water, SCD, and conductivity) that influence sedimentation efficiency and cohesion in actual water treatment process to develop a model that predicts sedimentation efficiency of machine learning floc based on model tree method. The existing prediction model of coagulant sedimentation efficiency is an interpretive model established to regulate mechanism rather than having the purpose of predicting cohesion and sedimentation efficiency in actual procedure. Thus, it was reported to be impracticable in predicting cohesion of floc and sedimentation efficiency that occur in the actual procedure, and it was identified that the model considering time variable (R=0.73) appeared to be superior to the model that excluded time variable. Study by Lee et al (2007) used artificial neural net model and multiple regression model to development prediction model for residual chlorine concentration of sedimentation reservoir for comparison and analysis. Input variable of multiple regression model used alkalinity, inflow rate, turbidity, water temperature, conductivity, and chlorine input where low correlation (R=0.37) was identified, and the time series input variable was additionally considered to the input variable of multiple regression model as input variable when using artificial neural net to acquire high results of 0.87 for coefficient of determination (R2). The sedimentation process involves chemical and physical reactions, so the cause effect relationships in the system are very complicated. The relationships change incessantly according to the fluctuating inputs, operating actions, and other factors, accompanied with variation in the species of particles present in the sedimentation reservoir. Thus the treatment system model cannot avoid having uncertainty in mathematical relationships. In addition to this, many other uncertainties exist in the treatment system model which is identified from the in situ field data. This study has developed a model that can simulate the effects that the inflow water quality and the results of control operation have on the outflow water quality and treatment flow rate, for the performance evaluation and control of the water treatment plants, and by using the developed model, the predictability of the performance of processes and water quality and water capacity in accordance with the control factor of sedimentation process were analyzed. In order to achieve modeling, transfer function ARIMA model was used to reflect the dynamic characteristic of the system as statistic models and not the existing physiochemical models. Furthermore, modeling and performance evaluation were executed according to the control characteristic of sedimentation process.
2. Methodology 2.1. Model Identification Transfer function ARIMA model that contain exogenous predictor variables are called dynamic regression models proposed by Box and Jenkins (1976). These models require analysis of correlations between current and lagged values of response, exogenous inputs and errors to accurately reflect the relationship between response and predictors. The model is formulated as follows. 𝜔 (𝐵)
𝜃(𝐵)
𝑌𝑡 = 𝜇 + ∑𝑛𝑖=1 𝛿 𝑖(𝐵) 𝑋𝑖,𝑡 + ∅(𝐵) 𝑎𝑡 𝑖
where 𝑋𝑡
136
( Eq. 1 )
∶ original input time series
Copyright ⓒ 2015 SERSC
International Journal of Control and Automation Vol.8, No.10 (2015)
𝑌𝑡 𝑎𝑡 b μ
𝜔𝑖 (𝐵) 𝛿𝑖 (𝐵)
∶ ∶ ∶ ∶ ∶
original output time series white noise delay parameter overall constant transfer function operator
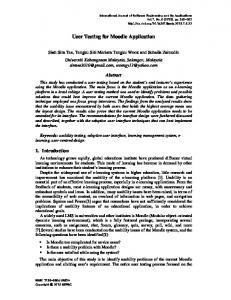
[ ω(B) = 𝜔0 − 𝜔1 𝐵 − 𝜔2 𝐵2 ⋯ − 𝜔𝑠 𝐵 𝑠 ] [ δ(B) = 1 − 𝛿1 𝐵 − 𝛿2 𝐵2 ⋯ − 𝛿𝑟 𝐵𝑟 ] ∅(B) ∶ autoregressive operator [ ∅(B) = 1 − ∅1 𝐵 − ∅2 𝐵2 ⋯ − ∅𝑝 𝐵𝑝 ] θ(B) ∶ moving average operator [ θ(B) = 1 − 𝜃1 𝐵 − 𝜃2 𝐵2 ⋯ − 𝜃𝑞 𝐵𝑞 ] B ∶ Backward shift operator This study has examined the relationship between 4 components in order to obtain a mathematical description of the sedimentation process model. A change in inputs from one level to another will usually have no immediate effect on outputs but instead will produce a delayed response, eventually reaching equilibrium at a new level. A transfer function model just describes such a change, in other words, a dynamic response. We consider reasonable that the behavior of the empirically operated sedimentation process is simulated by a dynamic response model, because of the typical inertia of physical chemistry reactions in a system. Furthermore, outputs from the sedimentation process are also influenced by disturbances. Disturbances include change of accidental shocks, not easily measured inputs or operations, and measurement errors. Because it is difficult to quantify these factors individually and exactly, Disturbances are stated as random shocks by the white noise process. Thus by a transfer function ARIMA model, we can represent a complicated system instinctively and easily. In order to build ‘Transfer Function ARIMA model’, model-identification process is used by reviewing the object systems in regards to input variables, output variables, manipulating variables and exterior impact factors. The flow chart you see is a schematic of ‘Transfer Function ARIMA model’ in water treatment process. Figure 1 shows correlations of affecting factors in each process.
Figure 1. Schematic Diagram of Transfer Function ARIMA Model for Each Process on Water Treatment System The target model consists of mixing process, sedimentation process, and filtration process. In this study, these are represented for sedimentation process. The modeling process is being done by ‘Transfer Function’, through varying manipulating variables such as quantity of chemicals injected and operational conditions. Regarding the factors
Copyright ⓒ 2015 SERSC
137
International Journal of Control and Automation Vol.8, No.10 (2015)
other than those mentioned above the modeling is conducted by ARIMA, and two models are integrated into one final model. Coagulation-flocculation-sedimentation processes were hypothesized as one procedure for modeling of sedimentation reservoir discharge turbidity of sedimentation process. The reason for hypothesizing these procedures as one model may have different views, but the coagulant injection method of target facilities is a current head method. In the coagulation process, because the paddle’s speed is maintained by season to constantly maintain the change of G value, the procedures were hypothesized as one process because there are no variable factors that can change operating parameter. Target period for modelization was executed based on the same period as coagulant modelization of mixing process. The input affiliation for modelization of sedimentation reservoir discharge turbidity of sedimentation become inflow water quality and coagulant flow rate. Coagulation-flocculation-sedimentation processes are handling processes due to the combination of particles according to coagulant flow rate and agitation intensity. Coagulant flow rate from the influential factors can control sedimentation efficiency, thus being chosen as control variable. Additionally, sedimentation process must include control variable agitation intensity of mixing process and coagulant process in the model. However, because it is difficult to measure for the target water plant, this research composed a model due to ARIMA model as external influential factor, and output affiliation becomes turbidity of sedimentation reservoir discharge. 2.2. Model Estimation and Evaluation On the basis of these obtained results, we will estimate the parameters of the transfer function ARIMA model denoted in equation (Streeter and Phelps, 1925). The order of transfer function (r, s) is assumed to be 1, while we need to investigate the order of noise (p, q) in order to demonstrate the net effect of disturbances on the fitted model. Once the form of the tentative model has been assumed, using the iterative application of linear least squared, we can obtain the parameter values with the ARIMA procedure provided by SAS 12.1. The estimated model will be evaluated statistically by diagnostic checks and test of goodness of fit. First we shall employ autocorrelation check of residuals from the fitted model and discredit inadequate models if the residuals appear to be far from the white noise. We use the criterion Q derived by Ljung and Box (1978). If the value of Q is small in comparison with the Chi-square value for corresponding degrees of freedom, we can declare that there is no ground here for questioning the tested model. Second, we employ the adjusted multiple correlation coefficient. If diagnostic checks are applied to a model fitted to the data in an adequate condition and fail to show serious discrepancies, then we may rightly feel comfortable about using that model. Unfortunately in the case that diagnostic checks demonstrate model inadequacy, we may repeat the steps from the system identification to the model evaluation, checking the factors for input and output variables, the data length for model, and the order of noise model in succession. With these recursive model building processes, we can obtain an efficient system model which will provide a means of conceptualizing and communicating important aspects. Moreover, model validity will be substantiated through judgement from the intended applications of the obtained system model. In this study, Transfer function ARIMA modelization was executed in the order of selection of particle, cross correlation analysis, selection of degree, and decision of model parameter; moreover, cross correlation coefficient was used when selecting particles. Also, statistical indices including Chi-square test, AIC (Akaike infromation criterion), and SBC (Schwartz’s Bayesian criterion) were used for degree decision, and least square technique was used to find the parameter value of the model (Ljung and Box, 1978).
138
Copyright ⓒ 2015 SERSC
International Journal of Control and Automation Vol.8, No.10 (2015)
2. Case Study Our proposed model was applied to a drinking water treatment plant in Korea. The data was used around 7 months from 2012 October ~ 2013 April to model sedimentation reservoir effluent turbidity to perform prediction and verification process of the model. By using the predicted model, prediction capability of sedimentation reservoir discharge turbidity per period of 1 month from 2013 January to February was reviewed. By using the predicted model, the prediction capability about sedimentation reservoir discharge turbidity was reviewed for around 5 days where the turbidity increased temporarily. The sedimentation site outflow water turbidity model used the input variables, the turbidity, pH, alkalinity and flow rate of raw water, and coagulant dose (see Figure 2).
Figure 2. Water Sampling and Chemical Injection Point on Target Water Treatment Plant 3.1. Cross Correlation Analysis This section is the most basic statistic of setting transfer function in transfer function ARIMA Model to execute cross correlation analysis. Cross correlation analysis is the most basic analysis of setting transfer function and also the analysis of measuring which variables have correlation on the sedimentation reservoir discharge turbidity. This analysis considers the influence on parallax where the relationship about particular time different was also analyzed. The variable that becomes the target of analysis is the inflow rate that can influence residence type of raw water turbidity, coagulant dose, pH, alkalinity, and sedimentation process, which are targets of the analysis. The result is shown in Figure 3. Cross correlation analysis is an analysis to find out how transfer function (X 1, X2, X3, ⋯ Xn) influences output affiliation Yt. Here, when the cross correlation coefficient is greater than the value of (n-k)-1/2(n: number of data, k: delayed time lag), it was judged to be significant. The white point in Figure 3 was at significant level, and the black point was the cross correlation coefficient. It is judged to be significant when the cross correlation coefficient is outside the dotted line. As a result of the cross correlation analysis, raw water turbidity, coagulant dose, pH, alkalinity, and inflow rate were all judged as valid variables. Inflow rate was identified to not be significant from parallax 6. Thus, only before parallax 6 shall be considered when applying the model. However, response is completed within parallax 2 for general system. As the parallax becomes longer, the parameter increases the model cannot be identified as a suitable model.
Copyright ⓒ 2015 SERSC
139
International Journal of Control and Automation Vol.8, No.10 (2015)
1.0
Significance Turbidity( (raw water) pH (raw water) Alkalinity (raw water) Flow rate (raw water) PAC Conductivity (raw water)
Cross Correlation Coefficient
0.5
0.0
-0.5
-1.0 0
1
2
3
4
5
6
7
8
9
10
11
12
13
14
15
16
17
18
19
20
21
22
23
24
25
26
27
28
29
30
Lag
Figure 3. Cross Correlation Analysis between Turbidity (Settled Water) and Water Quality 3.2. Selecting Optimal Model This section selected the optimal model of transfer function ARIMA. The accuracy of the prediction model generally increases as there are more input variables that decide goal value. However, this model has weakness of increased preliminary preparation process for prediction according to the increasing information amount that must be collected for the desired prediction. The difference between transfer function and output affiliation value is called residual affiliation which express the delay of input/output value or factors excluding transfer function, and it is modeled as ARIMA. This research did not perform difference, and the difference of the model is composed of difference of AR process, Difference of MA Process, and P and Q. As the difference is low, more stable model is established within secondary difference. The transfer function was hypothesized as 0 difference where the difference R of the denominator is 0, where analysis was performed until secondary difference. Thus, optimal model is having the maximum accuracy as variables of low possible numbers. Indications of these are identified on AIC and SBC index. As the values of these indices are low, the models are identified as superior models. These indices can be used to decide the optimal model. The model was composed of raw water turbidity, coagulant dose, pH, alkalinity, and inflow rate. By changing the difference of transfer function and difference of ARIMA model, the optimal difference was selected. The index used for selection included AIC, SBC, and x2test. The model is significant as AIC and SBC are low, and x2test was judged to be 95% significant; thus, the results are shown in Table 1. Selecting the most appropriate model from the analysis result models may have different conditions, but this research selected the optimal model as the model with small error with actual value in the status of having same conditions as AIC and SBC. Thus, Model 14 was selected. Table 1. Decision of Degree of a Transfer ARIMA Model for Turbidity of Settled Water in Raw Water with Low Turbidity χ
Model degree 2
6239.4
6172.3
1
0
O
8460.2
8393.1
0
1
0
O
8706.3
8633.7
0
1
0
O
1
0
1
0
1
0
1
0
2
0
1
1
0
1
0
1
0
1
0
1
3
1
0
1
0
1
0
1
0
1
0
4
1
1
1
0
1
0
1
0
1
5
1
2
1
0
1
0
1
0
1
140
3
S
O
0
3
R
0
1
2
S
4109.0
0
2
R
4170.5
0
1
S
O
1
1
R
SB C
P
Q
S
AI C
M odel
4
R 4
S 5
R 5
t est
-
-
Copyright ⓒ 2015 SERSC
International Journal of Control and Automation Vol.8, No.10 (2015)
8713.6
8635.4 8633.4
6
2
1
1
0
1
0
1
0
1
0
1
0
O
8711.7
7
2
2
1
0
1
0
1
0
1
0
1
0
O
8715.0
863 1.1
8
0
0
2
0
1
0
2
0
2
0
2
0
O
4240.3
4150.9
9
0
1
2
0
1
0
2
0
2
0
2
0
O
6306.1
6211.1
10
1
0
2
0
1
0
2
0
2
0
2
0
O
8488.8
8393.7
11
1
1
2
0
1
0
2
0
2
0
2
0
O
8733.1
8632.5
12
1
2
2
0
1
0
2
0
2
0
2
0
O
8739.4
8633.2
13
2
1
2
0
1
0
2
0
2
0
2
0
O
8737.5
8631.3
14
2
2
2
0
1
0
2
0
2
0
2
0
O
8741.0
8629.3
P : Backward operator's order of auto-regressive term(AR(P)) Q : Backward operator's order of moving-average term(MA(Q)) R1, S1 : Backward operator's order of first transfer function term(TurbidityR) R2, S2 : Backward operator's order of first transfer function term(pHR) R3, S3 : Backward operator's order of first transfer function term(AlkalinityR) R4, S4 : Backward operator's order of first transfer function term(Flow rate R) R5, S5 : Backward operator's order of first transfer function term(PAC) R
: Raw water
3.3. Optimal Model Verification and Prediction The prediction equation of Model 14 selected as optimal is shown on equation (2). The dispersion about the prediction value and actual value due to the optimal model is shown in Figure 4. When considering that the change rate of whole sedimentation turbidity is 0%, the error rate was identified to be around 3.5%, and it was identified that the coefficient of determination result R2 value was highly predicted of 0.92 on the predicted value. Also, the result of identifying residual as time series is shown in Figure 4. The figure shows randomness without the tendency of residual being increased or decreased. Yt = + 0.076009 – + 0.0006TurbidityR(t)- 0.00307TurbidityR(t-1) - 0.00155TurbidityR(t-2) + 0.0354pHR(t) - 0.00842pHR (t-1) + 0.01009pHR (t-2) + 0.001AlkalinityR(t) + 0.00123AlkalinityR(t-1) + 0.00142AlkalinityR (t-2) + 0.00001Flow rateR(t) + 0.00000913Flow rateR(t-1) + 0.000000403Flow rateR (t-2) + 0.00375PAC + 0.01179PAC(t-1) + 0.00356 PAC (t-2) +
1+0.87557𝐵+0.25023𝐵2 𝑎 1−0.45024𝐵−0.44367𝐵2 𝑡
( Equation 2 )
The result of predicting the remaining period using the decided optimal model is shown in Figure 5. The result shows higher error compared to the modeling period based on the prediction result due to the model, but R2 shows relatively high value. This means that the prediction value and actual value show high relationship showing highly significant results. Table 2. Evaluation by Optimal Model for Turbidity of Settled Water in Estimating Period
Model 14
Copyright ⓒ 2015 SERSC
R2
MAE(NTU)
MAPE (%)
0.92
0.019
3.539
141
International Journal of Control and Automation Vol.8, No.10 (2015)
MAE : Mean Absolute prediction Error MAPE : Mean. Absolute Error (%)
0.3
1.0
0.2
0.8 Residual (NTU)
Real Value (NTU)
0.1
0.6
0.0
-0.1
0.4 -0.2
-0.3
0.2 0.2
0.4
0.6
0.8
10/15/12
1.0
10/29/12
11/12/12
11/26/12
12/10/12
12/24/12
M/d/yy
Estimated Value (NTU)
Figure 4. Correlation of Real and Estimated Turbidity of Settled Water in Estimating Period
Figure 5. Variation of Residuals in Estimating Period
1.2
Estimated Value Real Value
Turbidity (NTU)
1.0
0.8
0.6
0.4
0.2 10/13/12
10/23/12
11/2/12
11/12/12
11/22/12
12/2/12
12/12/12
12/22/12
1/1/13
M/d/yy
(a) 3.0
2.5
Turbidity (NTU)
Predicted Value Real Value 2.0
1.5
1.0
0.5
0.0 1/19/13
1/26/13
2/2/13
2/9/13
2/16/13
M/d/yy
(b)
Figure 6. Variation between Real and Estimated Turbidity of Settled Water in Estimation and Prediction: (A) Estimation, (B) Prediction Table 2. Evaluation by Optimal Model for Turbidity of Settled Water in Predicting Period
Model 14
R2
MAE(NTU)
0.95
0.028
MAPE(%)
5.594 MAE : Mean Absolute prediction Error MAPE : Mean. Absolute Error (%)
3.4. Sensitivity Analysis of Model The Sensitivity analysis was performed to evaluate the influence according to input factor of sedimentation reservoir discharge turbidity, and the following Figure 7 shows
142
Copyright ⓒ 2015 SERSC
International Journal of Control and Automation Vol.8, No.10 (2015)
the sensitivity analysis result about the change of raw water turbidity, pH, alkalinity, flow rate and coagulant dose. Sensitivity analysis divided sections into 30 intervals from minimum value to maximum value by input factors, and the other factors analyzed influence according to the input value per variables after adjusting as mean value. The input range of each influential factor identified turbidity of 1.2~17.2NTU, pH 7.10~7.85, alkalinity of 36~ 54mg/L, flow rate of 4,970~11,100m3/hr, and coagulant dose of 7.15~13.77NTU. As a result of the sensitivity analysis, influence of stay time was identified to be the greatest for sedimentation turbidity of low-turbidity. It is judged that the sedimentation performance reduced by following the reduction of stay time according to the increase of inflow rate for these characteristics.
Figure 7. Performance Comparison of Sensitivity Analysis in Turbidity of Settled Water during Low Turbidity in Raw Water
4. Conclusion This study has developed a model that simulates the effects of inflow water quality, treatment flow rate and the results of control operation have on the outflow water quality. In order to achieve a modelization, the monitoring data of water treatment plants currently in operation were used and, of the statistical models and not the existing physiochemical models, the transfer function ARIMA (Auto-Regressive Moving Average) model that can reflect the dynamic characteristics of the system was used; and the results from which are as follows. 1) As a result of sedimentation reservoir effluent turbidity model, the turbidity of raw water, pH, alkalinity, flow rate, and coagulant dose were used as input variables, and the coefficients of determination of the predicted model were higher than 0.95. 2) Transfer function ARIMA model was used in this research for the modeling of sedimentation process. Transfer function ARIMA model can replicate dynamic status of system where it is possible to diagnose system using the model in the perspective of expressing actual operation status. Also, when using operation control by modeling the well-operated data due to the water treatment plant operator, it can help the water treatment plant operation of new laborer due to the replace of operator according to change of working place or retirement of the existing operator.
Acknowledgements This subject is supported by Korea Ministry of Science, ICT and Future Planning as “Development of IoT-based Urban Underground Utility Monitoring and Management System’.
Copyright ⓒ 2015 SERSC
143
International Journal of Control and Automation Vol.8, No.10 (2015)
References [1] J. C. Crittenden, R.R. Trussell, D.W. Hand, K.J. Howe and G. Tchobanoglous, “Water Treatment: Principles and Design”, 3rd Edition, MWH (2012) [2] W.W. Eckenfelder, “Industrial water pollution control”, McGraw-Hill (1989). [3] A.D. White, N. Verdone, “Numerical modeling of sedimentation processes, Chemical engineering Science”, Vol. 55, No. 12 (2000) [4] N.S. Park, S.Y. Park, S.S. Kim, N. JeongJeong, S.J. Lee, “Establishment of the Refined Model for Prediction of Flocculation/Sedimentation Efficiency Using Model Tree Technique”, Journal of the Korean Society of Water and Wastewater, Vol.20, No.6 (2006). [5] K.H. Lee, J.H. Kim, L.L. Jae, S.H. Chae, “Prediction Models of Residual Chlorine in Sediment Basin to Control Pre-chlorination in Water Treatment Plant”, Journal of the Korean Society of Water and Wastewater, Vol.21, No.5 (2007) [6] G.E.P. Box & G.M.Jkns, “Time Series Analysis, forecasting and control”, Holden-Day (1976) [7] , H.W. Streeter and E.B. Phelps, “A study of the pollution and Natural Purification of the Ohio River”, Public Health Bulletin, 146, USPHS, Washinton, D.C. (1925). [8] G.M. Ljung and G.E.P. Box, “On a Measure of Lack of Fit in Time Series Models, Biometrika”, 65 (1978). [9] SAS Institute Inc. “SAS 12.1 User’s Guide “, 2012 Edition, SAS Institute Inc., Cary, North Carolina, (2012).
144
Copyright ⓒ 2015 SERSC