pluies-débits enregistrés, durent trois étés, dans un bassin versant d'une surface de 1 ha. Les simulations résultantes étaient de mauvaise qualité, néanmoins, ...
Sediment Budgets (Proceedings of the Porto Alegre Symposium, December 1988). IAHS Pubi. no. 174, 1988.
Application of two physically-based sediment yield models at plot and field scales J. M. WICKS Department of Civil Engineering, University of Newcastle upon Tyne, Claremont Road, Newcastle upon Tyne NE1 7RU, UK
J. C. BATHURST Natural Environment Research Council, Water Resource Systems Research Unit, Department of Civil Engineering University of Newcastle upon Tyne, Claremont Road, Newcastle upon Tyne NE1 7RU, UK
C. W. JOHNSON US Department of Agriculture, Agricultural Research Service, Northwest Watershed Research Center, Boise, Idaho, USA
T. J. WARD Department of Civil, Agricultural and Geological Engineering New Mexico State University, Las Cruces, New Mexico, USA
Abstract Two different sediment yield models (SHE and MULTSED) are used to assess the degree to which model parameters calibrated at a small spatial scale remain representative at a large scale. The test data are taken from the Reynolds Creek rangeland research basin near Boise, Idaho, USA. At the smallest scale the water and sediment yield components of both models were successfully calibrated for 32.54 m2 rainfall simulator plots. The calibrated models were then applied to a 1 ha sub-basin for four summer rainfall events. The resulting simulations were poor but were considerably improved by reasonable variations in model antecedent soil moisture contents. The poorest results were those for events for which the measured sediment/water yield ratio differed significantly from that for the simulator plots. For this study, transfer of parameter values between scales was affected more by uncertainties in the model hydraulic functions for dry soil and by differences in test conditions than by any scale effects. Application de deux modèles basés sur la physique pour la prévision du rendement en sédiment à deux échelles spatiales Résumé Deux modèles différents pour la prévision de la production de sédiment d'un bassin versant sont utilisés pour déterminer si les paramètres d'un modèle étalonné à une petite échelle spatiale restent représentatifs à une plus grande 583
J. M. Wicks et al.
584
échelle. Les données expérimentales sont celles du Reynolds Creek, bassin versant semi-aride, du type pâturage, près de Boise, Idaho, Etats-Unis. A la plus petite échelle, les étalonnages des composants pour l'écoulement d'eau et le débit solide des deux modèles étaient effectués avec succès pour les micro-bassins de 32.54 m2 d'un simulateur de pluie. Les modèles étalonnés ont été ensuite appliqués à quatre événements pluies-débits enregistrés, durent trois étés, dans un bassin versant d'une surface de 1 ha. Les simulations résultantes étaient de mauvaise qualité, néanmoins, une amélioration appréciable a été obtenue par la prise en compte de variations raisonnables dans l'humidité antérieure initiale du sol. Les résultats les plus mauvais étaient ceux correspondant au événements caractérisés par des rapports mesurés entre les productions de sédiment et de l'eau qui montrent une différence importante en comparaison avec le rapport mesuré pour le simulateur de pluie. En conclusion, pour cette étude, le transfert des paramètres entre les deux échelles était plus affecté par les incertitudes dans les fonctions hydrauliques pour des sols secs dans les modèles et par les différences dans les conditions expérimentales que par les effets de l'échelle spatiale.
INTRODUCTION A major problem in the application of physically-based soil erosion and sediment yield models is the representation of the soil's ability to withstand erosion. Various indices of soil credibility exist but so far it has not been possible to relate these, other than empirically, to a measurable soil property such as shear strength. Evaluation of the indices therefore depends on field calibration. It would be convenient if this calibration could be carried out at a small spatial scale since data collection is then easiest. However it has yet to be shown that erodibility indices thus calibrated remain representative at significantly larger scales, for which the overall erosion process may differ. In order to examine the problem, two different physically-based models (MULTSED and SHE) are calibrated at a rainfall simulator plot scale (32.54 m2) and then applied at a sub-basin scale of 1 ha, using data from the semi-arid Reynolds Creek rangeland research basin, near Boise, Idaho, USA.
THE MODELS Both models simulate soil erosion arising from raindrop impact and overland flow and the transport of eroded soil by overland and channel flow. Both require erodibility coefficients to account for soil detachment by raindrop impact and overland flow. However, in composition the models differ in important aspects and can therefore provide independent assessments of the calibration and scale problem.
585
Application of two physicaify-based sediment yield models
Short description of MULTSED The MULTSED model was originally developed in the late 1970s at Colorado State University (Li et al., 1979), and has since undergone a variety of modifications (Simons et al, 1981; Wenzel & Melching, 1983; Melching & Wenzel, 1985). In this study, the MS-DOS microcomputer version developed by Ward (1987) is used. Overland flow is determined from rainfall excess over infiltration using the Green and Ampt infiltration equation in the form implemented by Eggert et al. (1979). The flow is then modelled on a single plane using an analytical kinematic wave solution. Sediment transport capacity is calculated by the Meyer-Peter & Millier (1948) and the Einstein (1950) equations for bed and suspended loads, respectively. Sediment is eroded and transported by size fraction based on the site particle size distribution. Short description of SHE (Système Hydrologique Européen) The SHE is a spatially distributed hydroiogical modelling system developed jointly by the Institute of Hydrology (UK), the Danish Hydraulic Institute and SOGREAH (France) (Abbott et al., 1986a,b). UK responsibility currently resides with the NERC Water Resource Systems Research Unit at the University of Newcastle upon Tyne and it is at that University that a soil erosion and sediment yield component has been added to the SHE. Spatial distribution is achieved through the representation of the basin by an orthogonal grid network. Infiltration is determined by the Richards equation and overland flow is routed by the diffusion wave approximation to the St Venant equations. Sediment routing between overland flow squares and in the river system is achieved using a four-point finite difference approximation to the partial differential equation for conservation of sediment mass. For this study the total sediment transport capacity was calculated using the Yalin (1963) equation.
REYNOLDS CREEK DATA The 234 km2 Reynolds Creek basin is operated by the Northwest Watershed Research Center of the US Department of Agriculture's Agricultural Research Service. For this study, data were obtained at the scales of rainfall simulator plots (32.54 m2) and the 1 ha Flats sub-basin, lying immediately adjacent to the simulator plots. At these sites, annual precipitation is about 250 mm, the predominant vegetation is shadscale, the soil is a fine loam and the land use is cattle grazing. Phreatic surface levels are deep and surface runoff occurs by excess of rainfall over infiltration. For the rainfall simulator runs a pair of plots was used, each plot being 3.05 m wide by 10.67 m long laid along a slope of approximately 3%. Water was applied simultaneously to the two plots from a rotating boom simulator at approximately 60 mm h"1 in a sequence of three runs: (a) dry
J. M. Wicks et al.
586
run — 60 minute application to an initially dry soil; (b) wet run — 30 minute application about 24 h after the dry run; (c) very wet run — 30 minute run 30 minutes after the wet run. Further details of the simulator runs, and also the Flats area, can be found in Johnson et al. (1984). For the Flats sub-basin, a data base collected over some 20 years yielded only four summer rainfall events with good sediment yield records, indicative of the problems of sampling sediment yield in an area of low and spatially varying rainfall. Two of the events are isolated (1984 and 1985) while two (in 1983) form a sequence over three days. Data quality is poorer than for the simulator plots and in particular the correlation in timing and rate between rainfall and runoff is not always apparent. It is uncertain whether this reflects the actual rainfall/runoff relationship, problems with the runoff recorder or the distance of about 180 m separating the sub-basin from the raingauge (used to supply the rainfall record). The sediment record for the storms' consists of concentrations from three stage samplers (activated early on the rising limb of the hydrograph) and deposits collected from a sediment detention tank. For the two 1983 events, though, the stage sampling bottles and detention tank were not emptied between the events and therefore the yield for each event had to be estimated based on the ratios of water yields for each event.
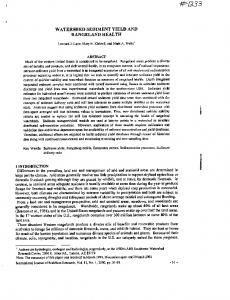
MODEL APPUCATIONS Application of MULTSED to rainfall simulator plots The plots were modelled as single planes and each event from the three-event sequence for each plot was modelled separately. This required that an initial soil moisture content be specified for each event as input to the infiltration component. Data were available for the dry runs (about 33% saturation) and it could be assumed that soil moisture was at maximum for the very wet runs. No information was available for the wet runs but an assumed soil saturation of 90% was found to provide reasonable results. Overland flow resistance was estimated from the measured hydrographs for the very wet runs using a variation on Engman's (1986) approach. An equivalent Mannings roughness value of 0.012 was used for both plots. Calibration of the flow model was carried out with the capillary suction related to the saturated hydraulic conductivity so that only the saturated hydraulic conductivity needed to be optimised. The independent calibrations for the two plots gave a saturated hydraulic conductivity of 0.62 m day"1, which corresponding well with the value of 0.6 m day'1 calculated by Devaurs & Gifford (1984) for grazed plots in the Flats area. Comparison of observed and simulated hydrographs is shown in Fig. 1, indicating that agreement is very reasonable. For the six events considered the percentage error in simulated water yield varies from -9.7% to 6.3% with an average error of -1.7%. For the sediment yield calculations, the water yields for each event at both plots were calibrated individually in order to avoid any bias that might
5 87
Application of two physically-based sediment yield models
be introduced by not having an appropriate simulated water balance. Although the raindrop detachment coefficient in MULTSED can be optimized separately, in this study it was set to a constant value with the overland flow detachment coefficient then calibrated for each plot. The coefficient was found to be about twice as large for the left plot as for the right plot. For the six simulated events, the percentage error in simulated sediment yield varies from -17.1% to 17.4% with an average error of 0.02%.
1500 1520 1540 1560 1580 1600 Time from start of first rain application (min)
Fig. 1 Comparison of measured and simulated water and sediment discharges for a three-event sequence on the rainfall simulator plot. Since MULTSED gives only total yield a. time-varying sediment discharge cannot be shown. Application of MULTSED to Flats sub-basin The sub-basin was modelled as a single plane 218.2 m long by 46.0 m wide. Measured antecedent soil moisture contents were available for all but the second August 1983 event for which an initial value of 90% saturation was assumed. Simulations based on the plot-calibrated parameters and measured or assumed antecedent soil moisture conditions gave generally poor results (Table 1). Subsequent recalibration for the Flats sub-basin showed that simulated and measured water yields for the events of 23 August 1983 and 24 May 1985 could be matched on the basis of reasonable variations in antecedent moisture conditions from the measured or assumed values (-15% and +16% change in value, respectively), with no other changes in model parameters. However, matching the water yields for the other events required unrealistic changes in hydraulic conductivity (doubled for the event of 20 August 1983) or antecedent soil moisture conditions (almost 100% saturation for the event of 30 August 1984). Sediment yield predictions associated with the water yields based on the plot-calibrated parameters were correspondingly poor (Table 1). Using the fitted water yields, but still with the plot-calibrated sediment detachment coefficients, reasonable yields could be simulated for the 20 August 1983 and
588
J. M. Wicks et al.
23 August' 1983 events. For the other events, though, the simulated values were an order of magnitude too low (Table 1). Table 1 Measured and calculated values of water and sediment yield for all events simulated at the Flats sub-basin Event
Water yield (m )
Sediment yield (kg)
Meas- Calculated by MULTSED ured
Calculated by SHE
Measured
Parameters fitted for plots Flats
Parameters fitted for plots Flats
20/8/83 4.41
54.33 (1132)
4.44 (0.7)
55.1 (1150)
3.41 (-23)
23/8/83 1.24
5.69 (359)
1.22 (-1.6)
1.9 (S3)
1.17 (-5.6)
1.35 (0)
1.56 (16)
83.1
(-) 0.26 (-92)
3.59 (9.5)
191.3
30/8/84 1.35
0
(-) 24/5/85 3.28
1.99 (-39)
3.19 (-2.7)
0
Calculated by MULTSED
Calculated by SHE
Parameters fitted for plots Flats water
Parameters fitted for plots Flats water
23.8
77.3 (225)
17.8 (-25)
422 (1673)
24.5 (2.9)
6.7
18.3 (173)
6.8 (1.5)
9.6 (43)
6.2 (-7.5)
0
10.2 (-88)
0
(-)
(-)
10.0 (-88)
14.0 (-93)
18.6 (-90)
0.82 (-100)
29.2 (-85)
Note: The value in brackets below each calculated yield is the percentage error in that yield relative to the measured value.
Application of SHE to rainfall simulator plots Each plot was modelled by a single grid rectangle but, unlike the MULTSED application, each three-event sequence was simulated on a continuous basis over 26.5 h. Antecedent soil moisture conditions were therefore required for the dry runs only, with the model determining the conditions for the wet and very wet runs. Saturated hydraulic conductivity was set to the value of 0.6 m day"1 calculated by Devaurs & Gifford (1984). Calibration of the flow model was carried out by varying the Manning overland flow roughness coefficient and the Averjanov soil coefficient (used in the calculation of hydraulic conductivity as a function of water content (Mualem, 1978)). The calibrated value of the Manning coefficient was obtained by visually matching the shapes of the simulated and measured hydrographs and, at 0.1, compares well with the value of 0.13 recommended by Engman (1986) for rangeland. The Averjanov coefficient was calibrated by minimizing the total percentage error in water yield for the six events combined. The resulting value of 15 is within the range given for comparable soil types by Mualem (1978). Observed and simulated hydrographs are compared in Fig. 1, the percentage errors in water yield for the individual hydrographs varying between -26.9% and +42.7% with an average error of 2.0%. Generally the hydrograph shapes are well simulated especially for the wet and very wet
589
Application of two physically-based sediment yield models
runs, indicating the ability of the model to simulate antecedent soil moisture conditions correctly. For the dry runs, simulated start of runoff is typically 10 minutes late and the hydrograph shape is less well simulated. The delay is also apparent in the hydrographs produced by MULTSED. For the sediment yield calibrations, the two soil erodibility parameters were determined using the measured runoff values and the canopy drainage calculated by SHE. As the functions defining sediment detachment by flow and raindrop impact have different behaviours, it was possible to establish a correlation between the two detachment coefficients within the functions by comparing shapes and volumes for the six sediment graphs. Then, with the ratio of flow to rainfall detachment coefficient held constant at the determined value, the magnitudes of the coefficients were varied until the total percentage error for all six sediment yields was minimized. In this way the same coefficient values were used for each plot, whereas different values were used for each plot by MULTSED. Comparison of observed and simulated sediment yield variations for a three-event sequence is shown in Fig. 1. For the six events, the percentage error in simulated sediment yield varies from -17.5% to 18.2% with an average error of -7.3%. Application of SHE to Flats sub-basin Forty-five squares of 15 m by 15 m were used to simulate the sub-basin. The two single events were modelled separately while the paired events of August 1983 were modelled as a continuous sequence. Runoff simulations based on the plot-calibrated parameters were generally poor, except for the second of the paired events (indicating again the ability of SHE to simulate antecedent soil moisture conditions) (Table 1). Sediment yield predictions were correspondingly in error (Table 1). Simulated and measured water yields for the events of 20 and 23 August 1983 and 24 May 1985 could be matched on the basis of reasonable variations in antecedent soil moisture contents from the measured (or SHE calculated) values (-14%, - 3 % and +8% change in value, respectively) with no other changes in model parameters. For the event of 30 August 1984, though, an unrealistic increase of 125% of the measured value was needed to give a good fit. Using the fitted flow hydrographs, but still with the plot-calibrated detachment coefficients, good sediment yield simulations were possible for the paired August 1983 events, but the other two events show significant underestimation (Table 1).
DISCUSSION Both models were successfully calibrated for the rainfall simulator plots, suggesting that, although designed differently and using different calibration parameters, both are valid representations of the erosion and sediment yield processes for the study area. Their equally poor performance for the Flats sub-basin may therefore be attributed to either data problems or scale effects,
/. M. Wicks et al.
590
rather than model deficiencies. The results indicate that, in this case, any scale effects are obscured by data problems. First, it is apparent from both the plots and sub-basin results that there are difficulties in simulating the hydrograph for an initial or isolated event with low antecedent moisture content. At both scales the results improve for subsequent events in a sequence, for which antecedent moisture contents are higher. This suggests that the poor results arise from uncertainty in defining the model soil hydraulic functions (relating moisture content, tension and conductivity) for dry conditions. Field applications in semi-arid areas should therefore ensure careful evaluation of these functions. Second, the soil erodibility coefficients were calibrated for only one rainfall rate (60 mm h"1) which gave ratios of sediment yield to water yield of 1.0 kg m"3 and 1.3 kg m"3 for the two plots. For the Flats sub-basin, the sediment/water yield ratios for the paired 1983 events (for which reasonable sediment yields could be predicted based on fitted water yields) were not dissimilar at 5.4 kg m"3. For the events of 30 August 1984 and 24 August 1985, though, the sediment/water yield ratios were significantly higher at 61.7 kg m"3 and 58.2 kg m"3 respectively. Also, the rainfall energy from the rainfall simulator is less than that experienced in a natural event. The poor simulations probably therefore reflect the use of erodibility coefficients well outside the range of conditions used for their calibration. In this particular case, the range of calibration conditions was limited to that available from the rainfall simulator study, which was designed to evaluate the Universal Soil Loss Equation parameters rather than to reproduce natural events at the Flats sub-basin. More generally, though, if small-scale field calibration is to be used, it is important that the experimental conditions reflect the type of events that need to be simulated at the larger scale. The results illustrate the importance of obtaining good water yield simulations as the prelude to simulating sediment yield. A particular problem at the Flats sub-basin is that measured runoff is only about 1% of the rainfall input. Thus a small absolute error in simulated runoff translates into a large percentage error in simulated runoff and thence in sediment yield. The study suggests that transfer of calibrated parameter values from the scale of the rainfall simulator plots to the 1 ha scale is feasible, provided the calibration has a suitable data base. For the future, therefore, to allow full calibration and validation of physically-based sediment yield models, the data should ideally include detailed field measurements of such quantities as soil moisture profiles and soil erosion and transport patterns, as well as the outlet hydrograph and sediment graph which traditionally provide the basis for calibration. Acknowledgement The work was supported by NATO Collaborative Research Grant 0520/87 and sabbatical funding for T. J. Ward from New Mexico State University. REFERENCES Abbott, M. B., Bathurst, J. C, Cunge, J. A., O'Connell, P. E. & Rasmussen, J. (1986a) An
591
Application of two physically-based sediment yield models
introduction to the European Hydrological System - Système Hydrologique Européen, "SHE", 1: History and philosophy of a physically-based, distributed modelling system. /. Hydrol 87, 45-59. Abbott, M. B., Bathurst, J. C, Cunge, J. A., O'Connell, P. E. & Rasmussen, J. (1986b) An introduction to the European Hydrological System - Système Hydrologique Européen, "SHE", 2: Structure of a physically-based, distributed modelling system. /. Hydrol 87, 61-77. Devaurs, M. & Gifford, G. F. (1984) Variability of infiltration within large runoff plots on rangelands. /. Range Management 37 (6), 523-528. Eggert, K. G., Li, R. M. & Simons, D. B. (1979) Time explicit formulation of the Green-Ampt infiltration equation. Proc. 18th Congress IAHR (Cagliari, Italy), vol.5, 145-152. Einstein, H. A. (1950) The bed load function for sediment transportation in open channel flows. Tech. Bull. 1026. USDA, Soil Conservation Service, Washington, DC. Engman, E. T. (1986) Roughness coefficients for routing surface runoff. /. Irrig. Drain. Div. ASCE 112 (1), 39-53. Johnson, C. W., Savabi, M. R. & Loomis, S. A. (1984) Rangeland erosion measurements for the USLE. Trans. Am. Soc. Agric. Engrs. 27 (5), 1313-1320. Li, R. M, Simons, D. B., Fullerton, W. T., Eggert, K. G. & Spronk, B. E. (1979) Simulation of water runoff and sediment yield from a system of multiple watersheds. Proc. 18th Congress IAHR (Cagliari, Italy), vol.5, 219-226. Melching, C. S. & Wenzel, H. G. (1985) Calibration procedure and improvements to MULTSED. University of Illinois, Department of Civil Engineering Hydraulic Engineering Series no. 38. Prepared for the US Army Corps of Engineers, Construction Engineering Research Laboratory, Champaign, Illinois. Meyer-Peter, E. & Miiller, R. (1948) Formulas for bed-load transport. Proc. 2nd Meeting International Ass. Hydraul. Struct. Res. (Stockholm, Sweden), 39-64. Mualem, Y. (1978) Hydraulic conductivity of unsaturated porous media: generalized macroscopic approach. Wat. Resour. Res. 14 (2), 325-334. Simons, D. B., Li, R. M., Fullerton, W. T., & Wolf, C. G. (1981) User's manual multiple watershed model for water and sediment routing considering cohesive soils. Prepared for New Mexico State Univ. by Simons, Li and Associates, Inc., Fort Collins, Colorado. Ward, T. J. (1987) Adaptation and testing of a rainfall-runoff, surface erosion model for army training impact prediction. New Mexico State Univ. Engineering Research Center. Completion Report for Contract DACA88-83-M-0854. Prepared for US Army Corps of Engineers, Construction Engineering Research Laboratory, Champaign, Illinois. Wenzel, H. G. & Melching,. C. S. (1983) Sensitivity of sediment yield simulation models to rainfall parameters. Univ. of Illinois, Department of Civil Engineering. Prepared for the US Army Corps of Engineers, Construction Engineering Research Laboratory, Champaign, Illinois. Yalin, M. S. (1963) An expression for bed-load transportation. J. Hydraul. Div. ASCE 89 (HY3), 221-250.