advantages, it is still a rare bird in the practice of control engineering. One of the reasons of that is that the languages commonly used for specification of.
APPLICATION OF VISUAL SPECIFICATIONS FOR VERIFICATION OF DISTRIBUTED CONTROLLERS VALERIY VYATKIN and HANS-MICHAEL HANISCH Automation Technology Group, Department of Engineering Science, Martin Luther University Halle-Wittenberg, Dept. of Engineering Sciences, D-06099 Halle, GERMANY Abstract In a search of an appropriate visual specification language to be applied in control engineering the timing diagram specification language is suggested. It is applied to the verification of distributed controllers following the standard IEC 61499. Specification of inputs and outputs of the controller are given in the graphical form of signal diagrams. The inputs are then converted into finite-state models, while the diagram of outputs is used to build equivalent analytic expressions in extended CTL. These two parts are used in formal verification of the control system. Keywords Timing diagrams, IEC modeling, verification 1
61499,
discrete-event
Introduction
Controllers in industrial automation interact in a closed-loop way with the system under control, called plant. A major issue in the controller design is to guarantee that the plant shows some desired behavior and/or does not realize some kind of forbidden (dangerous) behavior. Formal verification of control systems, introduced in [2], [3] extends the borders of common testing. It can be done automatically using formal models of plant, controller, and formal specifications of desired (or undesired) behavior. Currently verification of controllers is a quite popular topic of research in academia. However, despite of its numerous advantages, it is still a rare bird in the practice of control engineering. One of the reasons of that is that the languages commonly used for specification of properties, such as temporal logic, are not familiar to the potential users of such systems, i.e. control engineers. On the other hand the variety of possible patterns of specifications in control engineering is quite limited. The following patterns of specification are the most commonly used in verification of control systems: 1. Safety properties, describing presence or absence of dangerous states in the reachability space of the model; 2. Freedom from deadlocks, i.e. absence of the states having no successor states in the reachability space.
3. Reactivity, which ensures that a certain input combination always causes the corresponding reaction. 4. Compliance with linear specification (such as scenario, recipe, etc.). This type of specification is usually presented as a linear or cyclic state chart. In this work we study applicability of timing diagrams to be used in the role of specification language. Timing diagrams of signals are widely used in the technical literature and documentation on digital devices as a convenient and rigorous form of data presentation. Recently a special interest has been shown to the application of timing diagrams as means of specification of input/output behavior for further application in formal verification of hardware [4,5,6]. Despite of many similarities with the hardware design, the verification in automation has essential particular features. The necessary part of the verification of control systems are models of plants providing the adequate asynchronous dynamics. Semantics of controllers is also quite different from that of digital devices. In this paper we focus on the issues specific for application of timing diagrams for specification and verification purposes of some classes of industrial automation systems. The paper is structured as follows. In Section 2 we briefly introduce modeling of distributed control systems using Net Condition/Event systems. Then, in Section 3, based on the constraints of the modeling framework and requirements of the application domain, we define the timing diagrams specification language. In Section 4 the implementation issues are presented, and in Section 5 an example of application is given. The paper is concluded by a summary of advantages and disadvantages of the proposed approach. 2 Modeling using Net Condition/Event Systems Formal verification seems to be especially beneficial when applied to distributed control systems. For formal verification of such systems we are developing an integrated software package VEDA Verification Environment for Distributed Applications [11]. VEDA is destined for direct application by control engineers, in order to extend their testing capabilities. The input for VEDA is a source code of
Proceedings of the 2001 IEEE Systems, Man, and Cybernetics Conference Copyright ? 2001
distributed control application, represented according to IEC61499, that is a new international standardunder-development [1]. In IEC61499 an application is a net of function blocks, having event and data inputs and outputs. Each function block implements a particular controller, or a control function. Its functionality is programmed by state charts and languages of IEC61131. Further, in Section 5 an example of such an application is presented. As the underlying modeling formalism, VEDA uses the Net Condition/Event Systems (NCES) [7] – a Place/Transition net with modularity support. VEDA automatically generates the NCES model of controllers presented as IEC61499 function blocks, and performs model-checking in closed-loop with manually developed NCES models of plants. VEDA performs the model-checking of specifications given in eCTL [13], an extension of CTL designed to refer to both state and state-transitions in formulae. The Timing Diagram Specification Language (TDSL), described in this paper, provides a way of visual specifications complementary to eCTL. Net Condition/Event systems is a finite state formalism which preserves the graphical notation and the non-interleaving semantics of Petri nets, and extends them with a clear and concise notion of signal inputs and outputs.
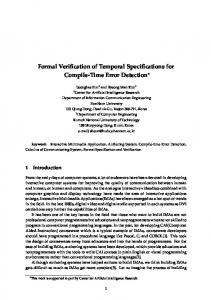
Figure 1. Two NCES modules interconnected by condition and event arcs.
Given a place/transition net N ? (P,T,F,m 0 ) with set of places P, set of net transitions T, flow relation F, and initial marking of places m0, the Net Condition/Event system is defined as a tuple N ? (N,? N ,? N , Gr) , where ? N is an internal structure of signal arcs, ? N is an input/output structure, and Gr ? T is a set of so called "obliged" transitions. The structure ? N consists of condition and event inputs and outputs ci,ei,eo,co. The structure ? N is formed from two types of signal arcs. Condition arcs lead from places and condition inputs to transitions and condition outputs, providing additional enableness conditions of the recipient transitions. Event arcs from transitions and event inputs to transitions and event outputs provide one-sided synchronization of the recipient transitions: firing of the source transition forces firing of the recipient, if the latter is enabled by the marking and conditions.
The NCES modules can be interconnected by condition and event arcs, forming thus distributed and hierarchical models. Figure 1 shows an example of NCES which consists of two interconnected modules. NCES having no inputs are called Signal-Net Systems (SNS) [8,12]. The model in Figure 1 is a SNS. The SNS can be analyzed without any additional information about its external environment. Semantics of SNS covers both asynchronous and synchronous behavior that is necessary when modeling of interconnected plants/controller system is concerned. A state of the NCES module is completely determined by the current marking m: P ? N 0 of places and values of inputs. A state transition is determined by the subset ? ? T of simultaneously fired transitions, called step. The transitions having no incoming event arcs are called spontaneous, otherwise forced. A step fully determines the values of eventoutputs of the module. A step is formed by selection of some of the enabled spontaneous transitions, and all the enabled transitions forced by the transitions already included in the step. Thus both states and transitions of NCES models are distributed, that allows more efficient modeling of distributed systems. A tuple M ? S,R,s1,? denotes the reachability graph of a SNS N, where S is a finite set of reachable states, R ? S ? S is a finite set of transitions between states, and s1 ? S is an initial state. The state transitions are marked by the corresponding steps ? : R ? 2 T . A state trajectory is a (possibly infinite) sequence of states (s) ? s1, ,s i ,s i ? 1, in a path of the reachability graph, starting in the root s1 . Scenarios of model’s behavior correspond to the trajectories. The states of the model along a trajectory can be represented by means of symbol sequences, i.e. words, or graphically, by diagrams.
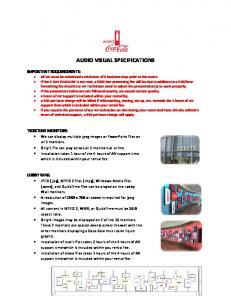
Figure 2. Reachability graph of the interconnected NCES model with outlined path and state diagram of input/output signals of the modules.
In timed NCES arcs from places to transitions are marked with time intervals, defining low and high limits of the transition’s enableness. All places bear the clocks counting the age of the marking. Then, a transition is enabled not only when its pre-places are sufficiently marked, but also when values of their
Proceedings of the 2001 IEEE Systems, Man, and Cybernetics Conference Copyright ? 2001
clocks are within the time intervals of the incoming arcs of the transition. Clocks of marked places increase their values by discrete units when there are no enabled transitions in the state, but some of the transition might become enabled after such an increment of clocks. As a direct consequence, the states have attribute “delay”, that specifies time increment of the clocks of this state with respect to the clocks of its predecessors. It can be said also that state transition ? : Si ? S j has duration ? , if the state Sj has such a delay. The following features specify modeling of control systems, composed of IEC61499 function blocks and model of plant, by NCES: 1. Every Boolean variable of the original block (or in the plant model, e.g. Boolean sensors) is modeled by an NCES module with two places, similar to Module 2 in Figure 1. Thus for each Boolean variable a, there exists a place in the model marked iff the original variable has value 1, and there exist exactly two transitions, one of which corresponds to the event a+ (when a changes its value from 0 to 1), and the other to event a- (from 1 to 0). 2. Event variables of function blocks acquire nonzero values only instantaneously. These are modeled by firing of net transitions. Figure 2 shows the reachability graph of the model from Figure 1. A trajectory is outlined in the graph and some parameters of the model are shown along the trajectory in the graphical form of state/time diagram. To present concise relation between the finite specification and infinite behavior of the model we use the notation of input/output event languages, adopted from [9,10]. Some necessary definitions follow. The state of the model can be also determined by a sequence of events, related to each parameter. Let us denote relevant parameters of the model in Figure 1 as a=M1.eo1, b=M1.co1, c=M2.co1. Then, event a+ occurs iff transition t2 fires, denoted as a ? ? t 2 . Similarly b ? ? t1 ? t 2 , b ? ? t 3 , c ? ? t 4 , c ? ? t5 . Taking symbols {a+,b+,b-,c+,c-} as basic event alphabet M of the model, a state transition step can be represented as a non-ordered subset of M, called parallel symbol. For example, the step corresponding to the state transition S1 ? S3 is defined as
(a ? , b ? , c ? ) , and step S3 ? S4 as (b ? ) . Set 2M forms the alphabet of parallel symbols, that describe changes of relevant parameters of the NCES model. For simplicity we denote 2M as event alphabet of the model. A finite part of any trajectory can be represented then as string of the event alphabet, and
the behavior of the model can be represented by language LM, comprising all such strings. VEDA deals with both timed and non-timed models. Operations in the controllers defined according with IEC61499 are driven by events coming from plant. Correspondingly, in the NCES model of controllers unit operations in the controller are modeled by state transitions having zero time duration. Quantitative measurement of such durations can be realized by counting their number. Some timeconsuming processes in the plant are modeled by state transitions having non-zero duration. This durations are ignored by VEDA if the non-timed model option is selected. 3 Timing Diagram Specification Language The works [4,5,6], where timing diagrams were used for specification and verification of hardware devices, show some approaches to formalization of diagram’s syntax and semantics. These are quite similar to each other, though have certain variations. Thus, in [4] the timing diagrams are defined as a collection of waveforms that determine a finite sequence of events (i.e. value changes) of a particular variable of the modeled system. For simplicity we constrain ourselves with two types of the parameters: impulse (or event) parameters, and Boolean parameters.
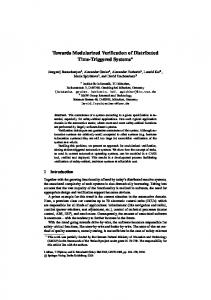
Figure 3. Sample timing diagram specification.
Collection of waveforms defines in general an asynchronous product of the corresponding event sequences. Thus a timing diagram may define a number of possible behaviors of the model. To restrict some of the behaviors, so called sequential dependencies between any two events (possibly belonging to different waveforms) can be used. Each dependency (e.g. between events e1 and e2) is specified by a timing interval [lo,hi] (where lo ? N ? {0} , hi ? N ? {0} ? {? } ), meaning that e2 occurs after e1 within the [lo,hi] time bounds. Along with the time interval constrains we introduce the following qualitative constraints used to specify the sequential dependencies: > event e2 occurs later than e1. ? event e2 occurs not earlier than e1. ? event e2 does not occur simultaneously with e1; ? event e2 occurs exactly in the next state to e1;
Proceedings of the 2001 IEEE Systems, Man, and Cybernetics Conference Copyright ? 2001
= events e2 and e1 occur simultaneously; Figure 3 shows an example of a timing diagram with such qualitative constrains imposed. In the rest of this paper, for simplicity we deal with specifications having only qualitative constrains. Default constraint between consequent events is ? . A timing diagram specifies only a finite behavior of the model, i.e. that can be represented as a finite set of finite strings in alphabet 2M. Let us call this set finite language of the diagram and denote it by LD. We define that a string a admits string b (denoted a b ) iff the projected string a | b , obtained from a by removing all symbols not present in b, includes b as a substring. For example strings ‘mnnk’, ‘mnkk’ admit string ‘mk’, while string ‘kmnn’ does not admit ‘mk’. An infinite string s ? LM is said to admit specification diagram D (denoted s D ) if it admits at least one of the strings in LD. We explicitly divide our specification diagrams to the input and output parts. Input and output projections s | Inp , s | Out of a specification string
s ? LD denote correspondingly projections of s to the basic alphabets of input and output events. Inp(D),Out(D) denote correspondingly sets of input and output projections of strings from D. Two following approaches to verification with TDSL have been studied: Closed-loop. When the model consists of plant and controller interconnected in closed loop, the TDSL is used to specify visually a collection of finite scenarios which then have to be checked with respect to the (infinite) behavior of the model. The specification is automatically translated either to eCTL, or to the corresponding NCES model, which then serves as a supervisor of the original model. The following semantic interpretations can be used: Existence of the specified behavior: At least one of the finite scenarios, specified by the timing diagram occurs in the infinite behavior of the model, that means ? s ? LM : s D. Existence of all specified scenarios. All finite scenarios occur in the infinite behavior of the model ? c ? D? s ? L M : s c. Generality of the specified behavior: All trajectories in the infinite behavior of the model satisfy to the specification, i.e. each infinite trajectory satisfies to one of the finite scenarios: ? s ? LM ? c ? D : s c. Conditional existence: For all trajectories, where the specified input behavior holds, the output behavior also holds: ? s : s | Inp Inp(D) ? s D. These properties can be expressed in eCTL and proved with respect to the original model and model of specifications using the model-checker of VEDA.
Open-loop. Sometimes the closed-loop pattern cannot be applied. For instance, a model of plant could be not available, or verification of only some parts of the control system is required. In this case the part of TDSL specification corresponding to the input is used to generate the NCES model of input behavior, while the other, output part is translated to the corresponding eCTL specification. The interconnected model, obtained after connecting the NCES model of inputs with an automatically generated model of SNS controller, is used then in model-checking. In the open-loop pattern the input part of specification is guaranteed to hold for all possible behaviors of the model. Then verification inquiries should refer only to the output behavior of the model. 4
Implementation of TDSL
Basic principles of NCES model generation for timing diagrams refer to both closed-loop and openloop verification patterns.
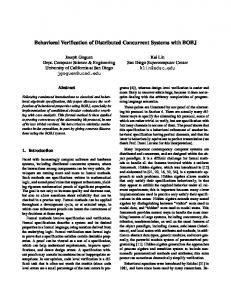
Figure 4. NCES model of the timing diagram specification from Figure 3.
The model is composed from the following modules: Generators of the event sequence for each waveform of the diagram. It implements generation of events in the order described in the diagram, taking into account the sequential constraints. Data implementation module for every input signal of the diagram. Those data modules which model input parameters have to be directly connected to the inputs of the verified model, while the outputs can be used to check admissibility of the specification. Transitions of the event generators are connected to the data implementation modules by event arcs. Assuming that both parameters A and B in Figure 3 belong to the input of the model, an example of the corresponding generator is presented Figure 4. Each event contained in the diagram is mapped into a transition of the event generator, which sets the corresponding values of the signals by means of the event arcs attached to the corresponding inputs of the model modules. It is obvious, that the specification as given in Figure 3 is more transparent for a potential user than its NCES implementation.
Proceedings of the 2001 IEEE Systems, Man, and Cybernetics Conference Copyright ? 2001
5 Example of application Distributed control systems (DCS) represent state of the art in the industrial automation technology bringing a lot of benefits to control engineers: flexibility, easy reconfiguration and reduction of costs. However, the logic of execution of the system obtained by interconnection of many local controllers often becomes non-tractable. Therefore benefits of formal verification are even more convincing for the DCS. For illustration consider a sample part of a manufacturing system as shown in Figure 5, that consists of a transporter (TS) moving workpieces between input and output trays. The buttons "LOAD" and "UNLOAD" serve to initiate the corresponding actions. Instead of the trays other similar transporters can be present in the input/output positions. The transporter itself consists of the STATION with conveyor, where the workpiece rests, and turning mechanism that moves the station between the positions.
Figure 6. Block diagram of the control system, that includes distributed controller (blocks TS_CONTROL, INTRAY.CTL, OUTTRAY.CTL), and models or interfaces to the plant (blocks Transporter, IN.TRAY, OUT.TRAY, BT”LOAD”, BT”UNLOAD”)
Figure 5. Transfer system.
The controller of the transporter uses values of the following sensors: HOME - station is in the loading position, END- station in the unloading position, WF workpiece is on the station. Actions of the device are driven by the following signals: LD - loading of the station; UNLD - unloading of the station; ADV move the station from HOME to END; RET - move the station from END to HOME. The input and output trays are also equipped with conveyors, controlled in the manner similar to the control of the stage: signal LD moves transporter inward, and the signal UNLD in the opposite direction. Sensor WI reports presence of the workpiece on the tray. The distributed control system of the plant is shown in Figure 6 as a block diagram composed from the function blocks following the IEC 61499. The blocks colored in gray represent parts of the plant: buttons "LOAD" and "UNLOAD", the transfer stage and the trays. The blocks of white color represent parts of the distributed controller: controller of the transfer stage, two instances of the block TRAY, controlling input and output trays, and two instances of the block FILTER which convert pressing of the buttons into corresponding event impulses.
Figure 7. Execution control chart of the controller of transporter.
According to IEC 61499, function blocks interact via event signals connected to the block's "head" and data signals connected to the block's "body". The head is responsible for the execution logic, while the body contains algorithms of data processing. The execution logic is defined by state machine called execution control chart. A ECC state may have associated algorithms' calls and output event signal assignments. The execution control chart of the controller of transporter is presented in Figure 7. Consider an example of the open-loop verification of a property of the controller of Transporter (FB "TS controller"). The property is explained as follows. During the loading, the sequence of triggering of the inductive sensors WI and WF may depend on their sensitivity. If the sensors detect presence of the workpiece in the close vicinity then the sequence is WI off, then WF on. When the sensors are of greater sensitivity, the behavior changes – first WF goes on and then WI goes off. It is important to ensure correctness of the controller regardless of the exact parameters of the sensors, i.e.
Proceedings of the 2001 IEEE Systems, Man, and Cybernetics Conference Copyright ? 2001
Figure8. Timing diagram specification , reachability graph of the open-loop model state/timing diagrams representing one of the scenarios of the behavior.
the test input required where the sequence of the events is not specified exactly. The specification using TDSL consists of two steps: 1. A timing diagram of one scenario of the behavior is prepared as shown in Figure 8. Thus a linear specification is obtained which can be used for checking existence of such a scenario in the model’s behavior. 2. Next step is to add some “non-determinism” to the linear specification. For this purpose we assign the “non-simultaneous” and “later” constrains to some events, in particular to those corresponding to events “WI off” and “WF on”. The new specification ceased to be linear, as it is shown in Figure 8. It corresponds to the branching reachability graph, with two possible trajectories, in one of which event “WI off” precedes “WF on”, and in the other “WF on” precedes “WI off”. Timing diagram representing one of the scenarios is also shown in Figure 9. In both trajectories, however, outputs LD and ADV behave in accordance with the specification. Conclusion The suggested way of specification using timing diagrams shows some features, which make its application beneficial in verification of control systems, namely: ? ? It is more visual and familiar to control engineers than temporal logic; ? ? It allows easier extension of linear specifications with some non-determinism, such as nondetermined sequence of some events, nondetermined values of some variables in certain intervals, than for example state charts. Certainly, semantics of timing diagrams is much weaker in general, than that of both its counterparts. On the other hand, it covers many cases of specification taking place in control engineering. That ensures its applicability in the practice as an additional, problem-oriented means of specification.
Acknowledgement The work is supported by the Deutsche Forschungsgemeinschaft under reference Ha1886/10-1. References 1. Function Blocks for Industrial Process Measurement and Control Systems, International Electrotechnical Commission, Tech.Comm. 65, Working group 6, Geneva, 1998 2. E.Clarke, E.A. Emerson, and A.P. Sistla: Automatic verification of finite state concurrent systems using temporal logic, ACM Trans. on Programming Languages and Systems, (8):pp.244--263,1986 3. .S. Ostroff. Temporal Logic for real-time systems, Wiley, London, 1989. 4.K.Fisler: Timing diagrams: Formalization and algorithmic verification. Journal of Logic, Language, and Information, 8(7), July 1999. 5.N.Amla, E.Emerson, R.Kurshan, and K. Namjoshi: Model checking of synchronous timing diagrams. Proc. of Conference on Formal Methods in Computer Aided Design (FMCAD)}, November 2000 6.R.Schlor, A.Allara, and S.Comai. System Verification using UserFriendly Interfaces. In Design, Automation and Test in Europe, pp. 167-172. IEEE Computer Society Press, 1999 7. Rausch, M., H.-M. Hanisch. Net condition/event systems with multiple condition outputs. In: Symposium on Emerging Technologies and Factory Automation, 1995. Vol.1., INRIA/IEEE. Paris, France. pp.592--600. 8. P.Starke: Symmetries of signal-net systems. Workshop on Concurrency, Specification and Programming, pages 285--297, October 2000 9. Ramadge P.J. and Wonham W.M., Supervisory Control of a Class of Discrete Event Processes, SIAM J Control Optimisation, 25(1), pp.206— 230, 1987 10. R.S.Sreenivas, B.H.Krogh: On condition/event systems with discrete state realizations, Discrete Event Dynamic Systems: Theory and Applications, 2(1):209--236, 1991. 11. Vyatkin V., Hanisch H.-M.: Software environment for automated verification of distributed industrial controllers following IEC61499, Proc. Of XII Workshop on Supervising and Diagnosing of Machining Systems, Karpacz, 2001 12.V.Vyatkin, H.-M. Hanisch. Practice of modeling and verification of distributed controllers using Signal/Net systems. Proc. of Workshop on Concurrency, Specification and Programming, pp. 335--349, Berlin, 2000 13. S. Roch Extended computation tree logic, In Proc. of Workshop on Concurrency, Specification and Programming, Berlin, 2000.
Proceedings of the 2001 IEEE Systems, Man, and Cybernetics Conference Copyright ? 2001