enhance the 802.11 MAC to expand support for applications with QoS (Quality of Service) requirements [2]. The IEEE. 802.11e MAC supports HCF (Hybrid ...
Application–Level and User–Level QoS Assessment of Audio–Video Transmission with EDCA of IEEE 802.11e Takahiro Suzuki†, Kenta Yamada††, Masami Kato†††, and Shuji Tasaka†† †
Faculty of Social and Information Sciences, Nihon Fukushi University 26-2 Higashihaemi-cho, Handa, Aichi 475-0012 Japan. †† Graduate School of Engineering, Nagoya Institute of Technology Gokiso-cho, Showa-ku, Nagoya 466-8555 Japan. ††† Personal Electronics Group, New System Equipment Unit, SANYO Electric Co., Ltd. 1-1 Sanyo-cho, Daitou, Osaka 574-8534, Japan. Abstract This paper studies audio–video transmission in a wireless LAN with the EDCA of the IEEE 802.11e MAC protocol in terms of application–level QoS and user–level QoS (i.e., perceptual QoS). By simulation, we first compare the performance of the EDCA and the legacy IEEE 802.11 DCF in the case where audio, video, and data are transmitted in a common wireless channel. The EDCA supports priority control for multimedia transmission. Numerical results show that the EDCA can improve the audio and video quality of the DCF when data traffic load is heavy. We then study the effects of dynamic video–resolution and media synchronization control on the application–level QoS. Simulation results show that the two kinds of control at the application layer in addition to priority control with the EDCA at the MAC layer is effective in achieving excellent application–level QoS of audio–video transmission. Furthermore, we assess user–level QoS by the method of successive categories, which is one of the psychometric methods.
I. INTRODUCTION Many wireless LAN products conformable to the IEEE 802.11 standard have been commercially available and widely used for indoor high–speed wireless data access. The legacy IEEE 802.11 standard MAC protocol supports two kinds of access methods: DCF (Distributed Coordination Function) and PCF (Point Coordination Function) [1]. The DCF is designed for asynchronous data transmission by using CSMA/CA (Carrier Sense Multiple Access with Collision Avoidance). The PCF is based on polling controlled by an AP (Access Point). These access methods are not sufficient to support multimedia transmission. To meet the demands for efficient multimedia transmission in wireless LANs, the IEEE 802.11 Task Group E is working to enhance the 802.11 MAC to expand support for applications with QoS (Quality of Service) requirements [2]. The IEEE 802.11e MAC supports HCF (Hybrid Coordination Function), which has two access methods: EDCA (Enhanced Distributed Channel Access) and HCCA (HCF controlled channel access) [2]. The former is an enhanced version of the DCF and can support relative priority services for multimedia transmission. The latter is an improved polling scheme based on the PCF. In this paper, we focus on a BSS (Basic Service Set), which includes an AP and stations associated with the AP, of an infrastructure wireless LAN and study the performance of the EDCA. The performance of the EDCA has already been studied by many researchers [2]–[12]. References [2] through [4] evaluate the performance of the EDCF (Enhanced DCF)1 by simula-
tion considering diverse types of traffic such as voice, video, and data. In [5], the EDCF is investigated through simulation in the case where two QBSSs (Quality of Service BSS) are geographically overlapped and share a common radio channel. In each of [6] and [7], theoretical analysis of the EDCF is carried out by the technique of Markov analysis. Admission control algorithms to support QoS requirement in IEEE 802.11e wireless LANs are studied in [8] and [9]. In [10], Hui and Devetsikiotis propose a distributed MAC WRR (Weighted Round Robin) scheduler and compare the performance of the MAC WRR scheduler and a network layer WRR scheduler. In [11], four access schemes including the EDCF, the PCF, Distributed Fair Scheduling, and Blackburst are evaluated to study which scheme is the most efficient to support QoS over the IEEE 802.11 wireless LANs. An adaptive service differentiation scheme called AEDCF (Adaptive Enhanced Distributed Coordination Function) is proposed in [12] for QoS enhancement over IEEE 802.11 wireless LANs. The papers mentioned above focus mainly on MAC–level QoS. We cannot find any study on application–level and user– level QoS over the IEEE 802.11e EDCA wireless LANs. In multimedia applications, however, these two kinds of QoS should be examined since the ultimate goal of a multimedia service is to provide high user–level (perceptual) QoS for end– users, and application–level QoS is closely related to it [13]. This paper studies application–level and user–level QoS of audio–video transmission in a wireless LAN with the EDCA of the IEEE 802.11e MAC protocol. Continuous media synchronization control and dynamic video resolution control at the application layer is effective in improving these levels of QoS for audio–video transmission [14]–[16]. The continuous media synchronization control is carried out to preserve temporal relationships between MUs (Media Units), each of which is the information unit of media synchronization such as video frame. This control compensates network delay jitters of MUs by buffering them at the destination. The dynamic video resolution control is one of the congestion control schemes. This control can adjust video traffic to the network state by dynamically changing temporal or spatial reso1
An enhanced access method of the DCF had been referred to as EDCF (Enhanced Distributed Coordination Function) until the IEEE 802.11e draft 4.0. However, in draft 5.0, this type of access method is called EDCA (Enhanced Distributed Channel Access).
lution of a video stream at the source. This paper first evaluates application–level QoS by simulation in the case where audio and video streams are transferred with the EDCA of the IEEE 802.11e MAC. We compare the application–level QoS for the EDCA with that for the DCF through simulation and investigate the effectiveness of the priority control at the MAC–level provided by the EDCA. In the simulation we assume the IEEE 802.11b physical layer at a channel rate of 11 Mbps [17]. We then study how dynamic video–resolution and media synchronization control can improve the application–level QoS in the EDCA and the DCF. In this study a temporal resolution control scheme is adopted, and the VTR (Virtual Time Rendering) algorithm is used for media synchronization control [14]–[16]. Furthermore, we assess user–level QoS by a subjective experiment and examine which application–level QoS parameters affect the user–level QoS. Since user–level QoS is directly related to human perception, we utilize a psychometric method referred to as the method of successive categories [18]. The rest of the paper is organized as follows. Section II describes the legacy IEEE 802.11 DCF and the IEEE 802.11e EDCA. Section III explains the media synchronization control and the dynamic resolution control schemes. Section IV specifies simulation conditions, and Section V gives numerical results from simulation and discusses the application–level QoS. Section VI investigates user–level QoS on the basis of subjective experimental results. Section VII gives a conclusion of this paper. II. DCF and EDCA In this section we briefly describe the transmission procedure for a data frame with the IEEE 802.11 DCF and that with the IEEE 802.11e EDCA. In this section, a data frame means an MPDU (Mac Protocol Data Unit). The IEEE 802.11 DCF is based on CSMA/CA with binary exponential backoff. In the DCF, when a wireless station generates a data frame in its source buffer, it senses the state of the channel to judge whether another station is transmitting any frame or not. If the medium is judged to be idle for at least DIFS (Distributed InterFrame Space), the station can transmit the data frame. If the destination station receives the data frame correctly, it sends an acknowledgment frame (ACK) back to the source station after an SIFS (Short InterFrame Space) period. When the medium is judged to be busy, the station waits until the channel becomes idle for a DIFS, and then it selects a random backoff period. The station decreases its backoff timer after it judges the channel to be idle for a DIFS period. When the backoff timer becomes 0, the station begins to transmit the data frame. The backoff period is a multiple of the slot–time duration and is selected uniformly in the range of 0 through CW (Contention Window) slot–times. The initial value of CW is CW min; then, for the n–th retransmission, CW is set to n 2 (CWmin+1)-1. When CW becomes a predetermined maximum value CWmax, it remains at CWmax. In the DCF, each station has one source buffer, and all sta-
(AIFS[AC]≧DIFS) AIFS[AC]
AIFS[AC] Contention window
Busy medium
Defer access
Back off
Next frame
Slot time
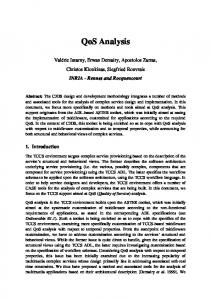
Fig. 1. IEEE 802.11e EDCA channel access.
tions send data frames using the same values of CWmin, CWmax, and DIFS; therefore, the DCF cannot support priority control for multimedia transmission. On the other hand, the IEEE 802.11e EDCA introduces ACs (access categories) to support differentiated channel access for applications with QoS requirements. In the EDCA, eight priority levels according to the 802.1D bridge specification are mapped into four ACs [2]. A station which supports the EDCA has an individual source buffer for each of the four ACs, and the channel access function based on the CSMA/CA is independently carried out per AC. In the EDCA, a station uses AIFS (Arbitration Inter Frame Space) instead of DIFS for the contention process as shown in Fig. 1. In this figure, the duration of AIFS[AC], which means AIFS for a particular AC, is determined by the following equation: AIFS[AC] = SIFS + AIFSN [AC]*aSlotTime (1) where AIFSN[AC] is an integer which is equal to or greater than 2; that is, AIFS[AC] is greater than or equal to DIFS. In addition, the values of CWmin[AC] and CWmax[AC] are selected per AC. The EDCA can support service differentiation by setting different values of AIFS[AC], CWmin[AC], and CWmax[AC] according to ACs; that is, as these values are smaller, the priority of the AC is higher. III. MEDIA SYNCHRONIZATION AND DYNAMIC RESOLUTION CONTROL
We consider the transmission of voice (audio) and video streams. In this section, we describe the media synchronization and the dynamic resolution control used in this study. The two types of control are carried out at the application layer. A. Media Synchronization Control The media synchronization is classified into intra–stream synchronization and inter–stream synchronization. The intra– stream synchronization controls the output time of MUs at the destination to preserve temporal relationships between MUs of a single voice or video stream. The inter–stream synchronization is to synchronize between a voice MU and the corresponding video MU. In this paper, we adopt the VTR algorithm for the media synchronization. The voice stream is selected as the master media, and the video stream as the slave one since voice is more sensitive to delay jitter than video. In this algorithm, each media source attaches a timestamp to each MU to indicate its generation time. The destination buff-
TABLE I SPECIFICATIONS OF THE VOICE AND VIDEO
Multimedia station
item
voice ITU–T G.711 µ–law –
coding scheme
AP
image size [pixels]
Audio and video
I
original average MU size [bytes]
1000
5000
original average MU rate [MU/s]
8
In this paper, we use an MPEG1 video stream in the simulation and adopt a temporal dynamic resolution control scheme for transmission of the video stream. Each video source generates video MUs at a rate of 20 MU/s. A video MU corresponds to a video frame, and all video frames are encoded into I (Intra) frames. In the following we describe the dynamic resolution control used in the simulation. The video destination calculates the video MU receiving rate for every Tint seconds and sends the calculated value back to the video source. The video MU receiving rate is defined as the ratio of the number of video MUs received successfully at the destination to the number of video MUs delivered from the source. In the simulation we assume that each video source station chooses temporal resolution of the video stream from among 20, 10, and 5 MU/s according to the video MU receiving rate. Each video source initially transmits at 20 MU/s, and it decreases the resolution by one step if the video MU receiving rate becomes less than a threshold value Tlow . When this rate
10
5
125
50 100 200
original average bit rate [kbps]
64
800 400 200
measurement time [s]
20
TABLE II PARAMETERS OF THE EDCA
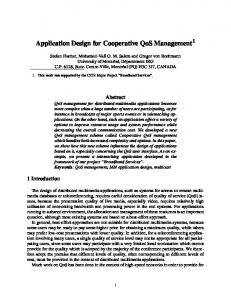
Fig. 2. System Configuration.
B. Dynamic Resolution Control
20
original average inter-MU time [ms]
Data
ers each received MU for a time to compensate for delay jitter and then outputs the MU. The output time when an MU should be output is called the target output time of the MU. The target output time of the first MU of a media stream is determined by the arrival time of the MU and the initial buffering time Jmax, which is an estimated value of the maximum network delay jitter. In this algorithm, the destination can dynamically modify the target output time of the subsequent MUs according to network conditions. If an MU arrives at the destination a predetermined time later than the target output time, the destination can postpone the target output time. This modification of the target output time can be triggered only by the master (voice) stream. Furthermore, the destination skipps an MU when the next MU has already arrived. Inter-stream synchronization control is performed only for the slave media after intra–stream synchronization control. The output time of each video MU is controlled to synchronize with the corresponding voice MU. The reader is referred to [14] for further details.
320*240
–
picture pattern
Data station
video MPEG1
media voice video data
AC 3 2 0
AIFSN AIFS[µs] 2 50 2 50 3 70
CWmin 7 15 31
CWmax 15 31 1023
becomes higher than another threshold value Thigh, the video source increases the resolution by one step. IV. SIMULATION CONDITIONS This paper first evaluates the application–level QoS of audio–video transmission between the AP and wireless stations by simulation with ns-2 (network simulator version 2) [19]. Figure 2 illustrates the system configuration used in simulation of this study. In this paper we focus on a single BSS shown in this figure, which includes an AP, four multimedia stations, and five data stations. The AP transmits a pair of voice (audio) and video streams to each of the four multimedia stations. The voice and video are transmitted as separate streams by using UDP/IP. Table I shows the specifications of the voice and video in the simulation. We use a voice stream of ITU-T G.711 µ–law and an MPEG1 video stream, which has been prepared by encoding a music–scene video clip. A video MU is transferred by one or more UDP datagrams. We assume that the maximum size of a UDP datagram is 1472 bytes in its payload including a 16–byte header for media synchronization. The five data stations generate fixed–size UDP datagrams of 1472 bytes in its payload at exponentially distributed intervals and send them to the AP for interference traffic. The header size of a UDP datagram and that of an IP datagram are assumed to be 8 bytes and 20 bytes, respectively. In the dynamic resolution control, we set Tint=3 s, Thigh=96 %, and Tlow=92 % on the basis of preliminary simulation results. We also set the initial buffering time for the media synchronization Jmax to 200 ms. Table II shows parameter values of the EDCA used in the simulation. The value of AC for transmission of MPDUs which contain the information on the MU receiving rate for the dynamic resolution control is set to be 2. In the case of the DCF, we set CWmin=31 and CWmax=1023. We also use system param-
9
Average MU rate for voice [MU/s]
eter values specified in the IEEE 802.11b standard for the DSSS physical layer at the channel rate of 11 Mbps; that is, the duration of a slot is equal to 20 µs, DIFS=50 µs and SIFS=10 µs [17]. In addition, we assume that the maximum allowable number of retransmissions of an MPDU is 7. We also assume that each source buffer at the MAC layer in a station or the AP can accommodate a maximum of 50 MPDUs and that an MPDU is discarded if the station or the AP generates a new MPDU and if its buffer does not have space to accommodate the MPDU. Furthermore, in this study the RTS(Request To Send)/CTS(Clear To Send) frames are not exchanged before transmission of an MPDU, and only one MPDU is transmitted per TXOP (Transmission Opportunity) in the EDCA.
8 7 6 5 4 3 2 1
DCF(NC)
DCF(RC)
DCF(VTR)
DCF(RC+VTR)
EDCA(NC)
EDCA(RC)
EDCA(VTR)
EDCA(RC+VTR)
0 0
100
200
V. NUMERICAL RESULTS
A. Application–level QoS Parameter In this paper, we adopt the average MU rate, average MU delay, MU loss rate, and average datagram delay as application–level QoS parameters to evaluate the efficiency of information transfer. The average MU rate is the average number of MUs output per second. The average MU delay is the average time from the moment an MU is generated at the source station until the moment the MU is output at the destination. The MU loss rate indicates the ratio of the number of MUs lost to the number of MUs transferred from the source. The average datagram delay is the average time from the moment a UDP datagram is generated at a data station until the moment the datagram arrives at the application layer of its destination. In addition, we also adopt mean square error to measure the synchronization quality. The mean square error of intra–stream synchronization is the average square of the difference between the output time of each MU and its target output time. The mean square error of inter–stream synchronization is the average square of difference between the output time of each slave (video) MU and its derived output time obtained from the output time of the corresponding master (voice) MU. The derived output time means the output time of the corresponding voice MU plus the difference between the timestamps of the two MUs. As the values of these parameter decrease, the quality of synchronization becomes better. B. Comparison of EDCA and DCF We first discuss the effects of the MAC–level priority control with the EDCA on the application–level QoS. Figures 3
400 500 600 Average load [kbps]
700
800
900
1000
800
900
1000
Fig. 3. Average MU rate for voice. 500
Average MU delay for voice [ms]
In this section we present simulation results of the application–level QoS of audio–video transmission with the EDCA and that with the DCF. In the numerical results, we show four cases: NC (No Control), VTR, RC (Resolution Control), and VTR+RC for each of the EDCA and the DCF. NC means that neither dynamic resolution control nor media synchronization control is carried out. VTR and RC mean the exertion of the VTR media synchronization control and that of dynamic resolution control, respectively. VTR+RC implies that both types of control are exerted.
300
450 400 350
DCF(NC)
DCF(RC)
DCF(VTR)
DCF(RC+VTR)
EDCA(NC)
EDCA(RC)
EDCA(VTR)
EDCA(RC+VTR)
300 250 200 150 100 50 0 0
100
200
300
400 500 600 Average load [kbps]
700
Fig. 4. Average MU delay for voice.
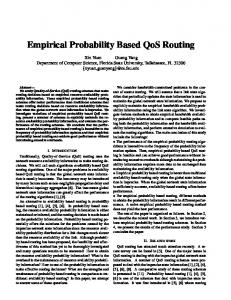
and 4 show the average MU rate and the average MU delay, respectively, for voice as a function of the average load. The average load means the average data load generated by a data station. In Figs. 5 and 6 we plot the average MU rate and the average MU delay, respectively, for video. Figure 7 reveals the average datagram delay. First, we compare the voice quality of the EDCA and that of the DCF, using Fig. 3. From this figure, we observe that the average MU rate for the EDCA is about 8 MU/s for all the values of the average load to be shown. In the EDCA, wireless stations have enough chances to send voice MUs even if the data traffic load is heavy because voice transmission is given higher priority than video and data transmission. On the other hand, in the case of the DCF, the average MU rate for voice becomes smaller if the average load is heavier than 500 kbps. In the DCF all kinds of MPDUs are transmitted according to the order in which they are generated by the station. Therefore, the voice quality is highly influenced by the data load. We can see in Fig. 4 that the EDCA also performs better than the DCF regarding the voice quality on heavy traffic conditions. Note that in Fig. 4 the average MU delay with the media synchronization control becomes about 200 ms even at light traffic because of the buffering time at the destination. We next discuss the video quality, referring to Figs. 5 and 6.
400
20 Average datagram delay [ms]
Average MU rate for video [MU/s]
25
15
10 DCF(NC) DCF(VTR) EDCA(NC) EDCA(VTR)
5
DCF(RC) DCF(RC+VTR) EDCA(RC) EDCA(RC+VTR)
100
200
300
400 500 600 Average load [kbps]
700
DCF(NC)
DCF(RC)
300
DCF(VTR)
DCF(RC+VTR)
EDCA(NC)
EDCA(RC)
EDCA(VTR)
EDCA(RC+VTR)
250 200 150 100 50 0 100
0 0
350
800
900
1000
200
400
500 600 700 Average load [kbps]
800
900
1000
Fig. 7. Average datagram delay.
Fig. 5. Average MU rate for video. 100
500
90
450
DCF(NC) DCF(VTR) EDCA(NC) EDCA(VTR)
400 350
DCF(RC) DCF(RC+VTR) EDCA(RC) EDCA(RC+VTR)
MU loss rate for video [%]
Average MU delay for video [ms]
300
300 250 200 150
80 70
DCF(NC)
DCF(RC)
DCF(VTR) EDCA(NC) EDCA (VTR)
DCF(RC+VTR) EDCA(RC) EDCA(RC+VTR)
60 50 40 30
100
20
50
10 0
0 0
100
200
300
400 500 600 Average load [kbps]
700
800
900
1000
0
100
200
300
400 500 600 Average load [kbps]
700
800
900
1000
Fig. 6. Average MU delay for video.
Fig. 8. MU loss rate for video.
These figures show that the video quality for both DCF and EDCA deteriorates if the average load increases beyond 500 kbps. However, the video quality for the EDCA becomes almost constant when the average load is equal to or larger than 800 kbps since video transmission is given higher priority than data transmission. On the other hand, Fig. 7 shows that the average datagram delay for the EDCA becomes much larger than that for the DCF if the average load is heavier than 700 kbps. In the EDCA, data stations have few chances to send data MPDUs under the heavy traffic conditions because of the lowest priority. From the above observations, we can say that the priority control at the MAC layer with the EDCA can improve the voice and video quality of the DCF when the data load is heavy.
quality is improved. The authors have confirmed that almost all MU losses are caused by buffer overflow at the MAC layer. Furthermore, we can find from Figs. 3, 4, 5, 6, and 8 that in the case of the DCF, the voice quality as well as the video quality is improved if the dynamic resolution control is performed.
C. The Effects of Dynamic Resolution Control We next discuss the effects of the dynamic resolution control. Figure 8 shows the MU loss rate for video as a function of the average load. From this figure, we can find that for the EDCA the values of the MU loss rate under the heavy traffic conditions can be improved by utilizing the dynamic resolution control. We can also find this result from Fig. 5. Since the dynamic resolution control can reduce the traffic load of video, this control leads to smaller rates of video MU loss; therefore, the video
D. Quality of Media Synchronization We then discuss how the media synchronization control affects the application-level QoS parameters. Figure 9 plots the mean square error of intra–stream synchronization for voice as a function of the average load. In this figure, the mean square errors for the EDCA(VTR) and EDCA(RC+VTR) become less than 0.01 when the average load is less than 1000 kbps. We can find in Fig. 9 that the values of mean square error for the EDCA become much smaller than those for the corresponding DCF. This figure also indicates that the effect of the average load on the quality of voice for the EDCA is small. On the other hand, the mean square error of intra–stream synchronization for the DCF becomes larger as the average load increases. However, this figure also shows that the mean square error for the DCF can improve by the media synchronization and the dynamic resolution control. In Fig. 10, we plot the mean square error of inter–stream synchronization. This figure shows that the mean square error
mean square error of intra–stream synchronization for voice [ms 2]
10000
DCF(NC) DCF(VTR) EDCA(NC) EDCA(VTR)
1000
DCF(RC) DCF(RC+VTR) EDCA(RC) EDCA(RC+VTR)
very slightly annoying annoying annoying 0.000
100
2.376
3.569
Fig. 11. Boundary of each category.
10 1 0
100
200
300
400
500
600
700
800
900
1000
0.1 6.0
0.01
DCF(NC)
DCF(RC)
DCF(VTR)
DCF(RC+VTR)
EDCA(NC)
EDCA(RC)
EDCA(VTR)
EDCA(RC+VTR)
5.0
Psychological scale
Average load [kbps]
Fig. 9. Mean squre error of intra-stream syncronization for voice
100000
mean square error of inter–stream synchronization [ms2]
1.189
perceptible but not annoying imperceptible
DCF(NC)
DCF(RC)
DCF(VTR)
DCF(RC+VTR)
EDCA(NC)
EDCA(RC)
EDCA(VTR)
EDCA(RC+VTR)
4.0 3.0 2.0 1.0 0.0 500
10000 1000
600 700 Average load [kbps]
800
Fig. 12. Estimate of the psychological scale.
100
A. Assessment Method
10 1
0
100
200
300
400
500
600
700
800
900
1000
0.1 0.01 0.001 Average load [kbps]
Fig. 10. Mean squre error of inter-stream syncronization
of inter–stream synchronization for the EDCA(NC) is larger than that for the DCF(NC) when the average load is larger than 500 kbps. In the EDCA, the voice transmission is given higher priority over the video and data transmission. Therefore, the difference in the output time between a voice MU and the corresponding video MU increases as the traffic load becomes heavier because many video MUs arrive at the destination much later than the corresponding voice MUs. However, we notice in Fig. 10 that the mean square error of inter–stream synchronization for the EDCA becomes much smaller if the media synchronization and dynamic resolution control are exerted together. From the above observations, we can say that high application–level QoS can be achieved with the EDCA carrying out the dynamic resolution and media synchronization control. VI. USER–LEVEL QOS ASSESSMENT In this section, we assess user-level QoS for audio–video transmission with the EDCA and the DCF by a subjective experiment; we utilize a psychometric method referred to as the method of successive categories.
The subjective assessment was conducted as follows. We first made test samples for subjective assessment by actually outputting the voice and video MUs with the output timing obtained from the output timing of each MUs from simulation. The number of assessors is 20, and their ages are 20s. We adopted a five-grade impairment scale; that is, each assessor was shown the test samples and was asked to classify a test sample into the following five categories with their scores: “imperceptible” assigned integer 5, “perceptible but not annoying” 4, “slightly annoying” 3, “annoying” 2, and “very annoying” 1. For each test sample, we calculated the mean opinion score (MOS) from all scores obtained from the subjective assessment. However, MOS is an ordinal scale; the integers assigned to the categories only have a greater–than–less–than relation between them. Therefore, we then transformed the ordinal scale into the interval scale by the law of categorical judgement [18]. In the interval scale, an interval between the scale values means a distance between amounts of the sensory attribute measured. Thus, we utilize the psychological scale as the user-level QoS parameter. B. Assessment Results Figure 11 displays the boundary of each category calculated by the law of categorical judgement. In this figure, the upper boundary of category 1 is regarded as the origin. We can observe in this figure that the width of each category is not uniform in the strict sense. Figure 12 depicts the psychological scale versus the average load. In this figure, we have selected the minimum value of the psychological scale as the origin of the ordinate. From this
figure we find that the values of the psychological scale for DCF (NC) and DCF (RC) are much smaller than the other cases for all the values of the average load. This is because delay jitters for voice MUs become larger; note that the mean square errors for these cases also become larger in Fig. 9. We then notice in Fig. 12 that the values of the psychological scale for DCF (RC+VTR), EDCA (RC) and EDCA (RC+VTR) are larger than those for DCF (VTR), EDCA (NC), and EDCA (VTR) when the average load is 800kbps. This result depends on the MU loss rate for video. In Fig. 8 we notice that the values of the MU loss rate for the former three cases are smaller than those for the latter three cases. Thus, we can say that the dynamic resolution control improves the user-level QoS as well as the application-level QoS for the EDCA and the DCF. Furthermore, Fig. 12 shows that the values of the psychological scale for the EDCA does not depend on the media synchronization control. In this study, we selected a music–scene video clip. In this case, the media synchronization control does not seem to be important for the user-level QoS. We need to examine the effects of the difference in scene on the user-level QoS by using other video contents. VII. CONCLUSIONS This paper studied the application–level QoS of audio–video transmission in a wireless LAN with the EDCA of the IEEE 802.11e MAC protocol through simulation. In addition, user– level QoS was assessed. First, we compared the performance of the EDCA and the DCF. Numerical results showed that the EDCA can improve the application–level QoS for audio of the DCF by giving higher priority to audio transmission over video and data transmission. We then examined how the dynamic resolution control of video affects the video quality and found that the video quality for the EDCA and that for the DCF can be improved by the control on heavy traffic conditions. We also discussed the effects of the media synchronization control. Simulation results showed that the priority control by the EDCA degrades the inter–stream synchronization quality. However, we also found that the inter–stream synchronization quality for the EDCA can be improved with the media synchronization control. From the above results, we can conclude that the dynamic resolution and media synchronization control along with priority control by the EDCA at the MAC layer is effective in achieving excellent application–level QoS of audio–video transmission in an IEEE 802.11 wireless LAN. Furthermore, we investigated the user–level QoS. As a results, we found that the user–level QoS for the EDCA can be improved by using the dynamic resolution control. Our future work includes investigation of the application– level QoS for multimedia transmission with the HCCA and assessment of the user–level QoS for other kinds of video contents.
ACKNOWLEDGMENT The authors thank Mr. Hirotsugu Okura of SANYO Electric Co., Ltd. for his valuable discussions. They are also grateful to Dr. Yoshihiro Ito of Nagoya Institute of Technology for his advice on methods for user–level QoS assessment. REFERENCES [1] IEEE 802.11 WG, ‘‘Part 11:wireless LAN medium access control (MAC) and physical layer (PHY) specifications,’’ IEEE802.11 Std., Sep. 1999. [2] S. Mangold, S. Choi, G. Hiertz, O. Klein, and B. Walke, ‘‘Analysis of IEEE 802.11e for QoS support in wireless LANs,’’ IEEE Wireless Comm., vol. 10, no. 6, pp.40-50, Dec. 2003. [3] S. Choi, J. del Prado, S. Shankar N, and S. Mangold, ‘‘IEEE 802.11e contention–based channel access (EDCF) performance evaluation,’’ in Conf. Rec. IEEE GLOBECOM’2003, May 2003. [4] A. Grilo and M. Nunes, ‘‘Performance evaluation of IEEE 802.11e,’’ in Proc. PIMRC’2002, Sept. 2002. [5] S. Mangold, S. Choi, P. May, and G. Hiertz, ‘‘IEEE 802.11e – fair resource sharing between overlapping basic service sets,’’ in Proc. PIMRC’2002, Sept. 2002. [6] J. Zhao, Z. Guo, Q. Zhang, and W. Zhu, ‘‘Performance study of MAC for service differentiation in IEEE 802.11,’’ in Conf. Rec. IEEE ICC2003, May 2003. [7] K. Xu, Q. Wang, and H. Hassanein, ‘‘Performance analysis of differentiated QoS supported by IEEE 802.11e enhanced distributed coordination function (EDCF) in WLAN,’’ in Conf. Rec. IEEE GLOBECOM’2003, Dec. 2003. [8] Y. Kuo, C. Lu, E. H. Wu, and G. Chen, ‘‘An admission control strategy for differentiated services in IEEE 802.11,’’ in Conf. Rec. IEEE GLOBECOM’2003, Dec. 2003. [9] D. Pong and T. Moors, ‘‘Call admission control for IEEE 802.11 contention access mechanism,’’ in Conf. Rec. IEEE GLOBECOM’2003, Dec. 2003. [10] J. Hui and M. Devetsikiotis, ‘‘Designing improved MAC packet schedulers for 802.11e WLAN,’’ in Conf. Rec. IEEE GLOBECOM’2003, Dec. 2003. [11] A. Lindgren, A. Almquist, and O. Schelen, ‘‘Quality of service schemes for IEEE 802.11 wireless LANs – an evaluation,’’ Mobile Networks and Applications, vol. 8, no. 3, pp.223-235, Aug. 2003. [12] L. Romdhani, Q. Ni, and T. Turletti, ‘‘Adaptive EDCF: enhanced service differentiation for IEEE 802.11 wireless ad-hoc networks,’’ in Proc. IEEE WCNC’2003, Mar. 2003. [13] S. Tasaka and Y. Ishibashi, ‘‘Mutually compensatory property of multimedia QoS,’’ in Conf. Rec. IEEE ICC2002, Apr./May 2002. [14] Y. Ishibashi and S. Tasaka, ‘‘A synchronization mechanism for continuous media in multimedia communications,’’ in Proc. IEEE INFORCOM’95, Apr. 1995. [15] F. Kaladji, Y. Ishibashi, and S. Tasaka, ‘‘Performance evaluation of a dynamic resolution control scheme for video traffic in media–synchronized multimedia communications,’’ IEICE Trans, Commun., vol.E-81B, no.3, pp.565-574, Mar. 1998. [16] Y. Ishibashi and S. Tasaka, ‘‘A media synchronization mechanism for live media and its measured performance,’’ IEICE Trans, Commun., vol.E81B, no.10, pp.1840-1849, Oct. 1998. [17] IEEE 802.11 WG, ‘‘Supplement to part 11:wireless LAN medium access control (MAC) and physical layer (PHY) specifications: higher–speed physical layer extention in the 2.4 GHz band,’’ IEEE 802.11 Std., 1999. [18] S. Tasaka and Y. Ito, ‘‘Psychometric analysis of the mutually compensatory property of multimedia QoS,’’ in Conf. Rec. IEEE ICC2003, May 2003. [19] The network simulator – ns-2 –, (http://www.isi.edu/nsnam/ns/).