Bioscience of Microbiota, Food and Health Vol. 33 (2), 65–78, 2014
Full Paper
Applying Data Mining to Classify Age by Intestinal Microbiota in 92 Healthy Men Using a Combination of Several Restriction Enzymes for T-RFLP Experiments Toshio KOBAYASHI1,2*, Takako OSAKI3 and Shinya OIKAWA1 1Miyagi
University, 2–2–1 Hatadate, Taihaku-ku, Sendai City, Miyagi 982-0215, Japan 2–1 Hirosawa, Wako, Saitama 351-0198, Japan 3Kyorin University, School of Medicine, 6–20–2 Shinkawa Mitaka, Tokyo 181-8611, Japan 2RIKEN,
Received May 8, 2013; Accepted November 17, 2013
The composition of the intestinal microbiota was measured following consumption of identical meals for 3 days in 92 Japanese men, and terminal restriction fragment length polymorphism (T-RFLP) was used to analyze their feces. The obtained operational taxonomic units (OTUs) and the subjects’ ages were classified by using Data mining (DM) software that compared these data with continuous data and for 5 partitions for age divided at 5 years intervals between the ages of 30 and 50. The DM provided Decision trees in which the selected OTUs were closely related to the ages of the subjects. DM was also used to compare the OTUs from the T-RFLP data with seven restriction enzymes (two enzymes of 516f-BslI and 516f-HaeIII, two enzymes of 27f-MspI and 27f-AluI, three enzymes of 35f-HhaI, 35f-MspI and 35f-AluI) and their various combinations. The OTUs delivered from the five enzyme-digested partitions were analyzed to classify their age clusters. For use in future DM processing, we discussed the enzymes that were effective for accurate classification. We selected two OTUs (HA624 and HA995) that were useful for classifying the subject’s ages. Depending on the 16S rRNA sequences of the OTUs, Ruminicoccus obeum clones 1-4 were present in 18 of 36 bacterial candidates in the older age group-related OTU (HA624). On the other hand, Ruminicoccus obeum clones 1-33 were present in 65 of 269 candidates in the younger age group-related OUT (HA995). Key words: human intestinal microbiota, operational taxonomic unit, classification of age, data mining analysis, decision tree, terminal restriction fragment length polymorphism, Ruminicoccus obeum INTRODUCTION
The human intestinal microbiota (HIM) is closely related to our health, and its relationship with the human immune system and diseases is now being widely researched to obtain useful information. One of the barriers to further progress was thought to be the ability to quantitatively analyze HIM data, such as terminal restriction fragment length polymorphism (T-RFLP) data from feces, which are presented as operational taxonomic units (OTUs). Bicluster analysis, principal component analysis, and analysis with correlation coefficients have been applied to OTU data, but the results have not been clear, and it has been difficult to convince the community of the merits of this approach. Kobayashi successfully introduced the application of Data mining (DM) to classification of the relationships between characteristics and OTUs, and the results were reported in a series of Corresponding author. Toshio Kobayashi, Miyagi University, 2–2–1 Hatadate, Taihaku-ku, Sendai City, Miyagi 982-0215, Japan. Fax: +81-3-717-7398. E-mail:
[email protected]
papers [1–3]. Another barrier to understanding the detailed relationship between the components of the HIM is the effect of the daily dietary habits of subjects; these usually vary between individuals. It is difficult to unify the dietary factors with many subjects, and the process requires much effort and cooperation. Another common barrier to clarifying the HIM is the need to gather T-RFLP data for many different restriction enzymes in order to compare them and select a suitable enzyme system for DM. Fortunately, our previous studies [1–3] and by Jin et al. [4] have provided T-RFLP data for the same subjects. This overcomes the barriers, and the data obtained with seven restriction enzymes were particularly valuable for further DM analysis. This paper focuses on the ages of the subjects in order to precisely clarify the hidden relationship of HIM with age. MATERIALS AND METHODS
As discussed previously [1–4], it is important to avoid the influence of dietary factors. Thus, we designed
66
T. Kobayashi, et al.
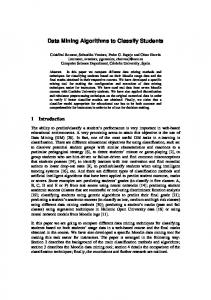
identical meals (1,879 kcal/day), which were fed for 3 days to 92 healthy male volunteers living in Japan. The ages of the subjects ranged from 21 to 59 years (average: 36.8), and their body mass indexes (BMI) ranged from 17.3 to 30.2 kg/m2 (average: 22.6). The cumulative frequencies for age in the 92 men are shown in Fig. 1. T–RFLP with seven restriction enzymes was used to analyze the fecal samples [2, 4]. The reasons for using T–RFLP analysis were its reproducibility, relatively low cost, and the convenience of using it with DM processing due to similar numbers of subjects and OTUs. Written informed consent was obtained from each participant prior to enrolment, and the study was performed in accordance with the protocol approved by the RIKEN Research Ethics Committee (Wakou 2009-3rd 21-13). The OTUs were accumulated by the Benno Laboratory, RIKEN, Japan. The procedure for extraction of DNA from feces has been described previously [2, 4], and the OTU data were analyzed in a similar manner [1–4]. Fluorescence intensity was used to measure the amount of each OTU. The OTU data was abbreviated as B--- (where--represents the base-pair number) for 516f-BslI, HA--- for 516f-HaeIII, M--- for 27f-MspI, A--- for 27f-AluI, QHh--- for 35f-HhaI, QM--- for 35f-MspI, and QA--- for 35f-AluI. We had two groups of OTUs: one was 516f- + 27f-, treated with four restriction enzymes, and the other was 35f-, treated with three restriction enzymes. The component numbers of these seven restriction enzymes were 271·B, 33·HA, 20·M, 40·A, 31·QHh, 34·QM, and 48·QA. When all enzyme components were combined for each group, the 516f- + 27f- group had a maximum of 120 OTUs and 35f- group had 113 OTUs. In order to balance the number of OTUs (120 or 113) with the number of subjects (92) and to avoid the problem of field alignment sequences (which were reported in our previous papers [2, 3]), we did not mix the data of the two OTU groups, i.e., 516f- + 27f- and 35f-. The data from T-RFLP with the various restriction enzymes were combined with the written answers to questions of the 92 subjects. The resulting two-dimensional Excel data sets were analyzed by DM software (Clementine14, IBMSPSS). Pearson correlation coefficients were obtained using other software (Statistics17.0, IBM-SPSS). Each OTU was matched with an accession number using a University of Idaho database [5]. The sequence of 16S rRNA was determined by the accession number derived from the National Center for Biotechnology Information (NCBI). The nearest bacterial species (≥97% identity) was identified by BLAST searches from an available genomic databank. Phylogenic tree was obtained using
Fig. 1. Cumulative frequency of the ages of the 92 Subjects Each dot represents a subject.
Mega#5 [6, 13] in comparison with these sequences. RESULTS
As a target characteristic for DM, we considered age in two different ways. The first way was to simply apply the ages of the subjects (continuance), and the second was to divide the ages into two nominal partitions (2-NP), in which a boundary age was used to divide subjects into two age regions. The reason why we did not use three or more nominal partitions was that we wanted better accuracy, and our experiences repeatedly was that larger numbers of partitions reduced accuracy. We applied a classification and regression tree (C&RT), which is the most common DM processing algorithm. It provides a Decision tree (Dt)2 that can be evaluated and can distinguish the effective OTUs for constructing a Dt. The C&RT optimizes the Gini coefficient3 to divide the subjects into two subsets according to the OTUs. The result is that subjects within each subsequent subset are more homogeneous than in the previous subset. The C&RT system is flexible and allows for the consideration of unequal misclassification costs, as compared to other DM processing algorithms. Major advantages are that C&RT is reproducible and delivers only a single selected OTU for each step of constructing the Dt. 1 There
are 27 OTUs in BslI between B106 and B990.
2 Decision tree is a decision-supporting pathway that makes use
of a tree-like graph, growing from left to right. Gini coefficient, g(t), is well known for the quantitative evaluation of the impurity of a group, and it is defined at a
3 The
node t in a C&RT, as categories of the target field.
, where i and j are
CLASSIFICATION OF AGE BY DATA MINING OF MICROBIOTA
67
Fig. 2. Dt obtained by DM with unpartitioned age Node-0: starting point of Dt construction. Node-1 to Node-14: subject groups divided by DM processing and classification. n: number of subjects. Average: average age at each node. σ: standard deviation of age at each node. Node-0 was divided into Node-1 and Node-2 by HA624 at 9.32 with the optimization of the Gini coefficient, and similar steps were repeated for constructing the Dt.
DM with unpartitioned age DM can be applied to a continuous target or one that has been divided into a few nominal partitions. The resulting Dts are similar but have notable differences. The former is more delicate and has a more finely divided structure than the latter. The first three steps of the Dt are shown in Fig. 2, which explicitly classifies the clusters of subjects ages, i.e., the nodes. The root node4 is the starting point of
the tree construction, and the Dt grows from left to right, dividing the subjects appropriately according to age. The details of the Dt and the pathway to reach the Terminal nodes5 clearly indicate the names and the quantities of the OTUs that are applied to divide the branches. The 4 The
root node: Node-0 is always alone at the left end of Dt. nodes: tree nodes that do not split or grow further.
5 Terminal
68
T. Kobayashi, et al.
default setting of the software results in five steps of the Dt; this can be changed, but we focused here only on the first three steps. This was because further steps had less effect on the age and were easily affected by the upstream OTUs. If we counted the numbers of nodes at the 3rd step of the Dt (Dt 3rd step, see Fig. 2), there were 8 nodes. But at the Dt 5th step, there were 20 nodes for the narrow age range of 1 to 3 years; these were more complex than was required for our present purpose. DM with 2 nominal partitions (2-NP) We considered various “boundary age” within the range of the subjects’ ages (21 to 59), and we chose five different options (at 5 year intervals) for dividing the 92 subjects into partitions, as shown in Table 1. The smallest group were not having less than 10 subjects, which was approximately 10% of the data. The Dt structure for 2-NP, partitioned at 40/41, is shown in Fig. 3, which shows the tree structure until Dt 5th step. One could easily understand the fundamental differences between this Dt and the one in Fig. 2, which used unpartitioned age for DM processing. Terminal nodes appeared earlier with nominal partitioning, as shown in Fig. 3, and the Dt structure became much more simple than that shown in Fig. 2. Pearson correlation coefficients To determine the correlation with age, we analyzed a total of six ways of partitioning the data: unpartitioned age and five partitions with different boundary ages, as shown in Table 1. To compare DM with another common statistical method for OTUs, we considered the results with Pearson correlation coefficients. For the 120 OTUs obtained with the 516f- + 27f- restriction enzymes, i.e., 27·B, 33·HA, 20·M and 40·A, the obtained results are shown in Table 2. As is well known, Pearson coefficients can be positive or negative, and the top 10 of both ends are shown here. In this table, some sets of OTUs are written in bold letters; these were the ones that appeared with the same partitions until the Dt 3rd step. Namely, two OTUs, HA995 and HA624 in the top row for “continuance” in Table 2, are also found in Fig. 2. Another five OTUs in Fig. 2, which were used to construct the Dt, i.e., A47, M216, M485, B124, and HA868, are not in the same row in Table 2. In other words, these five OTUs had correlation coefficients that were lower than those of the top 10 of both sides, and these are shown in the right-end column in Table 2. The number of the OTUs until the Dt 3rd step, i.e., 5, is shown in the top row. We also had a similar table of Pearson coefficients for the 113 OTUs obtained with the 35f- restriction enzymes system, but it
Table 1. Five different partitions for the 92 subjects by age
The 92 subjects were partitioned with 2-NP, at five different boundary ages in 5 year intervals between 30 and 50. N.: number, Av.: average, σ: standard deviation
was not included here to save space. Comparison between the various DM results and comparison of those with Pearson coefficients The various DM results are summarized in Table 3, which also shows Pearson coefficients for comparison. Regarding the restriction enzymes in Table 3, all were the same for 516f- + 27f- and 35f- and were compared between “continuance” and “2-NP”. DM with “continuance” did not estimate the age but simply delivered the average age at nodes, so “N. of falsely classified subjects” was not given. The Dt 1st step to the Dt 3rd step indicate how to compare the abbreviated Dt structures, such as those in Figs. 2 and 3. “False nodes-x” were indicated to show how false classification took place and to highlight the shapes of the detailed Dt structure. The bold letters in the Dt 1st step to the Dt 3rd step reveal that these OTUs had Pearson coefficients that were among top 10 that were positive or negative; these are also shown in Table 2. Similarly, Table 4 presents a comparison of the different combinations of restriction enzymes that could be applied for effective and accurate DM processing in the future. Age is one of the fundamental characteristics of life, and so it is important to know which restriction enzymes are the most effective for classifying the ages of subjects. The notation used in Table 4 is the same as that used in Table 3, and 2 rows, “Partition at DM” and “Age area”, are shown to make comparison with Table 3 easier.
CLASSIFICATION OF AGE BY DATA MINING OF MICROBIOTA
69
Fig. 3. Dt obtained by DM with 2-NP partitioned at 40/41 The 92 subjects were divided at Node-1 and Node-2 by HA323, with a Gini coefficient cutoff value of 2.86. The following divisions were made in an analogous way. The numbers of subjects at each node are shown. The arrow at Node-19 indicates that a subject was falsely classified; this was subject #21, who was 55 years of age. His OTUs corresponded to those of someone younger than 40. As for Terminal nodes, there are 11; there are four nodes for the younger group, which are shaded for the age range of 21-40, and there are 7 nodes for older group, which are not shaded for age range. Four of these nodes contain only one subject. Table 2. Pearson correlation coefficients for the 120 OTUs obtained with the 516f- + 27f- restriction enzymes
The top 10 positive and negative Pearson coefficients for 120 OTUs are shown. Bold letters indicate that the OTUs were used until the Dt 3rd step for the same group shown in Table 3, and the OTUs without bold letters have no relation with those in DM until the Dt 3rd step. The number of OTUs until the Dt 3rd step exist basically up to 7. The right-end column, “other than left term”, indicates the number of OTUs that did not appear in top 10 that were positive or negative. The missing number of OTUs, namely 1 in Fig. 3, is indicated by in this column, which is easily understand visually until up to the Dt 3rd step in Fig. 3. *: indicates that it was utilized twice.
Tracing the personal features of subjects DM provides a general classification of subjects, but it is also interesting to know how personal differences could be applied to determine age. We considered the subjects who were falsely classified by the DM processing. The
results are shown in Table 5. In the former figures and tables, the results with 35f- restriction enzymes were skipped because the number of false classifications was larger than in the 516f- + 27f- group. But here we saw that those results could be applied for determining the
70
T. Kobayashi, et al.
Table 3. Comparison of DM results and details of major related OTUs for continuance and five partitions by age
Restriction enzymes: primary restriction enzyme. “continuance”: DM processing with unpartitioned age. “N.”: number. “N. of falsely classified subjects”: number of subjects falsely classified until the Dt 5th step. A dash “-” at the Dt 2nd step and the Dt 3rd step indicate that a related OTU is missing because the Terminal node had already been reached. Bold letters at the Dt 1st step to the Dt 3rd step: of the 120 OTUs shown in Table 3, these OTUs produced Pearson coefficients that were in top 10 positive or negative values. “False node-x”: states information about false nodes, e.g., 2-(32) indicates that 2 subjects were falsely classified and that 32 were properly categorized. The sum of the numbers not in parentheses for all false nodes is equal to the “N. of falsely classified subjects”. The first number indicates the younger group, and the second number indicates the older group.
differences between individuals, as shown in the lower half of Table 5. The column “subject’s #” indicates the numbers assigned individually to each of the 92 subjects. DISCUSSION
DM with unpartitioned age In Fig. 2, we determined 7 out of the 120 OTUs that were closely related to age in the subjects between 21 and 59 years of age. These OTUs were HA624, HA995, A47, M216, M485, B124, and HA868. We carried out the same DM processing that we reported in a previous paper [2], and the results were the same. However, in Fig. 2, we presented the detailed structure of the Dt with cutoff values that divided the OTUs and the classified number of subjects at each node. At Node-9, 48 subjects, i.e., 52.2% of the 92 subjects, were notably different. The average age at Node-9 was 31.2, which meant that Node-9 consisted mostly of younger subjects. The pathway to reach Node-9, i.e., HA624, HA995, and M485, could also be used to classify younger subjects. The next node of major separation was Node-7 in Fig. 2, which had 19 subjects, 20.7% of the
92 subjects, and had an average age of 42.5. Node-7 was thought to represent middle age. Although not major nodes, Node-5 and Node-8 were notable. The former, Node-5, was located at the Dt 2nd step, and it represented older subjects. Node-8 had the youngest average age of all the nodes. The other younger subjects, e.g., those 21–26 year of age, that were not separated at Node-8 were seated at Node-9. There were 9 subjects who were 26 years old, which was the mode of the 92 subjects, but 2 of them were separated and belonged to Node-8. Most nodes between Node-7 and Node-14, except for Node8 and Node-9, represented older groups. Thus, we saw that aging provided a diversity of OTUs. The pathways to reach these nodes and their cutoff values were very different, and the reasons for this will be partly clarified later. DM with 2 nominal partitions (2-NP) For better and precise understanding of the OTUs related to age, we designed five partitions with 2-NP for the 92 subjects. This was because, as shown in Fig. 2, it was difficult to distinguish between ages and to clarify the progress of aging, using only a simple Dt structure
CLASSIFICATION OF AGE BY DATA MINING OF MICROBIOTA
71
Table 4. Further comparison of DM results and details of major related OTUs for different combinations of restriction enzymes with the same 2-NP and categories of age
In this table, all partition and age area are the same, for comparison with Table 3, but with different combinations of restriction enzymes. The same notation were used as in Table 3. *: Sequences of restriction enzymes, which were different from those used in Table 3; four restriction enzymes were used. 27B, 33HA, 20 M and40A.
like Fig. 2. Comparing Figs. 2 and 3, although the target characteristic was the same (age), one was unable to find the same OTU. HA323, which is present in Fig. 3 and most closely related to age partitioned at 40/41, is not present in Fig. 2. For a more universal understanding of the influence of the age, we compared DM processing with unpartitioned age (i.e., 21–59 years of age, see Fig. 2) with DM processing with partitioned age (e.g., divided at 40/41, see Fig. 3). No relation between these similar instances of DM was observed. As described above, the Dt with 2-NP provided a much simpler structure that had more terminal nodes at the second step and later, as shown in Fig. 3. Until the Dt 5th step, there were a total of 11 Terminal nodes. Four of these nodes were for the younger subjects, aged 21–40, namely, Node-7, Node-14, Node-17 and Node-19, as indicated by shading. On the other hand, there were 7 Terminal nodes for the older subjects, aged 41–59, one subject was seated in 4 nodes (if including Node-19, then 5 nodes). When these nodes were compared, the differences in the divided contents were very clear. Comparison of these two partitions along the DM pathway revealed convincingly
that aging provided the diversity of the OTUs. Comparison with Pearson correlation coefficients Not only Pearson coefficients, but also bicluster and principal component analysis have been used for HIM and OTU data [4, 7–9] to classify various characteristics of subjects, but no general conclusions have been made regarding any related peculiarities. These were individual and local case studies, and were not universal and applicable to other similar data. Here, we applied Pearson correlation coefficients as a representative of the existing types of analysis. Rather wide coverage was achieved with 20 OTUs selected out of 120 for the 516f- + 27f- restriction enzymes, but the bolded OTUs in Table 2, which appeared for both Pearson coefficients and DM, did not cover too much. This indicated that the methods were fundamentally different. DM was usually applied with many OTUs species that had smaller Pearson coefficients. This was due to the following two major differences between them. The first is that Pearson coefficients cover the data for all the OTUs of the 92 subjects including various noises, while DM focuses on a limited number
72
T. Kobayashi, et al.
Table 5. Detailed personal tracing of false subjects by DM (Table 3)
The subjects falsely classified by each DM processing were traced in order to understand the reasons for misclassification and to clarify the differences between in individual subjects. #: personal number for each subject between 1 to 92. “False nodes” state information about false nodes, as in Tables 3 and 4.
of subjects. This can be easily seen in the pathways in Figs. 2 and 3. For example, in Fig. 2, the 92 subjects were first divided by HA624, which had the highest positive Pearson coefficient, but the pathways divided by HA995 and A47 were focused on limited number of subjects, that is, HA995 was focused on 77 subjects and A47 was focused on 15 subjects. The DM processing was performed in a similar manner, with limited or partial optimization of the records, i.e., subjects, and applying fewer influences of noises. The second major differences between Pearson coefficients and DM were the detailed features of the OTU data. Figure 4 shows an example of the major OTUs
related to age. Four OTUs, i.e., B955, HA323, HA624 and M295, were selected from Tables 2 and 3. With these scatter diagrams, we were unable to determine a linear relationship between age and OTUs. This is necessary, however, to confirm the validity of Pearson coefficients. In contrast, DM does not require the relationship to be linear. Finally, the OTU data contained such technical problems; consequently, it was necessary to introduce a new method of analysis. Tracing the personal feature of subjects As shown in Table 5, we traced the few subjects who were repeatedly misclassified. Subject #21, aged 55, appeared 3 times in this table. In the lower half of Table 5, there were 5 subjects in the 36f- group who appeared twice: #23, #53, #62, #67 and #77. These 6 subjects were easily misclassified by the OTUs. The column for “False nodes” indicates that the forms of misclassifications that occurred at the cited nodes. For instance, “1-(44)” in the first row of Table 5 indicates that one younger subject (i.e., subject #45, aged 27) was misclassified and that 44 of the older subjects were correctly categorized. Similarly, “(50)-1” in the third row of Table 5 indicates that 50 subjects in the younger group contained one false subject, who was an older subject (i.e., #21, aged 55); this subject is shown in Fig. 3 at Node-19 with an arrow. According to the 2-NP for this DM processing, misclassification could occur in only the following two situations. Namely, an older subject was misclassified as belonging to a younger group, or a younger subject was misclassified as belonging to an older group. Of the 6 subjects who were falsely categorized by DM (as shown in Table 5), all who were misclassified more than 2 times were the former type, i.e., their OTUs seemed to be younger than their actual age; they were said to have a young intestine. Although some younger subjects were misclassified as older, this was an anomaly and was related to only certain OTUs. We noted that this meant increasing age leads to a wider diversity of OTUs, and so accurate classification of older subjects is more difficult than it is for younger ones. Comparison between the DM results Various DM results are comprehensively shown in Tables 3 and 4, with Table 3 showing DM results with the same restriction enzymes, i.e., 27B, 33HA, 20 M and 40A and 31QHh, 34QM and 48QA, and all OTUs of the 516f- + 27f- and 35f- groups. Table 4 shows the same “Age area” but different combinations of restriction enzymes. In Table 3, we can see how the OTUs change with age
CLASSIFICATION OF AGE BY DATA MINING OF MICROBIOTA
73
Fig. 4. Scatter diagram of major OTUs for age Data features for 4 major OTUs related to age, which are shown at the Dt 1st step in Table 3.
by examining the changes between the 5 partitions of age between 30 and 50. At the first step of the 516f- + 27f- group, A199, B955, HA323, M316 and M295 were clearly remarkable OTUs for these 5 partitions. Similarly, in the 35f- group, QHh574, QHh377 and QHh555 played the same role but were less definite than the former case. According to the functions of restriction enzymes, we needed to know if an OTU resulted in overlapping classification of bacteria, and this seemed apparent with QHh555. The changes in OTUs with age can be seen clearly in Table 3. Thus, if we had another similar set of OTU data for which the ages of the subjects were not known, we would be able to estimate their ages using the Dt structures in Table 3 in a so-called predictive analysis. A similar predictive analysis will be applied in the future for various diseases as a kind of easy and preliminary diagnosis. The main purpose of showing Table 4 was to demonstrate and compare the effects of suitable
combinations of restriction enzymes for further DM processing. Finally, as we already reported [2, 3], the 35fgroup was less effective than 516f- + 27f-. Also, 33HA, i.e., 516f-HaeIII, is the most effective restriction enzyme to apply in future DM to determine the ages of subjects; this is a little different from other characteristics, i.e., smoking and drinking habits, which were reported in our previous papers [2, 3]. We confirmed that the best choice of restriction enzymes depends on the property to be determined, e.g., age, smoking, or drinking habits. Determination of closely related bacterial species by BLAST search We compared our results for HA624 with those of Mitsuoka [6] in the left-hand column (516f- + 27f- groups) in Table 3. According to Fig. 2, HA624 clearly divided age at the Dt 1st step, and one can easily understand that the concentrated region of HA624 indicated the older group of subjects, i.e., Node-2 and its downstream. We
74
T. Kobayashi, et al.
traced this gene to determine its accession number. With Microbial Community Analysis III of the University of Idaho [5], simple tracing of HA624 produced 724 bacterial 16S rDNA gene sequences. Comparing HA624 with 3 other restriction enzymes (BslI, 27f-MspI, and 27f-AluI), a closely related OTU was found by DM processing. These OTUs might have been included in the same bacteria. The obtained lists from the University of Idaho were scanned and crosschecked for the same accession number, and 36 candidates were determined. However, all candidates of the OTUs were identified as uncultured bacteria, and 16S rRNA sequences of the candidates were searched by BLAST to find closely related bacterial species. All these bacteria were grampositive facultative anaerobes. After alignment analysis, a phylogram of an OTU (HA624) was obtained, which is shown in the Appendix Fig. A1 and abbreviated in the Appendix Table 1 to save space. We detected R. obeum, Ruminococcus sp. DJF VR66 and R. obeum clone 1-4 as closely related to 23 of 36 candidates by phylogenic analysis. Furthermore, R. obeum, Ruminococcus sp. DJF VR66, R. obeum clone 1-4, Lachnospiraceae, butyrateproducing bacterium, Ruminococcus sp. WAL 17306, Blautia sp., Clostridium symbiosum, Eubacterium contortum, Pseudobutyrivibrio ruminis, Butyrivibrio sp., Ruminococcus sp. and E. rectal were obtained with more than 97% identity. The primary structure of 16S rRNA is easier to determine than hybridization between DNA strands, and the strength of sequence analysis is that it can identify the level at which DNA pairing studies need to be performed, which certainly applies to similarities of 97% and higher [10]. For the younger group, the concentrated OTU was observed at Node-4 in Fig. 2, which was divided by HA995. With Microbial Community Analysis III of the University of Idaho [5], simple tracing of HA995 produced 4,551 bacterial 16S rDNA gene sequences. Comparing HA995 with 2 other restriction enzymes, i.e., BslI and 27f-AluI, a closely related OTU was found by DM processing. After similar processing was performed with 3 OTUs as in the case of HA624, 269 candidates with the same accession number were obtained. In the phylogram of an OTU (HA995) shown in Appendix Fig. A2 and in the Appendix Table 1, R. obeum clone 1-33 was detected as closely related to 65 of 265 candidates. Furthermore, B. wexlerae, Ruminococcus sp. K-1, Blautia luti, Ruminococcus sp. DJF VR70k1, Ruminococcus sp. DJF VR52, R. obeum, Clostridiales bacterium, Lachnospiraceae bacterium G41, Lachnospiraceae bacterium RM44, Firmicutes sp. oral clone CK051, Johnsonella sp. oral taxon, Lachnospiraceae bacterium
G11, Clostridium leptum and Dorea longicatena were found with more than 97% identity. We compared our results with Mitsuoka’s report of increasing rates with aging, such as in the case of C. perfringens, Lactobacillus, Enterobacteriaceae, and Streptococcus [6]. As shown in the Appendix Table 1, butyric acid-producing bacteria were found in the intestines of older subjects, and this was also observed in our study. This might be one of the mechanism of the aging process that leads to the OTU. Benno et al. [11] examined fecal microbiota of elderly persons in rural and urban areas of Japan, and reported that Ruminicoccus sp. was isolated from elderly persons in both areas. We could find the anaerobes easily by data-base analysis. Ruminicoccus sp. is one of the strict anaerobes requiring special methods for culture. We found R. obeum in two OTUs (HA624 and HA955), however, R. obeum clone 1-33 is classified to a different cluster than R. obeum clone 1-4 in the phylogenetic analysis of bacterial 16S rRNA gene sequences [12]. R. obeum clone 1-33 might be changed to clone 1-4 during aging. Further studies are needed to clarify this phenomenon. Acknowledgements All the data for this study were accumulated cooperatively with Jong-Sik Jin, Mutsumi Touyama, Ryoko Kibe, Yoshiki Tanaka, Yoshiko Benno, and Yoshimi Benno at RIKEN, and we appreciate their collaborative efforts. In addition, we are also grateful to Saburou Nakazawa, MD, PhD, and Kenji Fujiwara, MD, PhD, both of whom are former General Directors of the Japanese Society of Gastroenterology, for their excellent and forecasting trigger of these studies. Furthermore, we appreciate Tatsuo Shimamoto, MD, PhD, and Mr. Toshiaki Teramura, Arteriosclerosis Research Foundation, Japan, for their steady and long-term financial support of the DM processing. References 1. Kobayashi T, Fujiwara K. 2013. Identification of heavy smokers through their intestinal microbiota by data mining analysis. Biosci Microb Food Health 32: 77–80. [CrossRef] 2. Kobayashi T, Jin J, Kibe R, Toyama M, Tanaka Y, Benno Y, Fujiwara K, Shimakawa M, Maruo T, Toda T, Matsuda I, Tagami H, Matsumoto M, Seo G, Sato N, Chounan O, Benno Y. 2013. Identification of human intestinal microbiota of 92 men by data mining for 5 characteristics, i.e. age, BMI, smoking habit, cessation period of previous smokers and drinking habit. Biosci Microb Food Health 32: 129–137. [CrossRef] 3. Kobayashi T, Fujiwara K, 2013. Comparison of the
CLASSIFICATION OF AGE BY DATA MINING OF MICROBIOTA
accuracy and mechanism of data mining identification of the intestinal microbiota with 7 restriction enzymes. Biosci Microb Food Health 32: 139–148. [CrossRef] 4. Jin JS, Touyama M, Kibe R, Tanaka Y, Benno Y, Kobayashi T, Shimakawa M, Maruo T, Toda T, Matsuda I, Tagami H, Matsumoto M, Seo G, Chonan O, Benno Y, Benno Y. 2013. Analysis of the human intestinal microbiota from 92 volunteers after ingestion of identical meals. Benef Microbes 4: 187–193. [Medline] [CrossRef] 5. http://mica.ibest.uidaho.edu/pat.php. 6. Tamura K, Peterson D, Peterson N, Stecher G, Nei M, Kumar S. 2011. MEGA5: molecular evolutionary genetics analysis using maximum likelihood, evolutionary distance, and maximum parsimony methods. Mol Biol Evol 28: 2731–2739. [Medline] [CrossRef] 7. Mitsuoka T. 2011. The progress of intestinal microbiota research. Biosci Microflora 25: 113–124. 8. Andoh A, Kuzuoka H, Tsujikawa T, Nakamura S, Hirai F, Suzuki Y, Matsui T, Fujiyama Y, Matsumoto T. 2012. Multicenter analysis of fecal microbiota profiles in Japanese patients with Crohn’s disease. J Gastroenterol 47: 1298–1307. [Medline] [CrossRef]
75
9. Andoh A, Imaeda H, Aomatsu T, Inatomi O, Bamba S, Sasaki M, Saito Y, Tsujikawa T, Fujiyama Y. 2011. Comparison of the fecal microbiota profiles between ulcerative colitis and Crohn’s disease using terminal restriction fragment length polymorphism analysis. J Gastroenterol 46: 479–486. [Medline] [CrossRef] 10. Stackebrandt E, Goebel BM. 1994. Taxonomic note: a place for DNA-DNA reassociation and 16S rRNA sequence analysis in the present species definition in Bacteriology. Int J Syst Bacteriol 44: 846–849. [CrossRef] 11. Benno Y, Endo K, Mizutani T, Namba Y, Komori T, Mitsuoka T. 1989. Comparison of fecal microflora of elderly persons in rural and urban areas of Japan. Appl Environ Microbiol 55: 1100–1105. [Medline] 12. Sheridan PP, Miteva VI, Brenchley JE. 2003. Phylogenetic analysis of anaerobic psychrophilic enrichment cultures obtained from a greenland glacier ice core. Appl Environ Microbiol 69: 2153–2160. [Medline] [CrossRef] 13. http://www.megasoftware.net/ Molecular Evolutionary Genetics Analysis. Appendix
Fig. A1, A2, Table A1
76
T. Kobayashi, et al.
Appendix Fig. A1. Phylogram originating from the 36 bacteria concordant with HA624. The letters A—L indicate data referred to in the Appendix Table 1 (Table A).
CLASSIFICATION OF AGE BY DATA MINING OF MICROBIOTA
Appendix Fig. A2. Phylogram originating from the 269 bacteria concordant with HA955. The letters A—U indicate data referred to in the Appendix Table 1 (Table B).
77
78
T. Kobayashi, et al.
Appendix Table 1. Bacterial candidates of OTUs (A,HA624; B,HA955) by BLAST search of 16S rRNA gene sequences