Applying Data Mining to Extract Design Patterns from Unreal Tournament Levels Luca Galli
Pier Luca Lanzi
Daniele Loiacono
Dipartimento di Elettronica,
Dipartimento di Elettronica,
Dipartimento di Elettronica,
Informazione e Bioingegneria
Informazione e Bioingegneria
Informazione e Bioingegneria
Politecnico di Milano
Politecnico di Milano
Politecnico di Milano
Email:
[email protected]
Email:
[email protected]
Email:
[email protected]
Abstract-We
present a study on the application of data min
ing to extract design patterns from Unreal Tournament III levels used in the online gaming scene for
Duel
and
Team Deathmatch
games. The maps' topological structure and their morphology was extracted using ad hoc bots we developed and several statistics have been computed using typical graph algorithms. The process resulted in datasets containing information about all the relevant positions in the maps (the nodes in the game navigation mesh used in the Unreal game engine) and their role in the game (i.e., whether they are navigation points, ammo pickups, weapon pickups, or powerup pickups). We have applied four data mining algorithms to the data to characterize both (i) the maps' type
(Duel
and
Team Deathmatch)
based on the feature of the nodes
they contain and (ii) the node types (ammo, weapon, powerup, or navigation) based on their features. Our results suggest that the maps' type can be characterized in terms of the nodes they contain but it is difficult to characterize the role of nodes based solely on their features.
I.
INT RODUCTION
First-person shooters (FPS) are combat-oriented games in which players navigate complex 3D worlds and engage opponents by exploiting a variety weapons, special powerups, and the knowledge of the territory. Levels in FPS games are usually designed for specific gameplay modes, e.g., single player, multi-player, capture the flag, duel, team deathmatch, and many others. Single-player levels contain a series of challenges designed to obstacle the player ability to reach a specific goal like for instance reach the end of a level/maze, rescue a character or recover an item. Multi-player levels are designed to create suitable areas to foster competition among players. Although the level structure is the simplest aspect to consider when evaluating the level designers' work, other aspects that influence the gameplay must be taken into account. For instance, level designers place objects in the world (weapons, ammunition, and powerups) to assure a smooth, balanced and engaging experience (with interesting but not overwhelming challenges) by taking into account the number of players involved and the target pacing; they also structure the environment to bias players exploration and to make the access to some level areas easier or more difficult There are several papers and books that discuss good principles of game and level design [1]-[4], however only quite recently researchers have tried to systematically identify and
978-1-4799-3547-5/1411.00 ©2014 IEEE
study game design patterns [5]-[10]. The first in-depth study of game design patterns is due to Bjork et al. [5], who identified a set of patterns of players' and game elements interaction. In the context of FPS games, Hullett and Whitehead [11] present a taxonomy of design patterns that appear in single-player first-person shooter (FPS) levels. Hullett [12] also performed a user study to examine common design patterns in single-player first person shooter (FPS) levels and analyzed cause-effect relationship between game design patterns and gameplay. In this work, we applied data mining to extract design patterns from a set of Unreal Tournament III (UT3) levels selected from the most popular ones in the game scene for Duel and Team Deathmatch modes. UT3 has been developed on top of the Unreal Engine using the Unreal Script program ming language. Most of the scripts developed for UT3 are publicly available and can be modified to modify the game. Thus, although the source code of the Unreal Engine is not available, the game itself can still be customized/extended using the proprietary script language. Using Unreal script we developed custom bots to extract information from UT3 maps (whose proprietary format makes them inaccessible unless the UT3 editor and manual inspection is used). In particular, our bots gathered information about the maps' navigation mesh structure (the position of navigation points and the existing connections), the maps' morphology using bots equipped with raytrace sensors (the shape of rooms and open spaces, the width of connecting corridors, the time needed to explore them, etc.), and about the position and characteristics of all the pickup points (weapons, ammunition, and powerups). We applied descriptive and predictive data mining to extract interesting patterns from the data (i) by building models that could determine the game mode associated to a map based on the features of the nodes it contains, and (ii) by building models to predict the type of a node (navigation, weapon pickup, aIllillO pickup, or powerup) based on its characteristics (e.g., its connections to surrounding nodes, its role inside the map, etc.). Our exploration of the collected map data provides a quantitative evaluation of the distribution of weapons in UT3 maps that confirm some of the community knowledge discussed in well-known forums [13]. The predictive models for the map type show that it is possible to characterize the type of map based on the nodes it contains and that some of the attributes (namely, the node pagerank score, authority, and
hub value) are the most relevant features to determine the map type. In contrast, the data does not allow to characterize the node type (whether it is a navigation point, an ammo pickup, a weapon pickup, or a powerup pickup) based on its features. In fact, the predictive models we derived tend to classify all the nodes as navigation and thus cannot distinguish among navigation nodes and the other three types of nodes. Our results suggest that it is possible to characterize Duel and Team Deathmatch maps based on the features of the pickup points they contain but it is difficult (impossible for us) to distinguish the role of a node in a map solely based on its features. The paper is organized as follows. Section II briefly overviews the relevant works on game design patterns. Section III describes Unreal Tournament III and the Unreal Engine while Section IV introduces the Duel and Team Deathmatch game modes used in this work. Section V discusses how the data have been collected and Section VI reports on the experimental results. II.
LEVEL DESIGN PATTERNS
The study of game design patterns is a rather recent but rapidly growing hot topic in the game development cOlmnunity. Indeed, there are several papers and books that discuss good principles of game and level design, however only quite recently researchers have tried to systematically identify and study game design patterns [5]-[10]. Early works related to the study of patterns for level design include [1]-[4], [14]. In particular, Chen et al. [14] compared level design to the architectural design that is used in real world buildings. In [14], the authors identify some architectural principles that level designers may apply to create spaces that enable engaging gameplay, e.g., having a clear path through the level, how to use different spatial organizations such as linear or hub-and-spoke, or including unique elements to break up the design. Clayton [1], Bryne [2], and Feil et al. [3] present in-depth analyses of how level design enables gameplay but they do not identify nor discuss design patterns. Co [4] takes the reader through the process of designing a FPS level, from brainstorming initial ideas, to the actual creation using the Unreal Editor, to the testing and the improving of the level. GUttler et al. [15] examined how space is used in team based multiplayer FPS levels. In [15], the authors focused on collision points and tactical choices: they identified common spatial configurations and how these contribute to gameplay. There are empirical studies that evaluate the effects of level design on gameplay. For instance, Tahhan [16] presents an em pirical study on directional choices in FPS levels. In [16], the author identified different techniques for presenting alternate routes and performed user studies on a set of representative levels. Survey responses and subject observations contributed to the conclusion that choice improves player immersion, as the lack of choice in a linear level can break the illusion of being in large, dynamic world. Gee [17] studied the use of dead-ends in FPS levels and identified ways in which dead ends are used; the experiments presented in [17] suggest that dead ends do not have a negative impact on FPS levels.
Bjork et al. [5] have presented the first in-depth study of game design patterns in which the authors identified a set of patterns, analyzed how players interact with game elements, and how such elements interact with each other in a game. Although, Bjork et al. [5] do not specifically focus on with level design, the patterns they identify are still relevant to tackle the major level design issues (e.g., balancing, goals, locations, and objects). Hullett and Whitehead [11] present a taxonomy of design patterns that appear in single-player first person shooter (FPS) levels to define characteristics of a pattern language for the domain of level design. Recently, Hullett [12] performed a user study to examine common design patterns in single-player first person shooter (FPS) levels and analyzed cause-effect relationship between game design patterns and gameplay. Antonios Liapis et al. [18] identified three game design patterns in maps (area control, exploration and balance) providing formulas for measuring the extent to which a level includes these concepts along with evaluation functions for levels in two different game genres: multiplayer strategy game maps and single-player roguelike dungeons. Giusti et al. [19] present preliminary results on the classification of weapons based on the gameplay behaviors they elicit using a language of common weapon design patterns. Dahlskog and Togelius [20], [21] discussed how procedural content generation and design patterns could potentially be combined in game design and later how to use design patterns in procedural level generation, with particular reference to the classic console game Super Mario Bros. III.
UNREAL TOURNAMENT
III
Unreal Tournament III (UT3) is a best-selling commercial first person shooter (FPS) based on the Unreal Engine, a game engine with impressive rendering, accurate game world physics I which has been used in several cOlmnercial titles.2 UT3 was developed using Unreal Script, a java-like scripting language interpreted by the underlying Unreal Engine. This two-tier architecture separates the development of the game play from that of the engine; accordingly, any modification to the engine does not require a change to the scripts imple menting the gameplay and vice versa. Therefore, although the source code of the Unreal Engine is not available, the game itself can be customized using Unreal Script. In fact, most of the scripts developed for UT3 are publicly available and can be modified to alter the original gameplay. There are two major approaches to modify UT3 using the Unreal Script [22], namely Mutators and Game Types. Mutators are the easiest way to modify almost everything in a game (e.g., the game rules, its goals, the available weapons, the available items and power-ups). Mutators are designed to be applied in a chain to combine their effects. Accordingly, there are limitations on game elements that can be modified using a mutator in order to guarantee the compatibility with other mutators. Game Types are typically used to change the game completely or when it is necessary to perform operations that are not available with mutators (for instance, to access game 1 http://en.wikipedia.org/wiki/PhysX
2http://www.unrealtournament.com
data). Accordingly, they can be used to develop games that are totally different from the original one. IV.
UT3
GAME MODES
UT3 has several game modes available to players: Death match, Team Deathmatch, Capture the flag, Duel, Waifare, Vehicle Capture the Flag, Betrayal, and Greed.3 In this study, we focused on the two game modes that are more popular in the competitive scene, Duel and Team Deathmatch. A. Duel Maps Duel involves two players that have to either reach a target number of kills (or Jrags) or the highest number of frags by the end of the match. It is a demanding game mode that requires deep knowledge of the map and of the mechanics of the game to succeed. Duel maps are typically compact and they are restricted to only 4 to 6 weapon types, with 2 spawn beacons each; spawnpoints are spread widely, yet one will normally spawn in front of a weapon. Duel maps usually do not contain super weapons (e.g., the Redeemer which fires a small nuclear warhead), but have one or two hitscan weapons (which when fired instantly hit whatever they are pointing at) and one or two projectile weapons (e.g., a rocket launcher). An important aspect of Duel games is the control and use of pickups (which can be either categorized as health, armor/shield, and powerups) with limited time or number of uses (e.g., the Jump Boots or UDamage). Pickups often come in two sizes, big and small. For example, T high Pads provides 50 armor points while the Body Armor provides 100 armor points. As discussed in the UT3 community forums4, well designed Duel maps balance ease of access to pickups against the value of the pickup. In Duel maps, ammo, health, smaller armor and the Jump Boots are usually easy to find; in contrast, powerups like the Shield Belt, SuperHealth, UDamage and Invisibility are usually hard to get and expose the player to risks in the process of obtaining them. There is no requirement for any of the pickups to be implemented in a map. B. Team Deathmatch Team Deathmatch (TDM) involves two teams (usually Blue vs. Red) that have to amass more kills (or frags) than the opposing team. The team score is the sum of the frags of each player in the team (computed as the difference between the number of kills and the suicides); the team with the higher frag count wins. Note that, in TDM a single strong player can often lead a team to victory, or conversely if teams are fairly even, a single weak player can drag the rest down. There are few maps specifically designed for TDM and most of the games are played using maps designed for Death match (DM), the extension of Duel to more than two players. However, the actual TDM maps are often much larger than DM and Duel maps and usually fit 8-16 players, or occasionally 4-24 players. TDM maps for more than 24 players are very rare because of the time required to design them, of their 3 http://en. wikipedia.orgl wiki/UnreaLTournamenc3#Game_modes
4http://liandri.beyondunreal.coml
TABLE II: UT3 Pickups Pickup
Bonus
Amount
Jump Boots
Allows increased jumps Doubles the fire rate
3 jumps 27s
Berserk Damage Amplifier
Doubles the damage inflicted
27s
Invulnerability
Provides protection from damage
27s
Invisibility Slow Field
Makes the player invisible Slows any object passing through
27s 180s
Health Vial
Increase health
Health Pack
Increase health
+5 hp +25 hp
SuperHealth Shield Belt
Increase health Damage Absorption
+100 hp 100 damage
Vest
Damage Absorption
50 damage
Thigh Pads Helmet
Damage Absorption
30 damage
Damage Absorption
20 damage
prohibitive download sizes, and for the daunting challenge they pose to balance the gameplay. Because of the size difference, TDM maps tend to be wide open so that hitscan weapons are often dominant. TDM maps seldom have superweapons typically positioned in a difficult-to-reach spot. Depending on the size of the map, there are usually about 6-9 weapon types. Spawn positions are typically near a weapon but fairly far from each other and in somewhat protected areas (for instance, a player will seldom spawn in the middle of an open floor); note that spawn points are not team specific. TDM maps have all standard deathmatch weapons and the number of hitscan weapons is approximately the same as the number of projectile weapons. Low-level powerups are common and usually easy to find, but more powerful ones like the UDamage, SuperHealth, and Belt are either difficult to find or not implemented at all (usually smaller maps will not include them, but larger maps will). V.
COLLECTING GAMEPLAY DATA
In this study, we applied data mining to characterize UT3 maps based on their topology, on the type and position of the pickups and weapons, and the gameplay that the combination generates. For this purpose, we analyzed both static informa tion about the maps' logical structure and their morphology. A. un Maps UT3 maps are created using a special editor that stores them in a proprietary (and inaccessible) binary format contain ing all the map assets and its description as a set of nodes (the PathNodes), their type, and the edges that connect them. Each map object is described by (i) an ID (a string), (ii) a string that identifies its type (NavigationPoints for normal nodes, P ickupFactory for the other items), and (iii) its position (as x,y,z float coordinates). Each object has also specific attributes for the PickupFactory nodes subtypes; Table I and Table II describe all the relevant attributes for the weapons and pickups which can be found in UT3 maps. B. Maps Logical Structure UT3 maps can be analyzed manually using the proprietary editor but this approach is clearly unfeasible when several
TABLE I: UT3 Weapons Name
Primary Type
Primary Damage
I)rimary Rate
Secondary Type
Secondary Damage
Secondary Rate
Weapon l'ickup Ammo
Ammo Pickup
Max Ammo
Enforcer
HilScan
20
3.061s
HilScan
60
1.21/s
50
16
100
Bio Rifle
Projectile
21
3.1/s
Projectile
210
3.1/s
25
20
Shock Rifle
Hitscan
45
0.7/s
Projectile
55
0.54/5
20
Link Gun
Projectile
26
6.9/s
Hitscan
110
I/s
50
40
220
Stinger
Hitscan
14
11.0/s
Projectile
38
3.9/s
100
40
300
Flak Cannon
Projectile
184
I.O/s
Projectile
190
1.0
10
30
Projectile
300
1.05/s
9
30
Zoom
N/A
N/A
10
40
Projectile
1500
Rocket Launcher
Projectile
100
I.l/s
Sniper Rifle
Hitscan
701140(hcadshot)
0.83/s
Redeemer
Projectile
1500
50 50
maps are involved. Accordingly, for this study we modified the controller of a custom bot to automatically collect the maps data by exploring all the map PathNodes in-game.
•
Type of the edge (string), its cost (integer), the travel ing time (float), the health of the pawn at the end of the edge (float)
When UT3 loads a map it performs a sequence of calls to the engine to load the map logical description. At this point, our modified bot can collect all the static information about the map which basically consists of the navigation mesh, the position/type of the navigation nodes, and the edges connecting them. For each node, our bot records the node ID, its type (a label), its position, and its SpecialAction (a Boolean flag which is true if the node requires a special action to be reached, e.g., a rocket or hammerjump). For each edge connecting a pair of nodes, our bot records the ID of the starting and ending nodes, the distance computed in Unreal units (an integer), and the type of the edge (an integer), which describes whether a path requires special actions to be followed.
•
Acquired mean ray distance to the first obstacle (float)
•
Acquired ray min/max distance acquired at each time tick by traveling the edge (float)
•
Acquired ray distance in quartiles (float)
C.
Map Morphology
Morphology is a major component of a FPS 3D environ ment; the presence of open spaces, hallways, small rooms or narrow corridors have an huge impact on the fighting strategies in a first person shooter. Unfortunately, UT3 does not provide access to these information from the map files nor from the description loaded at init time. Accordingly, we devised a bot to explore a map exhaustively to collect the morphology information using methods similar to the algorithms for si multaneous localization and mapping (SLAM) [23] used in robotics. For this purpose, our bot integrates the static map representation (obtained at init time) with the information gathered using a belt of five raytrace sensors positioned at o (facing the direction of movement), 45, -45, 90, and -90 degrees, which retrieve the distance from the first object encountered (mesh or opponent). The bot exhaustively explores all the navigation graph using well-known visit algorithms and at each time tick, for each ray, it collects the mean, the max and min values over the edge and the quartiles. In addition, the bot stores information about the traveling time to explore an edge, the type of edge, the current health level (some paths may pass through dangerous areas like lava) and the internal weight assigned to the path in UT3. Thus, for each edge, the bot collects, •
ID of the path (string)
•
Starting node id (string), label (string), position (a vector of float values)
•
End node id (string), label (string), position (a vector of float values)
Although the use of a bot is the only way to gather morphology information about levels in UT3, it posed several issues which we had to solve using ad hoc heuristics and hacks. For instance, some maps have overlapping path nodes placed by the designer which generated traversal loops in the graph, accordingly, our bot had to include a specific heuristic to iden tify these situations. In addition, there are nearby nodes that are not connected in the static map loaded during initialization because of a limitation of the engine, but the bot could move between them anyway. Accordingly we had to enforce a policy to allow the exploration of such statically nonexistent but dynamically possible connections. Furthermore, some nodes were placed inside dangerous zones (voluntarily or by mistake) that could kill our bot thus enforcing a respawn and making traversal impossible; accordingly, we had to monitor the health status of the bot in each edge and apply corrective measures to ensure that the bot could reach the target node safely or, in case of void areas or traps, avoid deadly consequences. VI.
EXPERIMENTAL RESULTS
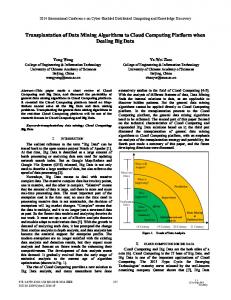
We used the custom bots we developed to collect data from twelve UT3 maps selected from the most popular ones in the competitive scene [24]; in particular, we chose four Duel maps (BioHazard, Fearless, Hypoxia, and RisingSun), five Team Deathmatch maps (CampGrounds, CBP3-Salvation, Diesel, Sanctuary, Subterrane), and three maps used both in Duel and Team Deathmatch games (Deck, Liandri, Sentinel). For each map, we collected the static topology (the nodes and the edges of the Navigation Graph, the position of all the pickups within the map) and the morphology data retrieved from the exploration with a bot equipped with raytrace sensors (Section V). We used the collected data to build the graphs representing the static structure and morphology of the maps; then, we applied graph/network mining algorithms to compute several statistics to evaluate the maps in terms of node connectivity and flow (using the morphology information collected using the raytrace sensors); we also computed several statistics to
and Rocket Launcher are more frequent in Duel maps than in Team Deathmatch. In contrast, Flak Cannon and Sniper Rifle are more frequent in Team Deathmatch maps. Redeemer is never present in maps used exclusively for Duel, this probably due to the smaller size of Duel maps. In fact, Duel maps are often smaller and Duel matches generally have a rather high pace, accordingly, the Reedeemer, the Flak Cannon and the Sniper Rifle are less frequent than in Team Deathmatch where they enable more interesting gameplay. Finally, as it should be expected, the three maps used for both game modes share similarities with both the other map types.
Fig. 1: Topology Graph of Rising Sun
characterize the different types of nodes (that is, navigation nodes, ammo pickups, weapon pickups, and powerups). As an example, Figure 1 shows an example of the graph built for the Rising Sun map using the Gephi tool [25].
Figure 3 shows the distribution of ammo pickups on the maps used for Duel, Team Deathmatch, and for both game modes; there is no ammo pickup for Redeemer because this weapon does not have them. As it can be noted, Team Deathmatch maps and the maps used for both game modes have a rather uniform distribution of ammo pickups whereas in Duel maps the distribution is skewed so that some weapons have much less pickups. The results in Figure 3 can be easily explained considering that Duel is a fast paced mode involving only two players in a small area so that collecting anununition is less important; in addition, in Duel map, limited anununition also does not let one player to take easily over by controlling the more strong weapons. Team Deathmatch maps are usually quite large and fit many players thus is very important for the gameplay to guarantee that players cannot run out of ammunition easily otherwise pace might slow down dramatically. C. Analysis of Nodes
A. Maps Statistics The statistics we collected for each map include (i) Close ness Centrality (the inverse of the farness), computed as the sum of distances to all other nodes, thus the more central a node is the lower its total distance to all other nodes. (ii) Betweenness Centrality computed as the number of shortest paths from all vertexes to all others that pass through that node and can be used to identify whether a node is fundamental in the traversal of the map and, on the contrary, if the node is isolated (e.g. if a pickup is a special one it may be isolated). (iii) Clustering Coefficient, which quantifies how close the node neighbors are to be a clique; clustering coefficients can be used to identify if clusters of nodes are present in the map (e.g. pickups grouped together). Other statistics include the node (iv) degree, (v) in-degree, (vi) out-degree and their weighted counterparts; we also computed the node (vii) authority, (viii) eigenvector centrality, and (ix) its role as a hub.
Figure 4 shows degree, betweenness centrality and pager ank authority for the weapon, ammo and powerup nodes. The plots suggest that weapon nodes (red line in Figure 4) have slightly higher degree and pageRank authority, suggesting that they are more connected and play an important role in the navigation route of the maps. Interestingly, ammo nodes appear to have a slightly smaller betweenness centrality (green line in Figure 4b), suggesting that they are often located in less central area of the maps with respect to the other two types of node. D. Characterizing Maps
B. Weapon and Ammo Distribution on Maps
Finally, we applied different classification algorithms to extract patterns that might characterize Duel and Team Death match maps both in terms of maps structure and in terms of weapon, anuno, and powerup pickups. In particular, we focused on NaIve Bayes, Decision Trees, Decision Rules, and Logistic Regression and used the Weka tool to perform all the analysis [26].
At first, we analyzed the distribution of weapons and ammo pickups in Duel and Team Deathmatch maps to check whether the distribution of the weapons and ammunition is dependent on the map genre as discussed in several UT3 cOlmnunity blogs and to provide a quantitative evaluation of such community knowledge. Figure 2 shows the distribution of weapon pickups on maps used for Duel, Team Deathmatch and for the three maps used in both game types. As it can be noted, Bio Rifle
First, we applied the selected classification algorithms to a dataset containing all the data about the mmno pickup points labeled according to the type of maps they belonged (Duel or TDM); the goal was to extract models that could identify the map type based on the characteristic of the ammo pickups. Table III reports the accuracy obtained by all the algorithms using a ten-fold crossvalidation. As it can be noted NaIve Bayes obtain the least performance probably because of
BioRifle
-powerup -weapon
SniperRifle
f-+-+-f-t--'-+--i-)-'
i'tE:==::;;......A--j-+--J .
LinkGun
-Duel
-TOM
-Both
Degree
(a) Rocketlauncher
Fig. 2: Distribution of weapon pickups on maps for Duel, TDM and both the types of game. BioRifle
Betweenness Centrality
-Duel
-TOM SniperRifle
linkGun
ShockRifle
(b)
-Both
Rocketlauncher
Fig. 3: Distribution of ammunition pickups on maps for Duel, TDM and both the types of game. Authority
(c) their underlying working assumption that all the attributes are independent, which clearly does not hold in this case. All the other algorithms generates models with similar performances that the paired t-test reports to be not statistically significant at the 95% confidence level. We repeated the same procedure with weapons and powerup pickups. Table III shows similar results for ammo and powerups. In all the three cases, Logistic Regression provides the most accurate prediction and in the case of weapons pickups the difference in performance is statistically significant at 95% confidence level. The analysis of the Logistic Regression's coefficients show that the most relevant variables in categorizing the types of pickups (ammo, weapons, and powerups) are the node pagerank, its authority and hub values. This finding was also confirmed by an analysis we performed using feature selection algorithms which reported the same variables as being the most relevant in the dataset. Overall, these results suggest that Duel and Team Deathmatch are well-characterized by some properties of their pickups (the authority, the pagerank and hub values). Next, we applied the same classification algorithms to extract models that could distinguish among the three types of nodes (ammo, weapons, and powerups). Our goal was to
Fig. 4: Weapons, ammo, and pickup nodes: (a) degree, (b) betweenness centrality, and (c) pagerank authority.
determine what characterizes the types of pickup nodes (in this case we did not include navigation nodes). In this problem, the dataset is slightly unbalanced as powerups and ammo pickups are more frequent than weapons pickups. Accordingly, the majority guess has an accuracy respectively of 42.09%, when all the maps type are considered, of 44.97%, when only Duel maps are considered, and of 45.00% when only Team Deathmatch maps are considered. All the methods achieved a rather low classification accuracy, the highest classification accuracy being reached by 57.46% accuracy when all the nodes were considered (both for the Duel and Team Deathmatch maps) and when maps were considered separately. These results suggest that it is difficult to classify the node type based on the node features. At the same time, the results on the map type classification suggest that it is possible to characterize maps based on their node features. Thus, Duel and Team Deathmatch can be characterized by the combination of weapons, ammo, and powerups nodes; however the nodes alone do not provide enough information.
TABLE V: Prediction of the node's type (navigation node, ammo pickup, weapon pickup, or powerup pickup). An exam ple of the resulting confusion matrix (where row is the true class, and column is the predicted class). powerup 23 16 9 5
navigation
ammo
309 2080 307 130
46 41 56 13
weapon 0 3 0 0
pickup navigation ammo weapon
Finally, we applied the same four algorithms to all the map nodes, i.e., pickups (ammo, weapons and powerups) and navigation nodes. Table IV compares the performance of the four algorithms on a dataset containing all the maps nodes, one containing only Duel nodes, and one containing only Team Deathmatch nodes. As it can be noted all the algorithms except Naive Bayes reach a similar accuracy (around the 70%) and, according to a t-test, differences are not statistically significant at a 95% confidence level. The 70% rate roughly corresponds to the actual percentage of navigation node in the dataset and the analysis of confusion matrices (see an example in Table V) show that basically all the models tend to classify everything as navigation points. These results suggest that there might not be specific features that can distinguish among different types of nodes. We performed another set of experiments using a cost matrix that penalized classification of pickup points (ammo, weapons, and powerups) as navigation points. The generated models had the same average performance (around 70%) and they were able to distinguish among navigation nodes, ammo and powerups just slightly better; however, the models still could cannot classify weapon nodes anyhow since most of the weapon nodes were classified as navigation, ammo or powerups. Overall these results suggest that the anuno, weapons, powerups and navigation nodes have not highly distinguishing features that can characterize the specific type. VII.
CONCLUSIONS
We applied data mining to extract design patterns from UT3 levels. We selected twelve popular UT3 maps from the online gaming scene. Then, we developed two ad hoc bots to collect data about the topological structure of the maps and their morphology. We applied graph algorithms to extract several maps/nodes statistics and then applied four classifica tion algorithms to extract models that (i) could characterize the map type based on the features of the pickup nodes they contain and that (ii) could identify the node type based on its topological/morphological features. The exploration of the data we collected provided a quantitative measure of the distribution of weapons in UT3 maps (Section VI-B) confirming also some of the community knowledge discussed in well-known blogs [13]. We applied four classification algorithms to extract mod els to characterize map types based on the features of nodes they contain. Na'ive Bayes generates the least accurate models suggesting that their underlying working hypothesis (i.e., that variables are independent [26]) does not hold in this case. All the other models resulted in models with similar accuracy. The
analysis of variable scoring (produced by Logistic Regression and feature selection methods) shows that pagerank, authority and hub are the variables that better characterize the types of maps. Finally, we applied the same approach to characterize the type of nodes (navigation, powerups, weapons and ammo) based on their features. The results for the characterization of nodes show that no algorithm could find a model that would accurately identify the node type and all of them tend to classify all the nodes as the majority class, that is navigation nodes. Overall our results suggest that Duel and Team Deathmatch maps are actually well characterized by the features of the pickup nodes they contain however nodes per-se are not highly characterized and thus it is difficult to identify the node role by its features. Future research direction include the integration of the data analyzed here with gameplay data extracted from simulated matches using bots. The long term goal is to characterize UT3 maps also using the dynamics element that the maps elicit. REFERENCES [1]
A. Clayton, Introduction to Level Design for PC Games, ser. Charles River Media Game Development. Charles River Media, 2003. [Online]. Available: http://books.google.it!books?id=IIMhd8TGAB8C
[2]
E. Byrne, Game Level Design, ser. Charles River Media Game Development. Charles River Media, 2005. [Online]. Available: http://books.google.it!books?id=iX30WHNf9hMC
[3]
J. Fiel and M. Scattergood, Beginning Game Level Design, ser. Game development series. Thomson Course Technology, 2005. [Online]. Available: http://books.google.itlbooks?id=02geHwAACAAJ
[4]
P. Co, Level designs for games: creating compelling game experiences, ser. New Riders Games Series. New Riders Games, 2006, no. v. 1. [On line]. Available: http://books.google.itlbooks?id=uaRQAAAAMAAJ
[5]
S. Bjork and J. Holopainen, Patterns in Game Design, ser. Charles River Media game development series. Charles River Media, 2005. [Online]. Available: http://books.google.itlbooks?id=IFQfyODK4wAC
[6]
"First workshop on design patterns in games," 2012. [Online]. Available: http://dl.acm.org/citation.cfm?id=2427116&picked=prox
[7]
"Second workshop on design patterns in games," 2013. [Online]. Available: http://dpgJdg2013.orgipapers.html
[8]
S. Bjork, "Game design patterns 2.0," 2014. [Online]. Available: http://gdp2.tii.sel index.php/Main]age
[9]
"The science of level design," 2010. [Online]. Available: https: Il games.soe.ucsc.edu/project/science-of-level-design
[10] [11]
G. Smith, "RPG design patterns," 2014. https:l l rpgpatterns.soe.ucsc.edul doku.php
[Online].
Available:
K. HuUett and J. Whitehead, "Design patterns in fps levels," in Proceedings of the Fifth International Conference on the Foundations of Digital Games, ser. FDG ' 10.
New York, NY, USA: ACM, 2010, pp. 78-85. [Online]. Available: http://doi.acm.orgll0.114511822348. 1822359
[12]
K. Hullett, "Cause-effect relationships between design patterns and designer intent in fps levels," in Proceedings of the Second Workshop on Design Patterns in Games (DPG 2013), ser. DPG ' 13. [Online]. Available: http://dpg.fdg2013.orglpapers.html
[13]
"Liandri archives," beyondunreal.coml
[14]
S. Chen and D. Brown, "The architecture of level design." [Online]. Available: http://www.gamasutra.com/resource�uide/20010716/chen_ Ol.htm
[15]
C. GUttier and T. D. Johansson, "Spatial principles of level-design in multi-player first-person shooters," in P roceedings of the 2Nd Workshop on Network and System Support for Games, ser. NetGames
2014.
[Online].
Available:
http://Iiandri.
TABLE III: Prediction of the map's type (Duel or Team Deathmatch) based on the features of a single node. Accuracy of different algorithms applied to classify ammo pickups, weapons pickups and powerup pickups. The Majority Guess always predicts the most frequent class in the dataset and is reported here as a baseline. classification of
classification of
classification of
Algorithm
ammo pickups
weapons pickups
powerup pickups
Majority Guess Naive Bayes Decision Trees (J4.8) Classification Rules (JRip) Logistic Regression
62.90 42.32 ± 4.15 67.89 ± 5.45 69.75 ± 5.58 69.54 ± 6.31
55.03 48.76 ± 10.84 56.66 ± 9.37 53.98 ± 11.34 63.92 ± 12.78
52.70 51.32 ± 4.99 63.77 ± 7.06 59.19 ± 7.88 65.76 ± 7.39
TABLE IV: Prediction of the node's type (navigation node, ammo pickup, weapon pickup, or powerup pickup). Accuracy of different algorithms applied to classify the nodes of all the maps, of Duel maps and of Team Deathmatch maps. The Majorit Y Guess always predicts the most frequent class in the dataset and is reported here as a baseline. Algorithm
All Maps
Duel Maps
Majority Guess Naive Bayes Decision Trees (14.8) Classification Rules (1Rip) Logistic Regression
70.44 46.34 ± 4.26 70.18 ± 2.75 71.59 ± 1.71 69.85 ± 1.07
69.24 46.34 ± 4.26 70.18 ± 2.75 71.59 ± 1.71 69.85 ± 1.07
' 03. New York, NY, USA: ACM, 2003, pp. 158-170. [Online]. Available: http://doi.acm.orgllO.1145/963900.963915 [16]
A. Tahhan, "Creating meaningful choices in single player first person shooter levels with modifiable spaces," Master's thesis, MIT, 2007.
[17]
R. Gee, "The right way is the wrong way: Dead-end theory in level design." Master's thesis, MIT, 2008.
[18]
A. Liapis, G. N. Yannakakis, and J. Togelius, "Towards a generic method of evaluating game levels," in P roceedings of the AAAI Artificial Intelligence for Interactive Digital Entertainment Conference, 2013.
[19]
[20]
I
Team Deathmatch Maps
71.25 39.98 ± 3.85 73.63 ± 2.04 72.71 ± 1.48 71.61 ± 0.93
DPG ' 12. New York, NY, USA: ACM, 2012, pp. 1:1-1:8. [Online]. Available: http://doi.acm.org/1O.1145/2427116.2427117 [21]
--, "Patterns as objectives for level generation," in Proceedings of the Second Workshop on Design Patterns in Games (DPG 2013), ser. DPG ' 13. [Online]. Available: http://dpg.fdg2013.org/papers.html
[22]
B. Unreal, "Beyond unreal wiki," 2013. [Online]. Available: http: //wild.beyondunreal.coml
[23]
R. Giusti, K. Hullett, and J. Whitehead, "Weapon design patterns in shooter games," in P roceedings of the First Workshop on Design Patterns in Games, ser. DPG ' 12. New York, NY, USA: ACM, 2012, pp. 3:1-3:7. [Online]. Available: http://doi.acm.orgllO.1145/2427116. 2427119
H. Durrant-Whyte and T. Bailey, "Simultaneous localisation and map ping (slam): Part i the essential algorithms," IEEE Robotics and Automation Magazine, vol. 2, p. 2006, 2006.
[24]
Clanbase, "UT3 ladder," 2013. [Online]. Available: http://clanbase.ggl. com/ladders.php?gid=82
S. Dahlskog and J. Togelius, "Patterns and procedural content generation: Revisiting mario in world I level l," in Proceedings of the First Workshop on Design Patterns in Games (DPG 20/2), ser.
[25]
Gephi, "Gephi," 2013. [Online]. Available: hups://gephi.orgl
[26]
I. H. Witten, E. Frank, and M. A. Hall, Data Mining: Practical Machine Learning Tools and Techniques, 3rd ed. San Francisco, CA, USA: