Available online at www.sciencedirect.com
ScienceDirect Procedia Engineering 119 (2015) 918 – 926
13th Computer Control for Water Industry Conference, CCWI 2015
Applying numerical models and optimized sensor networks for drinking water quality control Annalisa Agrestaa*, Grazia Fattorusob, Bruno Lanzac, Massimiliano Fabbricinoa, Marco Trifuoggid, Saverio De Vitob, Girolamo Di Franciab a
Civil, Architectural and Environmental Engineering Dept., University of Naples, - Via Claudio, 21 Naples (Italy) b UTTP/Basic Materials and Devices Lab., ENEA RC Portici, P.le E. Fermi, 1 80055 Portici Naples, (Italy) c UTTP/CHIA Lab., ENEA RC Portici, P.le E. Fermi, 1 80055 Portici Naples (Italy) d Chemical Science Dept., University of Naples, - Via Cintia, 21 - Naples (Italy)
Abstract Drinking water distribution networks must provide safe water to the consumers in adequate quantity and quality. In this framework, the present research work investigates an integrated approach for drinking water quality control by applying hydraulic and water quality models to a real aqueduct. The results of the model simulations allow identifying the optimal locations of monitoring stations in order to achieve an effective contaminant detection, and to ensure the maximum protection of the consumers health. The methodology is applied to a case study, referring to a real aqueduct located in Campania (South Italy). © by Elsevier Ltd. This an open access © 2015 2015Published The Authors. Published byisElsevier Ltd. article under the CC BY-NC-ND license (http://creativecommons.org/licenses/by-nc-nd/4.0/). Peer-review under responsibility of the Scientific Committee of CCWI 2015. Peer-review under responsibility of the Scientific Committee of CCWI 2015
Keywords: Sensor, optimal sensor deployment, aqueduct, sensor location, GIS, InfoWater, Epanet.
1. Introduction Drinking water networks are complex systems, distinguished by spatial extensiveness, pressure variations, and several physical-morphological variables. The water quality along the aqueduct changes substantially during the distribution due to different reasons, including chlorine decay [1], disinfection by-products formation [2] and metal release [3]. Therefore, to ensure high
* Corresponding author. Tel.: +39-081-7723266; fax:+39-081-7723344. E-mail address:
[email protected]
1877-7058 © 2015 Published by Elsevier Ltd. This is an open access article under the CC BY-NC-ND license
(http://creativecommons.org/licenses/by-nc-nd/4.0/). Peer-review under responsibility of the Scientific Committee of CCWI 2015
doi:10.1016/j.proeng.2015.08.969
Annalisa Agresta et al. / Procedia Engineering 119 (2015) 918 – 926
water quality levels, the aqueduct should be equipped with a sensor network, for continuous and instantaneous monitoring of physical and chemical parameters. The availability of data by several sensors located on the networks as well as a hydraulic and water quality model of the water distribution system would arm the water utilities of a comprehensive set of analytical capabilities for identifying, monitoring, and tracking contaminants along the network and reacting more quickly and efficiently. The monitoring systems installed along a water distribution network would allow protecting it by contamination due to terrorist attacks or during the course of normal operations due to metals, organic contaminants, and asbestos in pipe materials and linings can leach into the system, and soil and ground water contaminants can permeate plastic pipes. [4]. Indeed, while the physical security of water drinking network can be increased limiting access to aboveground facilities such as plants, reservoirs and pump stations, the distribution system itself remains largely unprotected against potential contamination [5]. In the last years, using sensors has more interest for water operators and several new objectives for location of sensors/monitoring points are being considered [6]. The capability to monitor the distribution system in real-time is fundamental to ensure an early warning detection and timely notification and alarm. Because instrumentation of every node of the network is prohibitively expensive, the optimal placement of the sensing devices becomes a crucial issue. Sampling design methodologies in literature are different depending on objective of monitoring [7], such as methods to determine optimal placement schemes for effective contaminant detection [8], methods to determine optimal schemes for model calibration [9], and methods for leak and burst detection or source tracing [10]; each formulation of which may be largely irrelevant outside of its own context. Several methodologies have been developed to tackle the problem of sensor placements with single or multiple objectives [11]. The optimality criteria is defined according to particular operational usage; naturally, the best data points on a network are axiomatically influenced by the intended usage of the data posterior to any given sampling scheme i.e. an optimal distribution for effective contaminant detection could be dissimilar to an optimal distribution with regards to efficient model calibration. The sensor placement process can be automated with optimization methods that computationally search for a sensor network design that minimizes contamination risks. For this aim, it is necessary to use hydraulic and water quality software for evaluating the network dynamic behavior. In literature, several software are available for building and running hydraulic models for water distribution systems [11, 12]. Combining sensor networks for monitoring and software components for applying numerical modeling, we obtain smart drinking water network, i.e. smart technological solutions that promise more efficient and sustainable water systems. More specifically, a smart drinking water network involves integrated technological solutions based on smart sensing systems distributed along the infrastructures for monitoring hydraulic and water quality parameters; numerical modelling for simulate hydraulic and water quality behavior and integrated and advanced information systems (e.g. GIS; DSS; SWE based, etc.) [13] for accessing, browsing, analyzing and processing real time and time series observation data as well as predictive scenarios . Such an approach is here investigated and developed for improving water quality control and management services within water distribution systems. In particular, by hydraulic modeling along with geospatial capabilities (e.g. spatial analysis, geo-processing and geo-visualization), available in GIS based platform, networked and continuous water quality probes are optimally located along a water distribution system for achieving a more effective and reliable water quality monitoring and control. Optimal sensor locations schemes are hence obtained on the basis of more accurate and readily available spatial information such as the location of the critical facilities (i.e. hospitals and schools), and the populations density and so on, as well as the dynamic water quality behavior of the water distribution systems. In the present work, as integrated technological solution, we use HR-InfoWater [15], a GIS based water distribution software, with additional functionality for potential purposeful contamination events and for the population safety. HR-InfoWater allows determining optimal placement of extraction and monitoring instruments and helping to develop monitoring regimes for routine screening of distribution system water quality. The objective of this work has been to define and compare optimal locations schemes of water quality probes to be installed along the real aqueduct of Santa Sofia, located in Campania (South Italy), in order to achieve more effective monitoring and control services.
919
920
Annalisa Agresta et al. / Procedia Engineering 119 (2015) 918 – 926
The first section of the paper describes the methodology used for obtained an intelligent and cost-effective monitoring. In this section are showed the instruments and technologies necessary for the aim of the work. The second section describes the case study and the results for several practical situations, discussing them in details. The last section constitutes the summary and the conclusions drawn from these results. 2. Methodology The water drinking network protection is a fundamental aspect for human health safeguard. Drinking water networks are characterized by several elements as pipes, pumps, valves, reservoirs, storage tanks, treatment plants, and fire hydrants. Their complexity, the extension area of the service and the numerous entry points, can facilitate accidental or intentional introduction of contaminants. Control of contaminants in drinking water systems [16] is a complicated problem for several aspects as, municipal distribution systems are large, consisting of hundreds or thousands of miles of pipe; flow patterns are driven by time-varying demands placed on the system by customers; and distribution systems are looped, resulting in mixing and dilution of contaminants. In this research work, the GIS technology combined with the hydraulic and water quality models, generally involved within a smart drinking water network solution, have been used in a novel way for achieving a continuous and cost-effective monitoring of drinking water quality. More specially, the approach aims at improving the control e management of the drinking water quality through networked and continuous water quality monitoring probes optimally located along the network taking into account physical as well as social and spatial criteria. This methodology has been developed by using HR-Wallingford Info-Water, that integrates hydraulic and water quality engine codes (Epanet and Epanet-MSX) in the GIS software platform ESRI-ArcGIS [17] and applied to a real aqueduct, Santa Sofia aqueduct, located in Campania (Southern Italy). The objective has been to define a limited number of sensors on the aqueduct for guaranteeing an efficient water quality control through an optimal sampling design. The approach investigated, fully automated, essentially generates optimal sensor location schemes according to different objectives and multiple scenarios, and evaluate and compare their trade-offs. It is based on a hierarchical selection process coupled with a stepwise approach based on water distribution network characteristics; hydraulic and water quality results; and proximity to critical facilities as well as population density, considered driven criteria for human health safeguard. Thus, building hydraulic and water quality models for evaluate the aqueduct dynamic behavior becomes crucial an priority. For building the hydraulic model, several information by different sources are required such as the GIS layers, information gathered from the facility site visits and existing worksheets. The calibration of water quality model as well as hydraulic model is performed through an iterative process by adjusting the principal models parameters on the basis of the measured data along the aqueduct. After the construction of the network models, the optimal sensor locations are achieved by applying a four-step hierarchical selection scheme. This scheme includes: (1) definition of all possible locations to be monitored, (2) setting of the simulated hydraulic and/or water quality variables, (3) integration of the spatial information such as the proximity to critical facilities/customers as well as the population density, and finally (4) score classification of the parameters values involved in the process. In the first step, some locations may be excluded on the basis of practical considerations. The sensors locations process can be developed both on pipes and node so that it is possible to exclude by process individual node or single pipe. Usually, the nodes can be excluded for physical inaccessibility but also for others reasons, as nodes located in an intersections; nodes associated with backflow preventers; nodes below or above a certain elevation and dead end nodes. Similarly , the pipes can be exclude for inaccessibility; dead end pipes; pipes with check valves; pipes with backflow preventers and pipes connected to tank/ reservoir, pumps and valves. In the second step, after building the hydraulic and water quality models, the drinking water network behavior is simulated for an extended period. Thus, the simulation values, associated to nodes and pipes, are introduced into the process as single value at a given time as well as maximum value over all time, or minimum value over overall time, or an average value overall time.
Annalisa Agresta et al. / Procedia Engineering 119 (2015) 918 – 926
In the optimal sensor locations process, the parameters can be involved are both physical and/chemical than spatial ones. For example, associated to the junctions, we can consider parameters such as demand, pressure, concentration, water age as well as point elevation and population density and so on. Similarity, for the pipes, the variables can be flow, velocity, pressure, roughness, concentration and water age as well as population density. For each selected parameter to be involved into the sensor locations process, their values associated to nodes are split into score ranges, forming in statistical terms a “bin” of the variable for each range. Since this score classification may directly affect the final total score, it is important to find a suitable range for each parameter. The score classification can be realized on the basis of methods generally used in GIS software, such as Natural Breaks, Quantile and Equal Interval [18] methods as well as manually. The assigned higher score indicates a higher level of concern so monitoring would be preferred in the higher score location. For example, the low pressure values receive higher scores, indicating that these locations have most probability of accidental contamination, therefore, a sensor would be preferred at that location. Similarly the higher water ages receive higher scores indicating that these areas have potentially a low water quality . In the third step, spatial information layers such as critical facilities and areas with high population density are integrated into the process. In particular, critical facilities such as schools, hospitals as well as fire and police stations, military installations, and others can be included. In this case, sensor locations closer to the critical facilities and densely populated areas would have a higher priority and may receive higher scores. In the final step, the total sensor score is given by the sum of the scores assigned to each involved parameter as for example the simulated chemical/physical parameter and the distributed population density. Finally, being the sensors number a relevant element in sampling plan cost, it is possible to limit number of the sensors specifying the maximum number or the minimum distance between sensors. 3. Case study The investigated methodology has been applied to the real aqueduct Santa Sofia located in Campania (South Italy) for providing this system of networked and continuous multi-parametric probes in order to improve water quality monitoring and control services. In particular, the following cases have been processed: (1) protecting the network by potential purposeful contamination events according to its hydraulic performance and mitigating adverse public health and economic impacts; (2) assuring water quality preservation (maintaining a disinfection residual ~ 0.2 mg/L for free chlorine). The Santa Sofia aqueduct (Fig. 1) supplies water to two provinces (Naples and Caserta) of the Campania region for a total of 28 municipalities. The reservoir is located to San Prisco municipality (Caserta) and the network stretches about 22 km. The materials of the conduct are prestressed concrete, cast iron and steel, in particular, the main trunk in prestressed concrete NPS 1400 (Nominal Pipe Size) constructed about 1970/1980, splits in cast iron and steel pipes with NPS 800 and NPS 700. The network is disinfected in San Prisco reservoir with 0.2 mg/l of sodium hypochlorite. For our scopes, as first step, the Santa Sofia hydraulic model has been built. This step has been carried out by collecting geometric, geomorphological and hydraulic data such as pipes depth, diameters, localization of valves and related status, water variation of reservoir and so on. These data has hence been performed into the HR-InfoWaters software, obtaining the hydraulic model of the Santa Sofia aqueduct, characterized by 607 nodes, 1 reservoir, 5 valves, 616 pipes.
921
922
Annalisa Agresta et al. / Procedia Engineering 119 (2015) 918 – 926
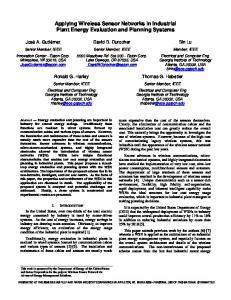
Fig. 1 Case study: the Santa Sofia aqueduct model scheme
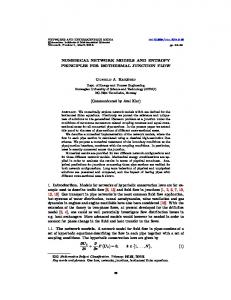
Thus a calibration process has been performed by adjusting the network model parameters so that simulated outputs reflected the true behavior of the system. For model calibration, the pressure and flow data measured along the network have been used. In particular, a specific pattern demand (calibration flow) (Fig. 2) has been built and roughness data (calibration pressure) have been modified as long as minimum difference between observed data and simulation data have been obtained.
Fig. 2 Pattern demand used for hydraulic model calibration
Annalisa Agresta et al. / Procedia Engineering 119 (2015) 918 – 926
The model calibration process has also been applied to chlorine decay model. The typical model used for simulation of chlorine decay along an aqueduct is a first order kinetic model. The calibration process has regarded the definition of two constants (bulk and wall constants) through chlorine values measured in several points of the system. For obtaining the constants, a in situ measurements plan has been carried out along the Santa Sofia aqueduct. Then, the hydraulic and water quality models have run on a 24-hours simulation period, evaluating chlorine and physical variables into all network junctions. According to the investigated methodology, all junctions of the network model have hence been selected as possible monitoring locations. By excluding the dead end nodes and junctions located after closed valves, identified as unavailable or inaccessible areas, the potential monitoring locations along the Santa Sofia network becomes 500 as shown in Fig. 3.
Fig. 3 Potential locations scheme along the Santa Sofia model
The investigated sensor location process can be based on five type of model output parameters, i.e. demand, pressure, water age and concentration (chlorine decay). Other characteristic can be considered is the population density derived by dataset of municipalities supplied by Santa Sofia aqueduct. Regarding the case of safeguarding the network by contamination events, more optimal sensor locations schemes have been processed. At first, a scheme has been derived on the basis of the consideration that low pressure values can increase the probability of significant contamination events (Fig.4). For obtaining this scheme, the simulated pressure values, averaged the 24-hours simulation period in each potential locations, have been used as selection criterion, clustering, according to the Natural Breaks method, these values into 10 score rages where higher score values are assigned to lower pressure values. This scheme locates the most of the water quality probes to be installed within southern area of the network model. In fact, we can observe (fig. 4) that the pressure variation range is 10-20 m-H2O into a selected junction, unlike the pressure variation range registered into a not-selected junction is 74-78 m-H2O. .
923
924
Annalisa Agresta et al. / Procedia Engineering 119 (2015) 918 – 926
Fig. 4 An optimal chemical sensors scheme based on low pressure value criterion
Another scheme has been processed combining the low pressure value criterion with high population density one, in order to mitigate the social impact of a occurred significant contamination event (Fig. 6). This scheme has been obtained summing the sores associated to the clustered values of the parameters.
Fig. 5 Optimal chemical sensors scheme by combining low pressure value and high population density criteria
For assuring water quality preservation, an optimal chlorine probes locations scheme has been defined taking into account chlorine decay process and population density of the served municipalities (Fig. 6). A serious public health impact of water quality deterioration is the loss of disinfectant residual, which can weaken the barrier against microbial contamination. Therefore it is very important monitoring of chlorine along the aqueduct near areas with greater chlorine decay.
Annalisa Agresta et al. / Procedia Engineering 119 (2015) 918 – 926
Fig. 6 Optimal chlorine probes scheme by combining chlorine decay process and population density
For obtaining this scheme, the simulated chlorine residual values, averaged the 24-hours simulation period in each potential locations, have been used as selection criterion together with the population density associated to served municipalities. For each parameter, the related values are clustered according to the Natural Breaks method, into 10 score rages assigned higher score values to lower chlorine concentration values ranges and higher population density values ones. In order to optimize the monitoring cost (i.e. sensors number), it is possible to define a minimum distance between sensors. For the scheme presented above, a distance equal to 2 km has been set. Thus, by applying our method, the junctions are sorted in descending order based on their total score and the selection proceeds considering the minimum distance requirement between two sensor locations. The junction with the highest total score is first selected as an optimal site and the subsequent junction with the next highest total score, that lies outside the minimum radius from the previously selected junction, is then selected as another optimal site. 4. Summary and conclusions Water quality may change significantly during the distribution due to different reasons, including chlorine decay, disinfection by-products formation and metal release. At the same time, drinking water quality can change by means of relevant contamination events. In this context, a distributed and continuous monitoring of water distribution systems would allow water utilities to identify and track contaminants as well as quickly compare gathered water quality data against regulatory requirements (e.g., maximum contaminant levels) over time and along the water network, identifying water quality changes and anomalous events, forecasting potential hazards and adverse public health impacts . At this aim, an optimal placement of a limited number of sensors along a water distribution system is essential for achieving a performance and cost-effective monitoring of water quality. In the present research work, an integrated approach has been developed based on numerical modelling and geospatial capabilities available into GIS platforms. This approach can be developed for predicting spatial and temporal variations in the contaminants concentration throughout a network and improving drinking water network monitoring and control services. The results have been obtained by using a commercial software, HR-Wallingford InfoWater, that integrates hydraulic and water quality engine codes (Epanet and Epanet-MSX) in a GIS software platform: ESRI-ArcGIS. Using this integrated platform it is possible: i) to build the hydraulic and water quality models of the aqueduct; ii) to process the geographical and elevation characteristics of it; iii) to extrapolate the required information of population; and iv) to visualize spatial distributed output scenarios.
925
926
Annalisa Agresta et al. / Procedia Engineering 119 (2015) 918 – 926
Through the proposal methodology, the water authorities will be able to identify the optimal locations of the sensors to be installed along the water distribution system and hence to optimize the water distribution network control and management services. Acknowledgements The authors thanks AcquaCampania SpA, the water authority of Santa Sofia aqueduct. It has made possible achieving these research results, providing all necessary datasets for building and calibrating the models. References [1] N.B. Hallam, J.R. West, C.F. Foster, J.C. Powell and I. Spencer, “The decay of chlorine associated with the pipe wall in water distribution systems.” Water Research, 36(14), 3479-3488, 2002 [2] Fattoruso, G., et al. "Use of Kinetic Models for Predicting DBP Formation in Water Supply Systems." Sensors and Microsystems. Springer International Publishing, 2014. 471-474. [3] M. Fabbricino and G.V. Korshin, "Changes of the corrosion potential of iron in stagnation and flow conditions and their relationship with metal release." Water Research, 62(1), 136-146, 2014. [4] U.S. EPA. (2002a). Permeation and Leaching, U.S. Environmental Protection Agency, Office of Water, Office of Ground Water and Drinking Water, Washington, D.C. [5] Hall, J., Zaffiro, A. D., Marx, R. B., Kefauver, P. C., Krishnan, E. R., Haught, R. C., & Herrmann, J. G. On-line water quality parameters as indicators of distribution system contamination. Journal (American Water Works Association), 66-77, 2007. [6] Huang, J. J., McBean, E. A., & James, W. (2006, August). Multi-objective optimization for monitoring sensor placement in water distribution systems. In8th Annual Symp. on Water Distribution Systems Analysis (pp. 1-14). New York: Environmental and Water Resources Institute of ASCE (EWRI of ASCE). [7] Lynch, Jerome P., and Kenneth J. Loh. "A summary review of wireless sensors and sensor networks for structural health monitoring." Shock and Vibration Digest 38.2 (2006): 91-130. [8] Hart, W. E., & Murray, R. (2010). Review of sensor placement strategies for contamination warning systems in drinking water distribution systems. Journal of Water Resources Planning and Management, 136(6), 611-619. [9] Kapelan, Z. S., Savic, D. A., & Walters, G. A. (2003). Multiobjective sampling design for water distribution model calibration. Journal of Water Resources Planning and Management, 129(6), 466-479. [10] Berger-Wolf, Tanya Y., William E. Hart, and Jared Saia. "Discrete sensor placement problems in distribution networks." Mathematical and Computer Modelling 42.13 (2005): 1385-1396. [11] Rathi, S., & Gupta, R. (2014). Sensor Placement Methods for Contamination Detection in Water Distribution Networks: A Review. Procedia Engineering, 89, 181-188. [12] Mitchell, V. G., Duncan, H., Inma, R. M., Stewart, J., Vieritz, A., Holt, P., ... & Breen, P. (2007). State of the art review of integrated urban water models.Novatech Lyon, France, 1-8. [13] Charef, A., Ghauch, A., Baussand, P., & Martin-Bouyer, M. (2000). Water quality monitoring using a smart sensing system. Measurement, 28(3), 219-224. [14] Rossman, L. A. (1999). The epanet programmer’s toolkit for analysis of water distribution systems. In ASCE 29th Annual Water Resources Planning and Management Conference (pp. 39-48). [15] Soft, M. W. H. "Inc. a: InfoWater 3.2 Users Guide (2006)." [16] Clark, R. M., Grayman, W. M., Males, R. M., & Hess, A. F. (1993). Modeling contaminant propagation in drinking-water distribution systems. Journal of environmental engineering, 119(2), 349-364. [17] Ormsby, N., & Burke, G. (2004). Getting to know ArcGIS desktop. The JSTE TEACHER EDUCATION, 93. [18] Minami, M. (2002). Using ArcMap. In Using ArcMap. ESRI.