Advanced Review
Applying statistical thinking to ‘Big Data’ problems Roger W. Hoerl,1∗ Ronald D. Snee2 and Richard D. De Veaux3 Much has been written recently about ‘Big Data’ and the new possibilities that mining this vast amount of data brings. It promises to help us understand or predict everything from the Higgs boson to what a customer might purchase next from Amazon. As with most new phenomena, it is hard to sift through the hype and promotion to understand what is actually true and what is actually useful. One implicit or even explicitly stated assumption in much of the Big Data literature is that statistical thinking fundamentals are no longer relevant in the petabyte age. However, we believe just the opposite. Fundamentals of good modeling and statistical thinking are crucial for the success of Big Data projects. Sound statistical practices, such as ensuring high-quality data, incorporating sound domain (subject matter) knowledge, and developing an overall strategy or plan of attack for large modeling problems, are even more important for Big Data problems than small data problems. © 2014 Wiley Periodicals, Inc. How to cite this article:
WIREs Comput Stat 2014. doi: 10.1002/wics.1306
Keywords:
data mining; statistical engineering; analytics; machine learning
INTRODUCTION
C
hris Anderson, then editor-in-chief of Wired Magazine, launched a major scientific controversy with his 2008 article entitled ‘The End of Theory; the Data Deluge Makes the Scientific Method Obsolete’.1 While there was an immediate backlash from the scientific community,2,3 it seems that this article merely stated in print what many in the Big Data community had been assuming for some time; that because of the quantity and speed of data production, new technologies could now solve major scientific and industrial problems solely through empirical data analysis, without the use of scientific models, theory, experience, or domain knowledge. As another example of this thinking, Mayer-Schönberger and ∗ Correspondence 1 Department
to:
[email protected]
of Mathematics, Union College, Schenectady, NY,
USA 2 Snee
Associates, Newark, DE, USA
3 Department
of Mathematics and Statistics, Williams College, Williamstown, MA, USA Conflict of interest: The authors have declared no conflicts of interest for this article.
Cukier4 argue that we no longer have to be ‘fixated on causality’ and that the world is ‘shift[ing] from causation to correlation’. Certainly, data are being collected at an ever-increasing pace, through social media, online transactions, and scientific research. According to IBM, 1.6 zetabytes (1021 bytes) of digital data are now available. That is a lot of data—enough to watch high-definition TV for 47,000 years.5 Hardware, software, and statistical technologies to process, store, and analyze this data deluge have also advanced, creating new opportunities for analytics.6 For the purposes of this paper, we define analytics as quantitative methods used to discover meaningful information in data. This somewhat generic definition is intended to avoid a debate over what is statistics versus applied math, machine learning, and so on, which is not our current focus. However, the key question remains; given this deluge of data, do the ‘fundamentals’ of statistical thinking still apply?7 Has technology advanced to the point where we can just ‘push the button’ and expect good results from analytics? We argue that with large data sets and sophisticated algorithms, these fundamentals are actually more important than
© 2014 Wiley Periodicals, Inc.
wires.wiley.com/compstats
Advanced Review
Clear problem statement Modeling process
Sequential approach
Process understanding
Statistical thinking building blocks
Domain knowledge Quality data
Analysis strategy
Variation sources
FIGURE 1 | The building blocks of statistical thinking.
ever. Figure 1 illustrates the building blocks of these statistical thinking fundamentals.
BACKGROUND ON BIG DATA What exactly is ‘Big Data’, and why does data size matter? We define Big Data as collections of data sets that are too big and too complex to be processed and analyzed using standard data processing and statistical analysis tools.8 As a trivial example, a large data set, such as a petabyte of data (1015 bytes), will not fit into Excel, and cannot be stored on a standard laptop, so alternative approaches are needed. Most commercial analytics software programs are unable to process data sets of this size. In terms of analysis, a standard plot of x versus y with such data sets will generally produce a large black blob—too much data to see what is going on. Many statistical hypothesis tests will show statistical significance simply because of the massive sample size—even if the differences are not important in practice. So clearly, alternative approaches and analysis methods are needed for processing and analyzing Big Data. A large number of new statistical methods, from statistics, machine learning, and computer science, have been developed in the past 30 or so years aimed at taking advantage of large amounts of data. Some problems, referred to as unsupervised problems, have no specific response variable, but try to find groups of related observations. A variety of clustering methods have been developed to help solve these problems. For supervised problems whose goal is to predict the value of a specific response variable or variables from other explanatory variables, methods such as neural networks, classification and regression trees (CART) and support vector machines are now commonly used. Recently ‘ensemble’ methods that resample the data
and integrate multiple models into an overall ‘grand’ model have become more popular.9–11 These include random forests and boosting methods among others. Because they resample the data, take multiple paths, and include highly nonlinear fitting, they are computationally intensive. The high degree of nonlinearity gives the models flexibility while the computational intensity often results in a focus on speedy and accurate algorithms. Computational efficiency is a fine goal, but if the focus becomes myopic on algorithms (‘a good algorithm can solve any Big Data problem’), then it can be expected that modeling fundamentals are likely to be overlooked.2 At the beginning of the new millennium, the book Competing on Analytics12 foretold the potential impact that data analytics might have in the business world. Shortly thereafter, Netflix announced a $1,000,000 prize for anyone who could develop a model to predict their movie ratings at least 10% better than their current model.13 Picking up on the popularity of this challenge, the website kaggle.com emerged as a host to online data analysis competition, what might be called the ‘eBay of analytics’.14 Further demonstrating the power of data and analytics, in 2011 the IBM computer ‘Watson’ defeated human champions in the televised game show ‘Jeopardy’.15 In the field of science, ‘Big Data is increasingly the norm in astronomy’,16 due in this case to the continuous transmission of massive amounts of data from government telescopes. Similar comments could be made of physics, biology, and virtually all the physical sciences.17 In 2012, the Federal government formally got into the act as the White House launched a national ‘Big Data Initiative’.18 The tremendous positive impact of Big Data on our lives was clearly demonstrated when the actress Angelina Jolie decided to have a double mastectomy in 2013, not because she was diagnosed with cancer, but rather because analysis of her DNA revealed a BRCA gene mutation, which leads cancer models to predict a much higher rate of breast cancer.19 In other words, a well-known celebrity made the decision to have invasive surgery because of analytics, rather than an existing medical diagnosis. It is quite possible that Big Data analytics saved Jolie’s life. Clearly, Big Data is here to stay, and is revolutionizing business, industry, government, science, education, medicine, and virtually all aspects of society. As an obvious, but very important example, modern search engines such as Google and Bing have revolutionized research in virtually all fields, making research much more productive. Those who did research in the pre-Google era can no doubt relate to this point (Box 1).
© 2014 Wiley Periodicals, Inc.
WIREs Computational Statistics
Applying statistical thinking to ‘Big Data’ problems
Dr. Nevins, no longer directs one of Duke’s genomics centers. The cancer world is reeling.
BOX 1 WHAT ABOUT DATA SCIENCE? The term data science was first suggested as a discipline by Cleveland,20 who argued that the statistics profession change its name to ‘data science’, as that was, in fact, what statisticians did. Since then, the term data science has more often been used to describe a vaguely defined discipline typically involving some mixture of statistics and large-scale computing.21 As noted by Press22 : The story of how data scientists became sexy is mostly the story of the coupling of the mature discipline of statistics with a very young one, i.e. computer science. The term ‘data science’ has emerged only recently to specifically designate a new profession that is expected to make sense of the vast stores of Big Data. But making sense of data has a long history and has been discussed by scientists, statisticians, librarians, computer scientists, and others for years.
WHAT COULD POSSIBLY GO WRONG? Given the proven power and impact of Big Data analytics, it is easy to be caught up in the hype and believe that massive data plus advanced analytics equals success. Unfortunately, there are numerous counter-examples, in which sophisticated analytics performed on large data sets, produced very unfortunate results. Perhaps the best known is the Duke Genomics Center debacle. Two Duke researchers, Anil Potti and Joseph Nevins, published groundbreaking gene signature papers that suggested successful treatments for breast cancer could be found based on women’s DNA.23 Unfortunately, clinical trials based on these studies did not produce the expected results, with more women dying than the models predicted. Two statisticians, Keith Baggerly and Kevin Coombes, were brought in to investigate. After months of investigation, Baggerly and Coombes shared their findings. The results were shocking24 : Dr. Baggerly and Dr. Coombes found errors almost immediately. Some seemed careless—moving a row or column over by one in a giant spreadsheet—while others seemed inexplicable. The Duke team shrugged them off as ‘clerical errors’. At the end, four gene signature papers were retracted. Duke shut down three trials using the results. Dr. Potti (lead investigator) resigned from Duke. His collaborator and mentor,
In the world of finance, the bankruptcy of Lehman Brothers on September 15, 2008 remains the largest bankruptcy in history, involving a corporation with over $600 billion in assets.25 Interestingly, the first author had visited Lehman Brothers’ New York headquarters a few years earlier, along with a team from GE Capital and GE Global Research. The purpose of the visit was to review default prediction models that Lehman Brothers was selling commercially. To provide some background, prediction of corporate default is a critical challenge in finance, whether the institution is investing or simply providing loans. Default obviously leads to loss of some or all of the capital invested or loaned. While this has historically been one of the most researched topics in finance, in our opinion there is still no generally accepted means of default prediction across the industry. As with most financial organizations, Lehman Brothers had found that access to the right data is key to developing good models. Like other peers, they had developed a very large proprietary database on historical defaults, involving thousands of companies, and spanning decades, that was used to develop default models. Lehman Brothers analytics group had spent years on developing and testing models that might predict corporate defaults, hopefully earlier and more accurately than their competitors. After demonstrating success in out of sample predictions, and using the model internally, the company realized that their data and models had economic value themselves, and began marketing these models to others. These models involved sophisticated analytics, integrating both subject matter theory and empirical methods. As noted previously, they were based on large sets of historical data. Ironically, the sophisticated models and large data sets used by Lehman Brothers did not accurately predict its own default. With hindsight, one might say that a key assumption of the models was that the future would look like the past, i.e., that the probability of a major negative event broadly affecting the markets in the future was equal to the probability of it happening in the past. Of course, Lehman Brothers was not the only financial institution in distress in 2008, and many of these others also had sophisticated models based on very large historical data sets.26 We believe that many of these models were also based on the implicit assumption that the future would be, in some sense, a random sample from the past. A more humorous example of Big Data analytics run amuck is the case of the biology textbook The Making of a Fly.27 On April 18, 2011, this textbook debuted on Amazon.com, which is of course a leader
© 2014 Wiley Periodicals, Inc.
wires.wiley.com/compstats
Advanced Review
in the field of Big Data analytics.10 Amazon used an automated algorithm to set an initial price on the textbook at the astonishing rate of $1,730,045. Even more shocking, competitive websites, such as Barnes and Noble, benchmarked this price electronically and started raising their prices, resulting in Amazon doing the same. Shortly thereafter, this ‘electronic price war’ resulted in Amazon’s price increasing to $23,698,656 (plus $3.55 for shipping).28 Amazon quickly manually overrode the algorithm, and a price of $106 was set; the book began to sell. As a final example, economists Carmen Reinhart and Kenneth Rogoff published the result of research on a large data set including 44 countries and spanning over 200 years of history.29 Their analysis demonstrated a negative growth rate for countries with a high debt to gross domestic product [debt/gross domestic product (GDP)] ratio, which had obvious implications for economic policy. However, another set of economists set out to replicate the original results, but could not.30 Upon further investigation, they determined: ‘We … find that coding errors, selective exclusion of available data, and unconventional weighting … led to serious errors … Our finding is that when properly calculated, the average real GDP growth rate for countries carrying a public-debt-to-GDP ratio of 90 percent is actually 2.2 percent, not -.1 percent as published in Reinhart and Rogoff’. (p. 1). In other words, when the data issues were addressed, the conclusions were exactly opposite of those originally published, i.e., that high debt leads to increased growth, not decreased growth. Reinhart and Rogoff later acknowledged the data coding errors, while maintaining that their use of exclusion of data and weighting was appropriate. Further, they acknowledged that by correcting the data coding errors, the growth rate for high debt to GDP countries goes from negative to positive.31 Even some of the well-known ‘successes’ of Big Data analytics have actually been less successful than is generally known. For example, some time after the publicity of the Netflix $1 million competition, Netflix engineers acknowledged that: ‘The additional accuracy gains....did not seem to justify the engineering effort to bring [the ensemble of 107 methods] into a production environment’.13 Similarly, Fung noted that ‘Lost in the hype over Big Data is an honest evaluation of the benefits of having processed all the data. When placed in their proper context, claims of extraordinary value appear exaggerated’.32 It would be logical to ask what happened in each of these cases, and other Big Data disappointments that appear to occur too frequently.33 Generally, more
data is better than less data, and the powerful new tools mentioned previously work extremely well in many situations. However, extraneous data can make the problem of finding important information harder, not easier. Further, we argue that it is not the analytics that are at issue, but rather the way analytics are being applied, and the data to which they are being applied. That is, in the excitement over massive databases, and the power of newer, computationally intensive algorithms, fundamentals of statistical thinking are frequently overlooked. If, in fact, Big Data means that the ‘sample size equals all’,34 some may believe that they are not needed. The term ‘sample size equals all’ has been used to suggest that the data set includes the entire population of interest. We discuss several statistical thinking fundamentals that we believe are critically important, and which when applied to Big Data problems are likely to produce actionable and valid conclusions.
STATISTICAL THINKING FUNDAMENTALS Statistical thinking has been defined as: ‘A philosophy of learning and action based on the following fundamental principles: • All work occurs in a system of interconnected processes, • Variation exists in all processes, and • Understanding and reducing variation are keys to success’.35 This definition implies that thinking is the noun, and statistical is a modifying adjective. That is, statistical thinking is not foremost about algorithms or equations, or even about data, but about how we think about a problem, and how we think about applying statistics to it. It is a philosophy, not a methodology. The word ‘work’ is to be interpreted broadly, in the sense of human activity, such as working in your garden, working on your golf game, and so on. While the second and third principles relate to acknowledging the omnipresence of variation, and understanding how to interpret and act upon data in the presence of variation, it is the first principle that we believe is key to proper understanding of the fundamentals required, but frequently missing in Big Data applications. This principle states that everything occurs in processes, and that these processes interrelate to form systems. One typically needs to understand the system to fully understand the process of current focus. For example, if we are to appropriately analyse data, we
© 2014 Wiley Periodicals, Inc.
WIREs Computational Statistics
Applying statistical thinking to ‘Big Data’ problems
need to understand the process that produced them. If we have a deeper understanding of the broader system, i.e., sound domain knowledge of this general area, we are likely to produce better analytics. We feel that these principles suggest several good practices, ‘building blocks of attacking statistical problems.’ These were listed in Figure 1. These principles have been known for some time, and have been applied by good data analysts for decades.36 Unfortunately, it appears from much of the literature cited that some Big Data enthusiasts are either not aware of these principles, or believe they are no longer important with massive data sets.33 In particular, here are four principles whose neglect has contributed to the Big Data fiascos discussed above: • Carefully considering data quality • Applying sound domain (subject matter) knowledge • Having a strategy for data analysis, and • Use of sequential approaches to problem solving
DATA QUALITY Although some Big Data practitioners mistakenly think that massive quantities of data make up for bad quality, in reality it is exactly the opposite. The sheer volume of Big Data makes quality even more important. Moreover, with large quantities the quality is harder to assess, because we are often unable to visually explore the data set, and discover unusual values. Further, these types of projects often involve diverse data sets collected in different environments. Whenever data are collected by multiple sources, the opportunity for mixing ‘apples and oranges’ is always present. The result is inconsistent data, missing values, missing variables, and high and disparate measurement variation. While applied statisticians have learned through experience that data quality is often key to success, and in practice spend much of their time evaluating it, there appears to be an unstated assumption in much of the literature, and in data competition sites such as kaggle.com, that large data sets contain high-quality data measuring the right variables at the right frequency, and are devoid of missing variables, outliers, or other data quality issues.7 Unfortunately, it is the norm, rather than the exception, that a great deal of time and effort is needed to evaluate, clean, and augment data to produce a high-quality analysis. The critical evaluation of data quality, and relevance for solving a particular problem, has been referred to as consideration of the ‘pedigree’ of the
data.37 Just as the pedigree of a thoroughbred racehorse or show dog is critical in evaluating its prospects in competition, and therefore its value, so is the pedigree of data critical to determining what can and perhaps more importantly what cannot be learned from the data. Evaluating the ‘data pedigree’ involves understanding the following: • The science, engineering, and structure of the process or product from which the data were collected. • The collection process used to obtain data and prepare for analysis. • How the obtained.
measurements
were
physically
Clear understanding of exactly where the data come from, and how they were collected, provides important insight as to the quality and suitability of the data. We argue that assessment of the data pedigree should be a standard early step in any data analysis. Keeping track of data manipulation is also a more significant challenge with massive data sets. It is common to merge data from different sources, to recode variables (from ‘male’ and ‘female’ to 0 and 1, for example), or to create transformed variables that are functions of other variables. Further, when data are migrated from server to server, or technology to technology, errors can easily be introduced to good data. This may well have been the case in a few of the Big Data blunders discussed previously. Of course, such errors can also occur with small data sets. However, it is much easier to notice and correct issues with 50 data points and 5 variables, than with a million data points and a thousand variables. Automated ‘data cleaning’ algorithms that are frequently used in Big Data applications can be especially dangerous. These algorithms typically eliminate data based on prespecified rules or through statistical calculations.11 Of course, such algorithms bring the danger of ‘throwing out the baby with the bath water’, and cannot help with such issues as measuring the wrong variables, measuring at an inappropriate frequency, or poorly measuring. As noted by Tan et al.: ‘Data mining applications are often applied to data that was collected for another purpose … For that reason, data mining cannot usually take advantage of the significant benefits of addressing quality issues at the source’.38 While some degree of automated data cleaning may be required for massive data sets, such cleaning should, in our view, be based on sound subject matter theory, rather than purely empirical methods. Published models should note the filters that were
© 2014 Wiley Periodicals, Inc.
wires.wiley.com/compstats
Advanced Review
used for full disclosure, as well as the amount of data filtered out. Further, we recommend that the data so cleaned be recorded and subsequently analyzed for trends or patterns that might indicate some fundamental flaw in the data collection process, or even inaccurate data cleaning. Missing data presents another common data quality problem. While there are statistical strategies for dealing with missing data,39 there are strong assumptions about the nature of the ‘missingness’ that may not be true in most applications, such as values being missing totally at random. Moreover, in some data sets it is unclear whether values recorded as zeros are actually zeros or represent missing values. On the other hand, some variables are structured in such a way that only ‘yes’ answers are recorded (for example, ‘Do you use the Internet everyday?’). Failure to respond may be a missing value, but more likely it should be converted to ‘No’. Beyond the blunders or outright errors that occur with data, trained statisticians are keenly aware of the limitations of observational studies, that is, from data that are passively observed, as opposed to being generated from randomized experiments. Without randomization, there is always the strong possibility of ‘lurking variables’ outside our data set being strongly correlated with variables in our data, resulting in inaccurate conclusions. Therefore, determination of cause-and-effect relationships via statistics is virtually impossible without experimental design.36 While it is difficult to quantify the additional benefit of randomized trials, this principle is well understood in scientific circles and one reason why experimental design is an expectation in order to publish research in many disciplines.2 Since many professionals come into Big Data analytics with much stronger backgrounds in algorithm development as opposed to statistical thinking fundamentals, however, this principle does not seem to be as well understood in Big Data circles. In our opinion, Anderson1 stated the majority view of practitioners in the Big Data field when he speculated that data and empirical models would replace the scientific method, which of course places a high value on experimentation.36 In summary, to properly analyze data, we must first understand the process that produced the data. While many textbooks and journal articles take the view that data are innocent until proven guilty, we believe it is more prudent to take the opposite approach, that data are guilty until proven innocent. Sophisticated algorithms unleashed on poor quality data are likely to produce similar blunders to those discussed previously. For example, the Duke genomics scandal was clearly the result of faulty data,
whether through sloppy research or outright fraud. High-pedigree data, on the other hand, will enable more of the important analytics successes noted previously. There is an obvious connection with the issue of reproducibility of research, which we mention shortly under the heading of sequential approaches.
DOMAIN KNOWLEDGE Domain or ‘subject matter’ knowledge is another principle of statistical thinking that seems undervalued in Big Data analysis. Contrary to the Anderson quote noted previously,1 we agree with Box et al. that ‘Data have no meaning in themselves; they only have meaning within the context of a conceptual model of the phenomenon under study’.40 Understanding the process that produced the data is critical to understanding data quality, but to have solid guidance on what variables and what models make sense in light of domain knowledge, we need deeper understanding. In other words, we need understanding of the system within which the data process operates. For example, we might understand how data were collected from a clinical trial, yet it would still be helpful to incorporate understanding of epidemiology and pharmacology to properly analyze the data, in order to produce actionable conclusions. Having conclusions that are actionable is a key point. By actionable, we mean that the conclusions will stand the test of scrutiny by other researchers, are consistent with existing theory, and are likely to apply reasonably well to other situations beyond the current one. For example, in nutritional research, designing an experiment based on existing domain knowledge, and determining from it that eating a particular food consistently increases blood pressure in humans, would likely be actionable. Conversely, analyzing observational data that shows correlation between that food and blood pressure would be of interest, but not likely actionable without additional evidence. In short, it is one thing to develop a model that fits a given set of data well, even if it has been carefully cross-validated by testing on sets of data not used in the modeling. However, this is still quite different from using the results of the model to intervene in the system. For the latter, we need solid understanding of cause-and-effect relationships at work.40 This level of system understanding is virtually impossible without good domain knowledge. As a trivial example of a misinterpretation, consider individuals with severe high blood pressure. They are naturally prescribed the highest dosages of medication to reduce it. A naive interpretation of the relationship between medication dosage and blood
© 2014 Wiley Periodicals, Inc.
WIREs Computational Statistics
Applying statistical thinking to ‘Big Data’ problems
pressure might conclude that the high doses are driving the highest blood pressures, and suggest that lower levels of the medication reduce blood pressure. Obviously, this conclusion would be wrong, and caused by the fact that high blood pressure results in a prescription of higher medication. However, if a physician were to use this naive model to treat a patient, the results would be catastrophic. The point is that some domain knowledge about the medical system would be required to develop actionable conclusions that go beyond fitting a given data set well. Domain knowledge can be fruitfully applied in many ways throughout the sequence of a study, including evaluation of data quality, identification of additional data needed, selection of variables and appropriate scales, selection of model form—including which variables should be considered explanatory (x) versus response (y) variables, interpretation of results, ability to extrapolate findings, and determination of logical next steps.7 Good data, good analytics, and good domain knowledge are a powerful combination!
ANALYSIS STRATEGIES Statistical thinking tells us that everything can be viewed as a process. If this is the case, then data analysis can be viewed as a process, one that can be studied and improved through application of the scientific method.41 Unfortunately, much of the literature on Big Data analytics focuses on individual algorithms and techniques, and provides little guidance as to how one should attack such a large, complex, unstructured problem.42 Somewhat typically, kaggle.com shares the results of winning models, including the type of model used, but gives no information as to how this model was developed. In our experience, the default modeling approach of naive modelers is to try as many models as possible, and see which one produces the ‘best fit’. Best fit may be determined by a measure of fit to the entire data set, via some types of cross validation, or prediction of a ‘hold-out’ set that was not included when fitting the model to the original ‘training’ data set.9 However, a key point often overlooked is that these hold-out or test data sets are often a subset of the original data, or at least collected at the same time and under the same circumstances. Going back to our discussion of domain knowledge, fitting a given set of data, even a hold-out set, does not imply that we have an actionable model that will be useful in the future, where we are likely to experience different circumstances and conditions. For actionable models, researchers need a very good understanding
of how well the data sets used for analysis represent the current and future population of interest, the potential impact of variables that were not included, the overall robustness of the model to assumptions or other modeling issues, and clarity on how the model should and should not be used going forward. Snee43 provides a more detailed discussion of broader model evaluation, including ongoing evaluation over time. Clearly, a sound strategy is required to improve our chances of developing a good, actionable model that will stand the test of time.7 This will include careful consideration of the pedigree of the data used, clarity on the purposes of the model and the population of ultimate interest, integration of domain knowledge into the modeling process, different types of model scrutiny and validation, and review over time, to name just a few. Big Data projects are typically related to large, complex, and unstructured problems. Data often come from many different sources. Several organizational groups are typically involved, each with its own agenda and its own ideas about what the problem is and how to find the solution. As a result, the problem is typically poorly defined, requiring significant work to decide what specific problem to attack and who should be on the team. Consider the problem of improving the US healthcare system. There are numerous players in this system, including doctors, hospitals, patients, insurance companies, pharmaceutical companies, and several layers of government. Each party no doubt has its own agenda and own definition of what ‘improvement’ means. Obviously, finding the best model to a given set of data will not, in itself, improve the US healthcare system. Strategy is needed. A strategy is an overall high-level approach to attacking a problem. The strategy is typically sequential in nature, a topic we discuss further below, and will often involve additional data beyond the original data collected. While no step-by-step process that will guarantee success in Big Data projects exists, having a reasonable strategy involving multiple phases is generally a good idea. Developing such strategies is the focus of the discipline of statistical engineering, which has been defined as: ‘The study of how to best utilize statistical concepts, methods, and tools, and integrate them with information technology and other relevant sciences to generate improved results’.42 Statistical engineering therefore looks at ways to take existing tools and methods from different disciplines, and integrate them into overall approaches to generate enhanced results. In the current discussion, the enhanced results desired would be models that are actionable, and therefore stand the test of time. Of course, in some cases new tools need to be developed to solve the problem, hence
© 2014 Wiley Periodicals, Inc.
wires.wiley.com/compstats
Advanced Review
Identify high impact problem
Provide structure
Understand context
Problem strategy
important, and often the ‘make or break’ phase for Six Sigma projects. It is our view that strategic thinking and in particular disciplined approaches such as this phased approach based on statistical engineering are much more likely to produce solutions to Big Data problems that go well beyond developing a model to fit a given set of data.
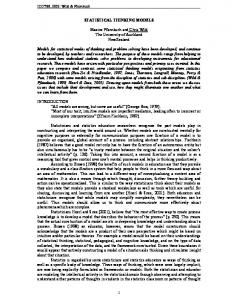
SEQUENTIAL APPROACHES
Tactics
FIGURE 2 | The phases of Big Data projects.
statistical science and statistical engineering both are required. One framework from statistical engineering that is relevant to Big Data problems is the following set of five phases,44 illustrated in Figure 2: 1. Identify high impact problems; i.e., actively seek them out, as opposed to waiting for them to come to you. There is an old saying that says: ‘Finding a good problem is more difficult than finding a good solution’. 2. Provide structure to the problem; most large, complex problems, including Big Data problems, are vaguely worded or structured, and require considerable effort to produce precise definition and specific scope, which are required to enable solution. 3. Develop understanding of the context of the problem; most big problems have a history, involving a web of science, opinion, politics, data, and so on. This step requires one to dig into this history, and develop sufficient domain knowledge to avoid naive approaches, and find reasonable approaches likely to address the underlying issues and constraints. 4. Develop a strategy; now that we have found a good problem, have provided structure to it, and developed domain and background knowledge of its context, we are ready to develop a plan of attack. This would be an overall approach to addressing it, not a selection of the correct statistical tool to apply. 5. Develop and implement tactics; the tactics are the specific steps in the strategy. Obviously, the tactics will vary considerably depending on the overall strategy. Readers familiar with the Six Sigma improvement methodology will note the similarities of phases 1 and 2 with the ‘Define’ phase from Six Sigma. It has been recognized45 that the Define phase is critically
Experience has taught us that important problems are rarely solved using a single data set or experiment.7 The Wright Brothers, Thomas Edison and, more recently, Bill Gates and Steve Jobs all achieved success after many rounds of trial and error. Fortunately, they learned with each attempt, gradually building up their understanding (domain knowledge) of the problem they were addressing, eventually leading to success. This is a key aspect of the scientific method: becoming a little smarter with each round of experimentation, gathering better and more relevant data, testing and revising hypotheses, and so on, until we eventually solve the problem. Obviously, companies such as Apple and Google never stop learning: they continue this sequential approach indefinitely, leading to continuous learning, improvement, and innovation in products and services. Unfortunately, there seems to be an implicit assumption in much of the Big Data literature that all problems can be solved with one data set and one analysis. Websites such as kaggle.com are hosting online data analysis competitions, and such competitions are now becoming more popular in academia, as part of the training of statisticians, computer scientists, and other professionals.46 A subtle but alarming phenomenon, especially as it relates to training of analytics professionals, is that such competitions reduce the original problem, which is likely large, complex, and unstructured, into more of a textbook problem. The problem becomes: ‘What is the best model I can create from this data set?’, where ‘best’ is narrowly defined according to some numerical criterion, such as root mean squared error on a hold-out data set.14 Note that some of these competitions, such as the DataFest competition at Duke, are not based on narrow algorithmic optimality, but rather how much was learned, judged by a panel of experts.46 These latter competitions, which focus on sound strategies for data analysis and problem solving, are, in our view, a valuable means of developing useful skills for participants. These are not the competitions to which we object. The use of narrow numerical criteria should be of concern in its own right, in the sense that experienced statisticians have known for some time that
© 2014 Wiley Periodicals, Inc.
WIREs Computational Statistics
Applying statistical thinking to ‘Big Data’ problems
there is no one criterion that can adequately measure the ‘goodness’ of a model.40 Minimizing a numerical criterion is noteworthy, but so are parsimony, developing a model that makes sense in light of domain knowledge, and ensuring that model assumptions are reasonably well satisfied, to name just a few. An online competition is virtually required to define a narrow, well-defined ‘goodness’ criterion, but creating the expectation in statisticians or computer scientists that a numerical criterion defines the goodness of a model is not sound training, in our opinion. It is generally understood by experienced practitioners that serious model validation requires ongoing evaluation over time, including application of the model to new data sets, collected under difference conditions and circumstances from the original data.43,47 This ensures that a model does not just fit the original training and test set of data, which are typically collected at the same time, but that it can be applied more broadly to different situations. Similarly, no empirical model remains accurate forever. As conditions change, models will need to be updated and re-evaluated to stay useful. While it is beyond the scope of the current article, inconsistency between models developed under different sets of circumstances is one reason for the currently recognized phenomenon of lack of reproducibility of research in diverse scientific disciplines.23,48,49 Fortunately, there is technology available today, such as Sweave,50 which enables traceability of statistical analyses via dynamic links within latex documents. An even more important issue is the restatement of the original problem in terms of modeling a given data set. The data set, of course, should never be the focus of our efforts—the problem we are solving should be the focus. A better question to ask with a given data set would be: ‘What can I learn from this data set that would help me collect even better data in the future so I can solve the original problem and continuously learn?’ Therefore, rather than spending an inordinate amount of time analyzing a given data set to find the absolute ‘best’ model according to a narrow numerical criterion, it is generally a wiser strategy to learn as quickly as possible which questions these data can answer and which they cannot, and then move on to further data collection. It has been noted that in practice a ‘reasonable’ analysis is typically called for, as opposed to the ‘ultimate’ analysis required in data competitions.51 Of course, preforming a reasonable analysis initially is based on having a strategy that is iterative in nature, i.e., that is based on taking a sequential approach.
One example of the power and value of sequential approaches to statistical studies is the system of clinical trials required by the Food and Drug Administration (FDA) in order to introduce new pharmaceuticals in the United States.52 One does not introduce a new pharmaceutical through one analysis, one data set, or one model. Rather, it is a sequential process, with each phase built upon the learnings of the previous. After initial testing, often in animals, phase 1 trials focus on safety in humans. Assuming positive results from phase 1, and utilizing the information discovered, phase 2 trials focus on assessing effectiveness of the drug for specific conditions. Success in phase 2 leads to even broader phase 3 trials, which consider safety and effectiveness, as well as benefit-risk assessment. While this system can certainly be improved, it is hard to imagine ever being able to effectively and efficiently accomplish the same objectives with one analysis of one data set.
CONCLUSION Big Data problems are certainly here to stay and will likely grow in the future. This is a good thing. As noted earlier, actress Angelina Jolie’s life may have been saved by modern analytics. The commercial successes of companies such as Google and Amazon, whose business strategies are largely based on the analysis of massive data sets, provide further evidence. Statisticians, computer scientists, engineers, and other professionals should be working together, combining their unique skills, to address such problems. A starting point to do so effectively is to acknowledge that the fundamentals of statistical thinking remain critically important, no matter how large the data set. Therefore, while development of efficient numerical algorithms is required to attack large problems, these algorithms must be applied within the context of a sound strategy for solving the original problem—not the problem narrowly restated within the confines of a data competition. If one understands these principles of statistical thinking, and is focused on the problem at hand, i.e., the process that produced the data, and wishes to understand and reduce variation in that process, then a model is a ‘how’ and not a ‘what’. In other words, a model is not typically the focus of our efforts, but rather a tool that can be used to help accomplish our objectives. In those data analysis competitions that focus on narrow mathematical optimality, the model is typically the ‘what’, the sole objective of the exercise. Such an emphasis naturally leads to a focus on numerical algorithms, all too often at the expense of fundamental statistical thinking principles,
© 2014 Wiley Periodicals, Inc.
wires.wiley.com/compstats
Advanced Review
such as thoughtful problem definition and scope, determination of an overall strategy for attacking the problem, understanding the context of data, incorporating domain knowledge into the analysis, and so on. Of course, good algorithms are needed, and can be extremely fruitful when used within the context of a sound strategy.
Applying the principles of statistical thinking, particularly taking the time to understand the pedigree of data, and utilizing sequential strategies for addressing large, complex unstructured problems, such as those based on the discipline of statistical engineering, will bring the realities of Big Data analytics much closer to the hype.
REFERENCES 1. Anderson C. The end of theory: the data deluge makes the scientific method obsolete. Wired Magazine, June 23, 2008. Available at: www.wired.com/science/dis coveries/magazine/16-07/pb_theory. (Accessed January 11, 2014). 2. Naik G. Analytical trend troubles scientists. Wall St J 2012, May 4:A1. 3. Vu D. Beware the Hype Over Big Data Analytics. Seeking Alpha, March 12, 2012. Available at: http:// seekingalpha.com/article/441171-beware-the-hypeover-big-data-analytics. (Accessed January 11, 2014). 4. Mayer-Schönberger V, Cukier K. Big Data: A Revolution that Will Transform How We Live, Work and Think. Boston, MA: Eamon Dolan/Houghton Mifflin Harcourt; 2013. 5. Ebbers M. 5 Things to know about big data in motion. IBM developerWorks blog, IBM, 2013. Available at: www.ibm.com/developerworks/community/blogs/ 5things/entry/5_things_to_know_about_big_data_in_ motion?lang=en. 6. Wired Magazine. The Peta-age. 2008. Available at: http://www.wired.com/images/press/pdf/petaage.pdf. (Accessed January 11, 2014). 7. Snee RD, De Veaux RD, Hoerl RW. Follow the Fundamentals: Four Data Analysis Basics Will Help You Do Big Data Projects the Right Way. Quality Progress; 2014, January: 24–28. 8. Available at: http://en.wikipedia.org/wiki/big_data. (Accessed January 11, 2014). 9. Hastie T, Tibshirani R, Friedman J. The Elements of Statistical Learning. 2nd ed. New York: Springer; 2009. 10. National Research Council. Frontiers in Massive Data Analysis. Washington, DC: The National Academies Press; 2009. 11. Tan PN, Steinbach M, Kumar V. Introduction to Data Mining. Boston, MA: Pearson Education; 2006. 12. Davenport TH, Harris JG. Competing on Analytics: The New Science of Winning. Cambridge, MA: Harvard Business Review Press; 2007. 13. Amartriain X, Basilico, J. Netflix recommendations: beyond the 5 stars, part I. Netflix Tech Blog, April 6, 2012. Available at: http://techblog.netflix.com/2012/
04/netflix-recommendations-beyond-5-stars.html. (Accessed January 3, 2014). 14. Available at: http://kaggle.com. (Accessed January 28, 2014). 15. Available at: http://www-03.ibm.com/innovation/us/ watson/. (Accessed January 4, 2014). 16. Feigelson ED, Babu GJ. Big data in astronomy. Significance 2012, 9:22–25. 17. Hesla L. Particle physics tames big data. Symmetry; Dimensions of Particle Physics, August 1, 2012. Available at: http://www.symmetrymagazine.org/article/ august-2012/particle-physics-tames-big-data. (Accessed January 4, 2014). 18. Kalil T, Zhao F. Unleashing the power of big data, White House Office of Science and Technology. Office of Science and Technology Blog, April 18, 2013. Available at: www.whitehouse.gov/blog/2013/ 04/18/unleashing-power-big-data. (Accessed January 12, 2014). 19. Available at: http://www.cnn.com/2013/05/14/showbiz/ angelina-jolie-double-mastectomy/. (Accessed January 4, 2014). 20. Cleveland WS. Data science: an action plan for expanding the technical areas of the field of statistics. Int Stat Rev 2001, 69:21–26. 21. Greenhouse JB. Statistical thinking: the bedrock of data science. The Huffington Post, July 26, 2013. http://www.huffingtonpost.com/american-statisticalassociation/statistical-thinking-the-bedrock-of-datascience_b_3651121.html. (Accessed January 11, 2014). 22. Press G. A very short history of data science. Forbe, May 28, 2013. Available at: http://www.forbes.com/ sites/gilpress/2013/05/28/a-very-short-history-of-datascience/. (Accessed January 11, 2014). 23. Baggerly KA, Coombes KR. Deriving chemosensitivity from cell lines: forensic bioinformatics and reproducible research in high-throughput biology. Ann Appl Stat 2009, 3:1309–1334. 24. Kolata G. How bright promise in cancer testing fell apart. The New York Times, July 7, 2012. Available at: http://www.nytimes.com/2011/07/08/health/research/ 08genes.html. (Accessed January 4, 2014).
© 2014 Wiley Periodicals, Inc.
WIREs Computational Statistics
Applying statistical thinking to ‘Big Data’ problems
25. Wikipedia. Lehman Brothers bankruptcy, 2011. http:// en.wikipedia.org/wiki/Bankruptcy_of_Lehman_Brothers. (Accessed January 11, 2014). 26. Hoerl RW, Snee RD. Post-financial meltdown: what do the services industries need from us now? Appl Stoch Models Bus Ind 2009, 25:509–521. 27. Lawrence PA. The Making of a Fly: The Genetics of Animal Design. Hoboken: Wiley-Blackwell; 1992. 28. Slavin K. How algorithms shape our world, TED Conference Presentation, July 21, 2011. www.ted.com/ talks/kevin_slavin_how_algorithms_shape_our_world. html. (Accessed January 11, 2014). 29. Reinhart CM, Rogoff KS. Growth in time of debt. Am Econ Rev: Pap Proceed 2010, 100:573–578.
38. Tan PN, Steinbach M, Kumar V. Introduction to Data Mining. Boston, MA: Pearson Education; 2006, 36. 39. Little RJA, Rubin DB. Statistical Analysis with Missing Data. 2nd ed. New York: Wiley Interscience; 2002. 40. Box GEP, Hunter WG, Hunter JS. Statistics for Experimenters. Hoboken, NJ: John Wiley & Sons; 1978, 291. 41. Hoerl RW, Snee RD. Statistical Thinking: Improving Business Performance. 2nd ed. Hoboken, NJ: John Wiley & Sons; 2012. 42. Hoerl RW, Snee RD. Moving the statistics profession forward to the next level. Am Stat 2010, 64:1. 43. Snee RD. Validation of regression models: methods and examples. Technometrics 1977, 19:415–428. 44. Snee RD, Hoerl RW. What’s the next big thing in quality management? Qual Manag Forum 2010, 36:3.
30. Herndon T, Ash M, Pollin R. Does high public debt consistently stifle economic growth? A critique of Reinhart and Rogoff, Working Paper Series 322, Political Commentary Research Institute, 2013. Available at: http://www.peri.umass.edu/fileadmin/pdf/working_ papers/working_papers_301-350/WP322.pdf. (Accessed February 4, 2014).
45. Snee RD, Hoerl RW. Leading Six Sigma: A Step by Step Guide Based on experience with GE and Other Six Sigma Companies. Upper Saddle River, NJ: Pearson Education; 2003.
31. Reinhart CM, Rogoff KS. Response to Herndon, Ash, and Pollin. New York Times, April 18, 2013. Available at: http://www.nytimes.com/interactive/2013/ 04/17/business/17economix-response.html. (Accessed February 4, 2014).
47. Montgomery DC, Peck EA, Vining GG. Introduction to linear regression analysis. 5th ed. Hoboken, NJ: John Wiley & Sons; 2012.
32. Fung K. The pending marriage of big data and statistics. Significance, 2013, 25. 33. De Veaux RD, Hand DJ. How to lie with bad data. Stat Sci 2005, 20:231–38. 34. Liu S. Breaking down barriers. Quality Progress, January 2014, 16–22. 35. Statistics Division of the American Society for Quality. Glossary and Tables for Statistical Quality Control. 3rd ed. Milwaukee, WI: Quality Press; 1996. 36. Box GEP, Hunter WG, Hunter JS. Statistics for Experimenters. 2nd ed. Hoboken, NJ: John Wiley and Sons; 2005. 37. Snee RD, Hoerl RW. Inquiry on pedigree – do you know the quality and origin of your data? Quality Progress, December, 2012, 66–68.
46. Available at: http://stat.duke.edu/datafest. (Accessed 1/24/2014).
48. Ince D. The problem of reproducibility. CHANCE 2012, 25:4–7. Available at: http://chance.amstat.org/ 2012/09/prob-reproducibility/. (Accessed January 28, 2014). 49. Baggerly KA. Disclose all data in publications. Nature 2010, 23:467. 50. Available at: http://www.stat.uni-muenchen.de/~leisch/ Sweave/. (Accessed 4/23/2014). 51. Hoerl RW, Hooper JH, Jacobs PJ, Lucas JM. Skills for industrial statisticians to survive and prosper in the emerging quality environment. Am Stat 1993, 47:280–291. 52. Available at: http://www.pfizer.com/research/clinical_ trials/phases_of_development. (Accessed 4/23/2014).
© 2014 Wiley Periodicals, Inc.