Applying System Dynamics to Software Quality Management - IJERMT
Recommend Documents
The plan identifying all of these activities is called software development process. ..... application development, when a project manager determines the current ...
technician, the department would likely have trouble carrying out its purpose. ⢠Systems change ... somewhat) so you can put your car back on course. ⢠Systems ...
components: virtual machine monitor (VMM), driver VM. (DVM), and privileged ..... AppVMs run the Apache web server and t
control of the LLSS developer. This makes it difficult to microreboot ...... [21] M. M. Swift, B. N. Bershad, and H. M.
the workload can then be achieved by restoring time to the value just before the ..... LVS is an open-source load-balanc
Successful software development is becoming increasingly important as software based- systems are at the core of a company`s new products. However, recent .... The first application of System Dynamics to software project management was.
Software Quality, Proceeding of the 14th Software Quality Management Conference, ... promises added business value by the creation of a new business culture [1]. CMMI ... products or services at an affordable price (value-for-money).
Software quality management is the discipline that ensures that the software we
are us- ing and .... While the underlying theory and basic principles of quality ...
Sep 29, 2015 - ijst ijst ijst. WP. PW. PC. WatC. *). (. +. = (14) where NIt is net income of agriculture sector; i is the crop index, i = 1 to n; j, irrigation system index,.
In the last 15 years, software architecture has emerged as an important field of .... refactoring, service-oriented engineering, acquisition, explicit expansion,.
Paper submitted at the 9th Transatlantic Dialogue, Baltimore, 12-15 June, 2013 ... Compstat program, adopted since the year 1994 by the New York Police Department. ...... system aiming to motivate employees, with a specific focus on precinct.
May 4, 2016 - ... of a quantitative (simulation) model, using STELLA modelling software. ... kangaroo mother care, improving neonatal resuscitation and labour ...
May 17, 2000 - Applying System Dynamics to Business: An Expense Management Example. Bill Harris. Facilitated Systems http://facilitatedsystems.com/.
Apr 1, 2015 - through the use of targets, benchmarks, and other relatively narrow ...... at http://cdn.americanprogress.org/wp-content/uploads/issues/2007/04/ ...
based embedded device called ED (Embedded Device). Satisfying the .... 2.3 Embedded Device. The device of ..... Apple's Xcode development tool [19] was used to search the ..... required, we can construct a refinement of the TLS by adding.
AbstractâA major problem in verifying the security of code is that the code's large size ... code to be verified is partitioned into three categories and only the first ...
Keywordsâ drugs safety, pharmaceutical information system, mobile apps ... The agencies responsible for regulating and ... in the research and development needed to yield effective anti-counterfeit .... From the above diagram, a user runs the appli
quantitative certification targets for all component software development processes. Approach ... Quality Assurance (QA), Configuration Management. (CM) ...
S.E.N.S.O.R. â Applying Modern Software and Data Management Practices to Climate .... services. Features such as data selection, projection, and format are typically strongly ..... that were accepted by a body of each field, but such an.
ASME B30.20 - Below the Hook Lifting Devices. • ASME BTH-1 - Design of Below
the Hook Lifting Devices. • ASME B30.10 - Hooks. • ASME B30.11 - Monorails ...
widely used in industrial and business applications, im- proving management ... inspired by Quality and PM principles and customized for needs and requisites ...
business and production (see ISO 10014:2006), from ... 9001:2008 standards in research structures have indicated ... of free contributions, aimed at collecting the largest pos- .... Quality methodologies (i.e., FMEA, DoE) to support technology transf
ISO 27001 This model was specifically designed for the certification of informa- ..... us bug-free software; thus, it is not likely that counting security flaws will ...
endorsed TQM as its management philosophy ... cipative management philosophy, and the students ... We have used this list as a checklist of sorts in our effort.
Applying System Dynamics to Software Quality Management - IJERMT
Search Engine Optimisation (SEO) and Software as a. Service (SaaS) ...... The effects of time pressure on quality in software development: An agency model.
International Journal of Emerging Research in Management &Technology ISSN: 2278-9359 (Volume-6, Issue-2)
Research Article
February 2017
Applying System Dynamics to Software Quality Management Vimla Devi Ramdoo* Dept. of IT, Charles Telfair Institute, Moka, Mauritius
Oomesh Gukhool Dept. of Computer Science & Engg., Réduit, Mauritius
Ramdoo International Journal of Emerging Research in Management &Technology ISSN: 2278-9359 (Volume-6, Issue-2) Nevertheless, the high cost factor remains a major consideration when integrating frameworks (Cater-Steel et al., 2006; Paulk, 2004). Their concepts can however be adopted in this research, examples are the configuration management from ITIL, managing human resources and quality from CobiT, causal analysis, quality assurance from CMMI and quality audits from ISO 9001, and training from CMMI (Paulk, 2004)). IV. THE SYSTEM DYNAMICS APPROACH System dynamics (SD) modelling has been used since the 90’s until recently and has proven to be beneficial in many fields. Formulated by Forrester in 1960, SD is a methodology used to analyse complex behaviours of systems and problems via computer simulation software. In 1984, Abdel-Hamid developed a simple model of the software development structure to connect the different dynamic relationships between processes. In 1996, Rodrigues and Bowers developed a SD model of the HRM cycle to analyse the effects of productivity, the number of staff working, and the work rate on project duration. Following the model of Abdel-Hamid and Madnick in 1989 and 1991, Lyneis and Ford (2007) provided a more widespread review of the literature on the applications of SD to software project management since the behaviour of parameters in the software development environment is too dynamic and complex in nature. System dynamics make use of causal loop diagrams (CLDs) as well as stock and flow modelling technique. CLDs are built with interconnected causal links forming balancing and reinforcing loops, but they have their limitations for instance their inability to capture stock and flow. Stock variables represent the state variables that are the accumulations in a system. They generate information that decisions and actions are based upon. Flow variables modify the stocks by filling or draining the latter. Stock and flow models can be used to experiment alternative scenarios by simulating different variables values in the model. Simulated outputs are produced, in graphical or tabular forms, and are comparable with the real world (Sterman, 2003). V. PROPOSED METHODOLOGY To validate and assemble the critical software project parameters that cause a direct or indirect impact on software quality, a survey questionnaire was designed which covered various areas of software quality such as responsibility of quality, parameters influencing good software quality, software testing, and propositions of quality strategies. The questionnaires were circulated in software development organisations found in Mauritius, France and Denmark, that represented a sample size of 50 people in all. The targeted people work in software organisations within the private sector and are in touch with software quality during their day-to-day activities. SPSS statistical tool was used for analysis of data. This included non-parametric tests, regression analysis and correlation analysis. These tests and analysis were used to construct the cause and effect relationships (CLDs) of the software project parameters with respect to process quality, using VENSIM. To formulate the dynamic model, the CLDs have been converted into stock and flow diagrams and their respective formulae have been derived. The aim of the model is to determine the Quality Index and help to monitor process quality for a software development project. Scenarios were used to test the model’s validity. Managerial post mortem project reports were used to gather information on the individual scenarios. The reports provided highlights on the main elements of the respective software projects. Informal interviews were carried out to gather missing details of the post mortem project reports. A total of three scenarios are gathered from a single software organisation which are web-based software projects named A, B and C as described in Table I. Using the calibrated stock and flow diagram, various recommendations have been formulated with respect to software process quality.
A B C
Table I Software Project Scenario E-Commerce web-based project Content Management System (CMS) web-based projects Search Engine Optimisation (SEO) and Software as a Service (SaaS) web-based project
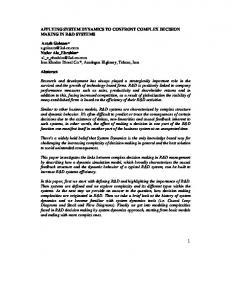
Ramdoo International Journal of Emerging Research in Management &Technology ISSN: 2278-9359 (Volume-6, Issue-2) 2) Hypothesis H2: Schedule Pressure When work remaining exceeds the scheduled time available, schedule pressure arises (Rai and Mahanty, 2001). Staffs work faster and longer hours in order to boost performance to meet the goals. When there is a rush and unrealistic goals, people tend to take shortcuts such as eliminating functionalities and sacrificing quality. These have an adverse effect that leads to rework, hence more work remaining thereby creating a vicious circle. VI. ANALYSIS OF SURVEY RESULTS The outcomes of the survey on the assessment of software project parameters impacting quality have been analysed followed by the identification of parameters, relationship and correlation among parameters using the Ishikawa concepts (1985) and causal loop diagrams. Section A of the questionnaire was on the areas of software engineering, and the majority of respondents (60%) worked on web-based projects as developers. Section B of the questionnaire was about the responsibility of people towards software quality within the organisation. One of the analysed results is shown in Fig. 1, which disclosed that most of the respondents (70%) think that software developers and testers are responsible in ensuring good quality software.
Fig. 1. Responsibility towards software quality and software testing Section C of the questionnaire were rated on a Likert scale of 1 (strongly disagree) and 5 (strongly agree). The first 10 core software project parameters are shown in order of importance with respect to quality in Table 2 by the use of statistical mean of the results obtained.
1 2 3 4 5 6 7 8 9 10
Table 2 Software Project Parameters Software Quality Factors Experience of team members Well-defined requirement specifications Software quality assurance activities Maturity of the development process Customer satisfaction Good quality of prior work deliverables The project is within schedule and there is no scope creep The project is within budget Error density of the software Complexity of the project
Mean Result 4.16 3.94 4.38 4.22 4.16 3.94 3.90 3.88 4.88 3.22
Ramdoo International Journal of Emerging Research in Management &Technology ISSN: 2278-9359 (Volume-6, Issue-2) C. Schedule and Quality The survey disclosed that most respondents believed that schedule pressure have an impact on both productivity (μ = 3.90 and σ = 0.84) and quality (μ = 4.16 and σ = 0.82). When there are errors in the prior developed tasks, they are propagated and create more errors in the software, and therefore lead to the decline in quality. 96% of respondents agreed that the quality of prior deliverables (μ = 3.74 and σ = 0.78) has an impact on the quality of current work being done. Schedule slippage has μ = 4.16 and σ = 0.82 implying that most of the respondents agreed it may cause an increase in the time remaining for development and testing activities. It should however be noted that the list of software project parameters is not exhaustive. There are more factors that impact quality that will not be considered in this research since they are considered trivial, such as more investment into testing and having a dedicated quality assurance team. The defined model boundaries used in this research are shown in Table 3. Internal parameters of the system are known as endogenous whereas those outside the system boundary as exogenous and excluded ones.
Endogenous Exogenous Excluded
Table 3 Model Boundaries Quality, Schedule, Human Resource, Cost, Scope, Rework, Productivity (labour) Requirements elicitation and documentation, Software Design, Software Maintenance Risk, Environmental factors (for example internet connection)
D. Analysis of root causes to software quality issues Though difficult to quantify, software quality is regarded as crucial to achieve in any software project for the various reasons discussed already. Since software quality issues are the main problem to be tackled, the traditional Ishikawa (1985) diagram is used as the diagnostics tool shown in Fig 2.
Ramdoo International Journal of Emerging Research in Management &Technology ISSN: 2278-9359 (Volume-6, Issue-2) Software testing is a part of the software quality assurance (SQA) process and is important to conduct for any software project. Studies have shown that extensively tested software contains 1-3 errors per 1000 lines of code (Galin, 2004), but not all software are extensively tested. Software testing has shortcomings, since in many projects it is done at the end of the software development life cycle (SDLC), where the schedule pressure is high. This often leads to inadequate testing and undiscovered errors that eventually bring a negative impact of the software quality. Moreover, other organisational factors amplify the schedule pressure such as underestimations on management behalf, absenteeism or resignations in the software project team, lack of motivation due to overtime or excessive rework. Under tight schedules, people work faster and longer to boost the output. Meanwhile, difficulties, stress and negligence incline to crop as a result of the negative impacts of schedule pressure. This in turn gives rise to errors that are injected, thereby impacting the software quality. Manpower plays a pivotal role in the software development process as software remains a human-produced product as mentioned by Trammell et al in 2016. Even with the development of several tools and techniques to automate the production of code, the requirements and design must be produced by people. So a lot of human factors are involved in software production that can give rise to software quality issues such as lack of motivation, communication issues, training shortcomings, and lack of expertise or experience. E. Cause-and-Effect Relationship The Ishikawa diagram analyses the root issues of quality issues, nevertheless it is limited since the effect of the causes cannot be shown. Cause-and-effect (or causal loop) diagrams were used to show how the software project parameters impact software quality, in conjunction with the gathered literature review, analysed surveys and interviews. F. Scope and Quality Software + Developed
Work Accomplishment Rate
Scope Creep
+
+ Project Completion
B1 Productivity +
Availability of Initial Tasks
+
Manpower Needed
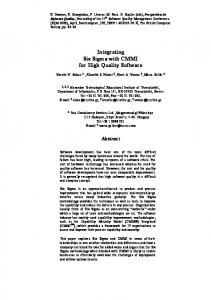
Fig. 3. Causal loop of scope Balancing Loop B1 (Fig. 3): At the start of any software project, there are an initial number of tasks to be developed. These tasks require manpower effort to reach completion, hence related to the team productivity. Work is then accomplished producing the software incrementally which is a linear relationship. Moreover the more work accomplished, more software will be produced and vice versa, hence a positive causal direction. When software is developed, the initial amount of tasks diminishes giving rise to a balancing loop. However, changes in scope can counteract the balancing effect by increasing the number of initial tasks. Software Developed
Ramdoo International Journal of Emerging Research in Management &Technology ISSN: 2278-9359 (Volume-6, Issue-2) Balancing Loop B1 (Fig. 4): It deals with the rework cycle of software development. When undetected errors in software pass through the quality assurance effort, errors are detected. This leads to rework of the error-containing tasks that eventually decreases the amount of errors in the software. Hence the amount of undetected errors is reduced producing the balancing loop behaviour. G. Human Resource and Quality
Software Developed -
New Staffs + -
Experienced Staffs
+ Errors Density
Rework +
R1
-
Quality
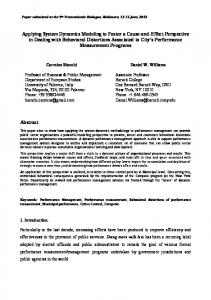
Fig. 5. Causal loop of human resource Reinforcing Loop R1 (Fig. 5): The presence of more new staffs in a team compared to the number of experienced staffs increases the error density in the software. This is due to the fact that new staffs are more error prone than experienced staffs. Introduction of more errors in the software degrades its quality that implies a greater amount of rework that is needed. This in turn decrease the amount of software developed since effort is allocated in rework more than in development of the software giving rise to a reinforcing loop as more software developed will contain more errors as well. +Staff Leaving R1 Excess Staff +
Ramdoo International Journal of Emerging Research in Management &Technology ISSN: 2278-9359 (Volume-6, Issue-2) H. Schedule/Time and Quality Productivity + B1 Schedule Completion Time
+
Schedule Pressure
+ R1
Software Developed -
Quality
Rework +
Errors
Fig. 7. Causal loop of schedule Reinforcing Loop R1 (Fig. 7): It focuses on the schedule pressure and error rate. With increased schedule pressures the workforce will work harder to catch up. However, in a situation with pressure and stress the tendency to make mistakes increase as well, thus quality is affected. This relationship of schedule pressure with quality shows negative relationship. When programmers are tired, stressed or close to deadlines prompt decisions are required, which may lead to more error. With the added production rate they also produce more tasks per hour and may generate more errors per hour as a consequence. With an increase in the errors made the need for rework increases. The rework process is a process where faulty code has to be rewritten. People work harder and faster but not smarter. The result is a loop where more errors and rework leads to less software development that in turn leads to less progress and forecasts behind schedule. This will in turn lead to more schedule pressure and subsequently more errors committed. Balancing Loop B1 (Fig. 7): It discloses the effect of added schedule pressure on productivity. When the progress reports and the forecasts indicate a project running behind schedule, the initial schedule pressure provides an increase in productivity. When production falls behind schedule, research shows that workers tend to cut their slack time, and devote more concentration to the work at hand. Staffs increase their man-hours in order to bring the project back on schedule. This effect increases the actual productivity as staffs work harder during working hours in order to close the time-gap. This in turn leads to an increase in productivity that provides new progress estimates. The increase in productivity provides a forecast within schedule and schedule pressure subsequently decreases. VII. DYNAMIC MODELLING The final model (Appendix I) consists of core stock and flow sub-systems that are the quality subsystem, basic software development and task implementation, project completion toggle, rework cycle, human resource allocation, schedule estimation, schedule pressure, productivity and cost estimation. A. Quality Sub-system Figure 8 depicts that quality primarily affects the rate of task implementation and error generation. When quality is low, more errors are generated per tasks developed giving rise to rework. Rework requires more time and effort that might possibly lead to schedule slippage and cost overruns. Quality has a significant impact on the project’s overall progress and it is crucial to know the factors that determine the quality index.
Ramdoo International Journal of Emerging Research in Management &Technology ISSN: 2278-9359 (Volume-6, Issue-2)
Fig. 9. Parameters that impacts the quality index The relationship of the parameters with the quality index is described in Table 4. Table 4 Parameters Affecting The Quality Index Benchmarked quality index
The software organisation sets an initial benchmarked quality level with no other parameters influencing quality. It is derived from the quality assurance thoroughness and is modifiable during simulation for the proper calibration of the model.
Impact of uncertainties on quality index
Uncertainties impact the quality level since it allows for the generation of more errors in the software developed for instance uncertainty in requirements. The equation is driven by the elimination of uncertainties based on the project’s fraction believed to be complete. As more work is accomplished, the more it gets validated by management and in certain cases by the customer, hence reducing the uncertainty factor.
Impact of schedule pressure on quality index
Schedule pressure affects quality adversely. When staffs work faster, they also make more mistakes in a “Haste makes Waste” effort.
Impact of prior deliverables quality on quality index
It represents the fact that undiscovered errors in previous tasks have a cascading impact on the current work deliverables. It implies that higher quality of prior deliverables increase the current quality level of the software.
Impact of staff experience on quality index
Since inexperienced staffs are more error prone than experienced staff, the experience dilution cause an impact on the quality of the software under development.
Complexity factor
It is used to capture the complexity level of the project. For instance, a project with many modules and user interfaces include built-in complexity resulting in rework for numerous reasons such as misunderstanding requirements, interface changes and module amendments.
Development process factor
It is used to capture the maturity level of the development process. A high value reflects a mature and rigorous development process and vice versa.
Technology maturity factor
It refers to the experience the development organisation has on the technology applied to the project where a high value reflects matured technologies.
Ramdoo International Journal of Emerging Research in Management &Technology ISSN: 2278-9359 (Volume-6, Issue-2) B. Project tasks implementation and Rework cycle Referring to the causal loop in Fig. 4, the development of software is governed by the rate at which the project’s tasks are implemented by the developers. Similarly when tasks are developed, it is not necessarily correct as it may contain errors that are undetected. The tasks go through testing where the errors are discovered, and eventually lead to rework, hence more work to do. Fig. 10 shows the stock and flow relationship that is inspired from the work of Abdel-Hamid and Madnick (1989, 1991).
Fig. 10. Stock and flow of software development and rework C. Staffing Sub-system Project tasks are developed by human resource, the staffing sub-system is crucial in the model. People have a tendency to think that increasing the number of staffs on a delayed project will help gain time on the project. Brook’s (1982) Law states otherwise: “adding more staff to a late project will make it finish later”. Newly hired staff requires training and take time to gain experience thereby influencing the workforce productivity. This relationship is shown in Fig. 11.
Ramdoo International Journal of Emerging Research in Management &Technology ISSN: 2278-9359 (Volume-6, Issue-2) Table 5 Calibration of model from scenarios A, B and C Simulated Expected Average MoE MoE Value Value per scenario Staff allocation 3 3 0.00 Project completion 14.8125 14.5 2.16 1.09 % Number of rework tasks 37.4899 37 1.32 Effort expended 42.3719 42 0.89 Staff allocation 7 7 0.00 Project completion 5.6875 5.5 3.41 2.46 % Number of rework tasks 4.89712 5 2.06 Effort expended 26.094 25 4.38 Staff allocation 3 3 0.00 Project completion 14.1875 14 1.34 1.07 % Number of rework tasks 65.1394 65 0.21 Effort expended 41.0873 40 2.72 Average MoE for all scenarios A, B and C 1.54 %
Scenario B has the highest margin of error (MoE) of 2.46 % compared to scenario A and C that have a MoE of 1.09% and 1.07% respectively. Considering all the scenarios, the model has an overall MoE of 1.54% that produces a relatively low discrepancy as compared to the original data. Furthermore, the lower the margin of error, the closer is the simulated results to the original values. IX. MODEL VERIFICATION AND VALIDATION The structure in the dynamics model should be able to withstand certain extreme conditions that can occur in the real world. For example, if staffing level is set to zero, the productivity rate should fall to zero leading to stagnation in the task implementation rate. Robustness test is very effective to discover flaws in the model structure thus validating its usefulness. For example Fig.12 shows the effect of a zero staff level on a project in terms of task to do, tasks done and undiscovered rework. This depicts there were no stocks neither variable that had a negative depletion. Therefore the dynamic model had passed through extreme condition testing.
Ramdoo International Journal of Emerging Research in Management &Technology ISSN: 2278-9359 (Volume-6, Issue-2) An average QI will produce an above average of customer satisfaction. Similarly a high QI will lead to very satisfied customer and vice versa. This implies that the CSI is directly proportional to the QI deviation thereby validating the QI derived. The simulated QI and quality level per scenario are shown in Table 7. Table 7 Parameters Affecting The Quality Index Equivalent QI Quality Index Quality Level Percentage 0.87 87 % Scenario A Average 0.94 94 % Scenario B High 0.74 75 % Scenario C Low A high QI indicate high quality in the software developed and vice versa. Since QI directly affect the rate of error generation, a high QI will generate the least amount of errors. Moreover as QI also impact the implementation rate; it will have a significant positive impact on the project’s overall progress. Therefore a high QI will eventually be more cost effective as schedule will not be slipped; neither will the scope be exceeded due to rework. Human resources will not endure schedule pressure and lose motivation as is the case with excessive rework. These analogies can be applied on other projects of similar types. Simulation will allow proper decision making during the software development process. The aim is to attain the highest possible level of quality in the software produced. Since only three software project simulations were done, the QI deviations are quite limited. X. RESULTS AND DISCUSSION Following the simulations made on the 3 scenarios, the proposed hypotheses were tested to eventually derive any logical recommendation. To test H1, a hypothetical software project was considered with an initial team size of 6 experienced staffs and 100 tasks to be developed. The project was assumed to have a normal productivity of 4 tasks per person per month. The initial schedule estimation is 24 months. To test H2, the simulations of scenarios A, B and C were considered since they had different levels of schedule pressure. A. Hypothesis H1: Staff Experience To test the staff experience, 4 different possibilities of staff mix were simulated on a pool of 6 staffs. The percentage mix was 75/25, 50/50 and 25/75 of experienced staff to inexperienced (or new) staff ratios as explained in Table 8. Using 100% of inexperienced staffs in a software project are unrealistic, therefore were not considered in the simulation.
Ratio 72/25 50/50 25/75 100
Table 8 Experienced To Inexperienced Staff Mix Number of Percent of Number of experienced staffs experience inexperienced staffs (used for ratio) d staffs (used for ratio) 1.5 75 % 4.5 3 50 % 3 4.5 25 % 1.5 6 100 % 0
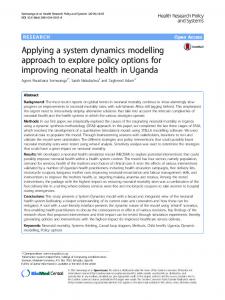
It can be interpreted from Fig. 13 that an increase in inexperienced staff in the team increases the amount of errors generated in the developed tasks thus in line with the fact that inexperienced staff are more error prone than experienced staffs. 100% of experienced staffs in a team are the best case scenario as shown by line 1 on the graph since it generates the least amount of rework. Dilution of the staff experience increases the number errors generated, shown by the lines labelled 2, 3 and 4 with respect to the percentage of staff ratio of experienced and inexperienced staffs. It is important to note that errors that are not discovered are termed as undiscovered rework. More the undiscovered rework, more will the cumulative tasks done with respect to the staff experience as shown in Fig. 14.
Ramdoo International Journal of Emerging Research in Management &Technology ISSN: 2278-9359 (Volume-6, Issue-2) A ratio of 25% experienced staff to 75% inexperienced is shown by line 4 in Fig. 13 and is likely to produce software with many errors. The detected errors (discovered rework) will be corrected and delivered for testing creating a vicious circle between development and testing phases. This is because more errors will be detected and sent back again for correction and so on. This vicious circle increases the cumulative tasks done drastically as shown by line 4 on the Fig. 14.
Fig. 14. Cumulative tasks done v/s Experience mix When there are more errors generated in the developed tasks, this will cause fluctuations in the quality level of the software developed. It should also be noted that not all errors are discovered and corrected. Some errors may remain in the software and get delivered to the customer that might later turn into organisational losses as discussed in the introduction. Figure 15 shows that the staff experience impacts the level of quality significantly. The best case for this project is shown by line 1 where there were 100% experienced staffs within the team. The more the experienced staffs are diluted by increasing the number of inexperienced staffs on the team, the quality level falls, as shown by lines 2 and 3 where the experience ratio was 75-25 and 50-50 percent mix of experienced staff and new staff. With respect to the vicious circle discussed previously, line 4 shows that quality is likely to fall even more compared to other situations since there is a lack of experience in the team. Line 4 indicates that probability of error identified will still be high due to low quality, even if the software has already been delivered to the customer.
Ramdoo International Journal of Emerging Research in Management &Technology ISSN: 2278-9359 (Volume-6, Issue-2)
Fig. 16. Project completion v/s Experience mix Although the best case scenario is explicitly the one with 100% of experienced staffs on a team, it is not always possible to allocate only experienced staffs in real life situations. The 75-25 experienced to inexperienced staffs mix however is more practical and a good practice too, since the project ends in the expected schedule of 24 months as shown by line 2. Moreover, the effort of new staff members in a team will also reduce the project’s cost since experienced staffs are more costly compared to new staffs in term of salaries. With such simulations in hand, the software project manager will be in a better position to allocate the right proportion of experienced and inexperienced staffs on his/her software development team. B. Hypothesis H2: Schedule Pressure In an environment of schedule pressure, staffs work faster and longer hours in order to boost their performance in order to meet the initially set goals. However, when there are rush and unrealistic goals, people tend to take shortcuts such as eliminating functionalities and sacrificing quality. These have an adverse effect leading to more rework and increases the workload as a consequence. Scenarios A, B and C had different levels of schedule pressure; hence their simulations are used for comparison as shown in Fig. 17. Scenario B did not experience any kind of schedule pressure since the project ended half a month before the estimated schedule shown by the flat line 2. Scenarios A and C however show respective overshooting and collapsing behaviours when the projects were near to their scheduled deadline. Nevertheless the schedule pressure exerted by Scenario C (line 3) was much higher than that of Scenario A (line 1). This was mainly because of a lack of staffs and a more than expected increase in the amount of rework in Scenario C compared to B.
Ramdoo International Journal of Emerging Research in Management &Technology ISSN: 2278-9359 (Volume-6, Issue-2) Brooks J.R.F.P., 1982. The Mythical Man-Month. Addison-Wesley, Boston, USA. Casson D., 2005. An in-depth analysis of the current state and readiness of IT organisations to adopt ITIL-based processes. North American ITIL Assessment, Evergreen Systems. Cater-Steel A., Wui-Gee T., Toleman M., 2006. Challenge of adopting multiple process improvement frameworks. Proceedings of 14th European conference on information systems. Chakravorty S.S., 2010. Where process-improvement projects go wrong. Wall Street Journal - Eastern Edition 255.19. Charette R.N., 2005. Why software fails. IEEE spectrum. 42. Deloitte, 2003. IT Governance Practices in the Irish Public Sector. Dublin. Devedzic V., 2001. Software Project Management. Handbook of Software Engineering and Knowledge Engineering 2, 419-446. Forrester J.W., 1961. Industrial Dynamics. MIT Press. Cambridge. Massachusetts. Gerke L., Ridley G., 2006. Towards an abbreviated COBIT framework for use in an Australian State Public Sector. Proceedings of the 17th Australasian Conference on information Systems. Galin D., 2004. Software quality assurance: from theory to implementation. Addison-Wesley. Hochstein A., Tamm G., Brenner W., 2005. Service-Oriented IT Management: Benefit, Cost and Success Factors. Paper presented at the European Conference on Information Systems, Regensburg. Germany. Ishikawa K., 1985. What is total quality control?: the Japanese way. Englewood Cliffs, NJ: Prentice-Hall. Kathy S., 2010. Information Technology: Project Management. Course Technology Press. Boston, US. Land S.K., Mcgroddy J.C., Moore J.W., 2005. Learning from Software Failure. Neumann P.G., Spix G., Weyuker E.J. Lindstrom L., Jeffries R., 2004. Extreme Programming and Agile Software Development Methodologies. Information Systems Management 21(3): 41-60. Lyneis J.M., Ford D.N., 2007. System dynamics applied to project management: a survey, assessment, and directions for future research. System Dynamics Review 23(2-3); 157-189. Meso P., Jain R., 2006. Agile Software Development: Adaptive Systems Principles and Best Practices. Information Systems Management 23(3): 19-39. Molokken-Ostvold K., Jorgensen M., 2005. A Comparison of Software Project Overruns-Flexible versus Sequential Development Models. IEEE Transactions on Software Engineering 31(9): 754-766. Paulk M.C., 2004. Surviving the quagmire of process models, integrated models, and standards. In: Annual Quality Congress Proceedings, Toronto, 429-438. Potgeiter B.C., Botha J.H., Lew C., 2005. Evidence that use of the ITIL framework is effective. Paper presented at the 18th Annual Conference of the National Advisory Committee on Computing Qualifications, Tauranga, NZ. Rai V.K., Mahanty B., 2001. Dynamics of Schedule Pressure in Software Projects. The Proceedings of the 20th International Conference of the System Dynamics Society, Palermo, Italy. Rose K., 2005. Project quality management: why, what and how. J Ross Pub. USA. Sterman J.D., 2003. Business Dynamics: Systems Thinking and Modeling for a Complex World. Irwin/McGrawHill, Chicago, USA. Vidal H., Wan J., Han X., 1998. Capability Models: ISO and CMM. Kansas: Department of Computing and Information Sciences, Kansas State University. Trammell, M.., Allen, M., and Stuart E. Madnick, 2016. Effects of Funding Fluctuations on Software Development: A System Dynamics Analysis. Engineering Management Journal 28.2: 71-85. Wiegers K.E., 2009. Software requirements. Microsoft press.
Ramdoo International Journal of Emerging Research in Management &Technology ISSN: 2278-9359 (Volume-6, Issue-2) APPENDIX 1 Final System Dynamics Model Initial Schedule Estimate for Completion
Managerial Willingness to Slip Schedule
Change in Schedule Schedule Slippage
Table for Schedule Slippage
Relative Quality of Inexperienced Staff
Sensitivity for Impact of Prior deliverables on Quality Index