2003 Joint Statistical Meetings - Section on Survey Research Methods
APPLYING THE DELETE-A-GROUP JACKKNIFE VARIANCE ESTIMATOR TO ANALYSES OF DATA FROM A COMPLEX LONGITUDINAL SURVEY Julia L. Bienias,1 Phillip S. Kott,2 and Denis A. Evans1 Rush Institute for Healthy Aging and Department of Internal Medicine, Rush University Medical Center, Chicago, IL, 2 National Agricultural Statistics Service, United States Department of Agriculture, Washington, DC. Julia L. Bienias, Rush Inst. for Healthy Aging, 1645 W. Jackson Blvd., Suite 675, Chicago, IL 60612
[email protected] 1
data on all the individuals in the study is cost-prohibitive. In such studies, the estimands of interest are typically regression parameters or other estimates of association, rather than means or totals. Complex sampling plans are used in this context to guarantee the inclusion of certain subgroups of the population under study or to optimize the design with respect to known or suspected predictive variables of interest. Inference under complex sampling plans can either model-based (as in Valliant, Dorfman, & Royall, 2000) or design-based (as in Wolter, 1985). When the estimands of interest are model parameters, using design-based techniques can often produce inferences robust to certain types of model failure. See, for example, Skinner (1989). Given observations from a stratified multi-stage sample with small first-stage selection probabilities, the conventional stratified jackknife can be used to measure the model variance and the randomization mean squared error of estimated parameters simultaneously. In this paper, we discuss a different variant of the jackknife, which has practical advantages over the stratified jackknife. We describe an application of the delete-a-group (D-a-G) jackknife variance estimator to a longitudinal study with multiple levels of sampling. Specifically, our application is to the Chicago Health and Aging Project (CHAP), a community-based longitudinal study examining risk factors for chronic health problems of older adults. A major aim of the study is the investigation of risk factors for incident Alzheimer’s disease. The current design of CHAP has two components: (1) Every three years, all surviving members of the target population are interviewed on a variety of health-related topics; these interviews include cognitive and physical function measures; and (2) At each of these waves of data collection, a stratified Poisson sample is drawn from among the respondents to the full population interview for detailed clinical evaluation and neuropsychological testing. To investigate risk factors for
KEY WORDS: Complex surveys, Poisson sampling, Finite-population inference, Model Abstract The delete-a-group jackknife variance estimator is proving a very useful tool for measuring variances under complex sampling designs. This technique divides the first-phase sample into mutually exclusive and nearly equal variance groups, deletes one group at a time to create a set of replicates, and makes similar weighting adjustments in each replicate to those done for the sample as a whole. Variance estimation proceeds in the standard (unstratified) jackknife fashion. We apply this method to a complex multi-wave longitudinal study, the Chicago Health and Aging Project (CHAP). CHAP is a community-based study examining risk factors for chronic health problems of older adults, with a particular focus on risk factors for incident Alzheimer’s disease. Every three years, all surviving members of the cohort are interviewed on a variety of health-related topics, including cognitive and physical function measures. From among the respondents to this interview, a stratified Poisson sample is drawn for detailed clinical evaluation and neuropsychological testing. To investigate risk factors for incident disease, a “diseasefree” cohort is identified at the preceding time point and forms one major stratum in the sampling frame. We demonstrate the utility of the variance estimator for modelling risk factors for incident disease with logistic regression and discuss the issue of determining the “right number” of variance groups. 1. INTRODUCTION Complex sampling designs present particular challenges to variance estimation. In social, economic, and health research, samples of individuals are typically taken for more detailed follow-up when the cost of collecting such
Support for this work was provided by a grant from the National Institute on Aging, RO1 AG11101. The views expressed in this article are those of the authors and do not necessarily reflect those of the U. S. National Agricultural Statistics Service. The authors thank Ann Marie Lane for community development and oversight of the CHAP project coordination; Michelle Bos, Holly Hadden, Flavio LaMorticella, and Jennifer Tarpey for coordination of the CHAP study; and Todd Beck and Woojeong Bang for assistance with data analysis.
539
2003 Joint Statistical Meetings - Section on Survey Research Methods
(Morgan Park, Beverly, and Washington Heights). Because Chicago has historically been racially segregated, these neighborhoods were chosen to include near-equal numbers of blacks and whites across all three neighborhoods (a small percentage of persons were of other races) and because the neighborhoods are economically diverse. Study staff first conducted a doorto-door census to create a list frame of all eligible residents. Those 65 and older were invited to participate (7826 persons), and 78.7% of them (N=6158) took part in the baseline interview. The basic design is a panel, or cohort, design, with all participants being interviewed in their homes approximately every three years. This population interview includes questions about health history, current health problems, participation in social and cognitive activities, physical activity and physical function, as well as direct measures of cognitive performance, and, at the baseline interview, questions about work history and childhood experiences. CHAP has currently completed its third full wave of data collection. In addition, from each wave of population interviews, a stratified random sample is drawn, and persons selected are asked to undergo a detailed clinical evaluation, which includes neuropsychological testing and examination by a neurologist. Examinations for incident Alzheimer’s disease were structured and uniform, with examiners blinded to population interview cognitive testing results and sampling stratum. Uniform criteria for the ascertainment of dementia and Alzheimer’s disease were applied. The sample taken from the baseline population interview sample constituted a prevalence sample for the estimation of prevalent rates of disease. At the second and third waves, a sample was taken from a subset of persons determined to be free of Alzheimer’s disease at the previous wave. It is these two incidence samples on which we will focus in this paper.
incident disease, a “disease-free” cohort is identified at the preceding time point and forms one major stratum in the sampling frame. We describe the application of the deletea-group jackknife variance estimator to the modelling of risk factors for incident Alzheimer’s disease through logistic regression. 2. THE CHICAGO HEALTH AND AGING PROJECT (CHAP) 2.1 The Goals of the Chicago Health and Aging Project The Chicago Health and Aging Project (CHAP) is a longitudinal community-based study of older adults. It focuses on characterizing risk factors for common chronic diseases of older age, with a particular emphasis on Alzheimer’s disease. First identified in the early twentieth century by Dr. Alois Alzheimer (Alzheimer, 1907), dementia of the Alzheimer’s type is a particularly debilitating progressive neurodegenerative disorder, characterized by declines in memory and other cognitive processes. It currently has no known cause and no cure, although some partial symptomatic treatments exist. Because of its long-term nature and the changing age structure of the population in the U.S. and other industrialized countries, it is projected that the cost of treatment and care for those with Alzheimer’s disease will place increasingly high demands on the health-care system (Hebert, Scherr, Bienias, Bennett, & Evans, 2003). To date the CHAP study has helped provide answers to the impact of the apolipoprotein E allele on incident Alzheimer’s disease in biracial populations (Evans et al., 2003), the relation of cognitive activities to prevalent and incident disease (Wilson et al., 1999; Wilson et al., 2002) and to change in cognitive function over time (Wilson, Bennett, Bienias, Mendes de Leon, Morris, & Evans, 2003), the association of intake of Vitamin E and other antioxidant nutrients to risk of Alzheimer’s disease (Morris et al., 2002a) and to decline in cognitive functioning (Morris, Evans, Bienias, Tangney, & Wilson, 2002b), the relation between dietary fat intake and incident disease (Morris et al., 2003), the relation between early life experiences and later life cognitive performance (EversonRose, Mendes de Leon, Bienias, Wilson, & Evans, in press), and between current depressive symptoms and cognitive decline (Wilson, Mendes de Leon, Bennett, Bienias, & Evans, in press), and cross-sectional understanding of perceived discrimination and its relation to depressive symptoms (Barnes et al., in press).
2.3 Definition of the “Disease-Free” Cohorts The sampling frame for the stratified clinical evaluation sample drawn at the second wave was based on a cohort of persons free of Alzheimer’s disease identified at the first wave. These persons were identified in one of two ways: (1) They either scored well on a set of cognitive function tests given to everyone at the population interview, or (2) They were selected for clinical evaluation and were found to be free of disease. Then, from this synthetic cohort, a sample stratified by age, sex, race (black/non-black), and change in cognitive performance from the preceding wave (stable or improved, small decline, large decline) was chosen. Within strata, Poisson sampling, sometimes also called “independent Bernoulli” sampling, was used to select units. The advantage of this approach of defining a disease-
2.2 Overview of the Design The target population for CHAP is all persons 65 years of age or over living in three geographically defined neighborhoods on the south side of Chicago, Illinois
540
2003 Joint Statistical Meetings - Section on Survey Research Methods
free cohort is that it gives everyone - including those who do not score well on the cognitive function tests - a chance of selection into the sample. This avoids biases associated with screening tests. Such biases arise when the screening examination is associated with risk factors of interest or important covariates. In studies of Alzheimer’s disease, cognitive function test results are, in fact, frequently related to important variables such as education and race. Because of concerns about the shrinkage of the sample over time due to morbidity and mortality, CHAP added a unique design feature in its third wave of data collection: A second incidence sample drawn for evaluation of incident disease at the third wave, from among members of a new disease-free cohort defined at the second wave of population interviewing. The definition of “disease-free” proceeds as at baseline. This allows for more efficient use of the study population and more power for analyses. The original CHAP design described above has been expanded to allow the entry of successive age cohorts of persons in the community as they attain 65 years of age, with the general design being repeated for these new participants. The entire design is described in more detail in Bienias, Beckett, Bennett, Wilson, & Evans (2003), including the discussion of additional features not described here.
3.2 Poisson Sampling vs. Standard Stratified Random Sampling With a stratified simple random sample, the probability of choosing one unit in a stratum for the sample affects the probability of choosing a second sample unit from the stratum. For example, suppose a stratum has 100 units, and we wish to select 10 units for the sample . The probability of choosing stratum-member A for the sample, P(A), is 1/10. The probability of choosing A given that stratum-member B has already been selected, P(A|B), is 9/99 = 1/11, which is slightly less than 1/10. Thus, the selection mechanisms for the two units are not independent. With Poisson sampling, a selection probability is applied to a population unit regardless of what has happened before in the sampling process. Mathematically, P(A|B) = P(A). The tradeoff is that when there are 100 units in a stratum each with selection probability 1/10, there is no guarantee that exactly 10 units will be in the sample, although that is what we expect “on average.” The key point with respect to the variance estimation is that because of this feature, the “strata” are actually irrelevant: All they do is give us a way of keeping track of how we assigned probabilities of selection to individual units. In reality, every unit’s selection is independent of every other unit’s selection, across strata or within.
3. THE DELETE-A-GROUP JACKKNIFE VARIANCE ESTIMATOR
3.3 The Delete-a-Group Jackknife Variance Estimator 3.1 General Formulation for Replicate-Based Variance Estimation
In the setting of Poisson sampling, we could drop a single unit to define each replicate, but in practice that would most likely be unmanageable. We wish to mimic the design in defining each replicate, and the unique feature of the design is the probabilities of selection. Hence, we will create a series of replicates that each include some people with (approximately) all levels of probabilities of selection. To do this, we can order the units by the probabilities of selection associated with them (or, equivalently, by the sampling weights), and then step through the list systematically to define a set of groups. A given replicate would then be defined by dropping one group from the sample. This is the general idea for the delete-a-group jackknife method that can be applied to Poisson sampling: Group the data in a reasonable manner and then delete one group at a time; the complement of the deleted group forms one replicate. Then, variance estimation proceeds in a standard manner: Estimate the quantities of interest based on each replicate, and compute the variance across those estimates to obtain an estimate of the full-sample variance. Kott (1998a; 1998b) describe the method; Appendix D of Kott (1998a) gives a proof for such an application. In Equation (1), c is (G-1)/G, where G is the number of groups defined. The degrees of freedom for a univariate
The goal of replication methods to replicate the design in a series of subsamples that will be used to reflect to overall sample. Each of these subsamples, or replicates, retain all of the design features of the original design. The variance of the estimates from this series of subsamples is used to estimate the variance of the estimator of interest. The general form of the replicate estimator is:
vˆ(θˆ ) = c ∑Gk =1 (θˆ k- θˆ ) 2 , where
(1)
Gnumber of replicates cconstant that depends on replication method
2estimate from given replicate or from whole sample. In jackknife repeated replication, the general idea is “delete ‘one,’ re-weight the rest, estimate, repeat for the next unit,” (recall "jackknife residuals" in regression), where “one” depends on the details of the design (Wolter, 1985; Lee, Forthofer, & Lorimor, 1989).
541
2003 Joint Statistical Meetings - Section on Survey Research Methods
considering 100 groups, which was similar to the number of strata in the first incidence sample. Our sample size for the combined analysis was 1134, and the final probabilities of selection for the units (taking into account both the first and second sampling operations) ranged between approximately 0.05 and 1.0, with an average value of 0.65. We began by examining a simple model of interest, relating the incidence of disease to the age of the person at the start of the observation period, as age is the single largest predictor of incident Alzheimer’s disease known at our current state of science. Additionally, we wish to control for the amount of time elapsed between the start of the observation period for a given person and the time at which the outcome, incident disease, is ascertained (the “time on study”), because the longer the observation period, the higher the likelihood of observing the outcome, all other things being equal. Thus we modelled:
statistical test is G-1. The method has proven useful in surveys using Poisson sampling (Kott, 1998a; Kott, 1998b; Kott and Bailey, 2000) as well as in examination of survey nonresponse (Kott & Bellow, 1999). There is a potential problem with the delete-a-group jackknife described above when estimating finite population parameters: It ignores the impact on variance of large first-phase sampling fractions. When estimating model parameters, however, this is not an issue because the real goal is not to draw inference about the target population, per se, but an infinitely large conceptual population from which the target population is itself a random sample (Fuller, 1975). 4. APPLICATION TO CHAP 4.1 Comparison with the Stratified Jackknife
E[ logit(Pr(Alzheimer’s disease)) ] = $0 + $1time on study + $2 age.
In analyses conducted using data from the first incidence sample, variance estimates were computed using a conventional stratified jackknife under a two-PSUs-perstratum design (e.g., Wolter, 1985). Because the first CHAP incidence sample was effectively a stratified random sample, we first created pseudo-PSUs, or “standard error computation units” (SECUs), by randomly splitting each stratum sample into two. We then defined each replicate by stepping through the strata, dropping one of the two SECUs and reweighting the other. We then fit models for linear and logistic regression and mixed models with random effects in SAS® (SAS, 2000), and estimated the variances with SAS using custom software we wrote (Bienias, 2001). Under mild assumptions, this approach will yield asymptotically unbiased variance estimates. As a first step in examining the utility of the delete-agroup (D-a-G) jackknife variance estimation for CHAP, we re-estimated some key logistic regression models from the analyses of the first incidence sample using 100 D-a-G groups, as the sample had 91 original strata. Our variance estimates were nearly identical.
(2)
Figure 1 shows the replicate estimates for the “time on study” variable for this simple model (2) relating the odds of incident Alzheimer’s disease to observation time and age. The horizontal reference line is drawn at the estimate obtained from the full sample, which was 0.00070918. In practice with our data, we have not found time-on-study to be a significant predictor, and this is true here as well. As can be seen in the figure, the estimates are fairly stable with 100 groups. The standard error for the time-on-study parameter estimate was 0.1401. Figure 1. Parameter Estimates from each Replicate for the “Time on Study” Parameter. Reference Line is the Estimate from the Full Sample.
4.2 How to Choose the Optimal Number of Variance Groups In the surveys conducted by the U. S. National Agricultural Statistics Service (NASS) (see Kott, 1998a), 15 D-a-G groups were used, yielding 15 replicates and 14 degrees of freedom for univariate statistical tests. This is reasonable given the focus of NASS surveys on estimating means and totals. In CHAP, we wish to estimate coefficients in complex models, sometimes one at a time, but sometimes as a group. We may want to conduct an F test for an entire logistic regression model with 15 predictors. For this, 15 groups are clearly inadequate (see Korn and Graubard, 1990). Instead, we started by
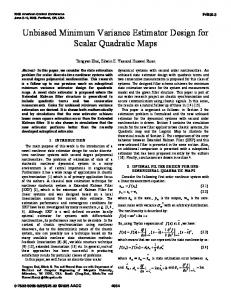
Next, we fit the model in equation (2) multiple times, each time estimating the variance using the delete-a-group jackknife with a different number of groups. Recall there is a one-to-one association between the number of variance groups and the number of replicates formed for variance estimation, as for each replicate we delete one group from the sample. Figure 2 shows the standard error estimates
542
2003 Joint Statistical Meetings - Section on Survey Research Methods
seemingly have been avoided by recomputing first-phase sampling weights conditioned on the realized sample sizes (i.e., if nh first-phase sample observations were selected from stratum h with Nh population units, then the firstphase weight of each sample observation would be recomputed as Nh/nh). Korn and Graubard (1998) effectively argue against doing doing this, showing that standard practice ignores a potential component of variance.
for the estimate of the coefficient measuring the impact of age at the start of the study. As we might expect, the standard error estimates are more stable as the number of groups increases. Note, however, these results are only for a single sample.
Figure 2. Standard Error Estimates Based on Different Numbers of Variance Groups. Lines Added to Clarify Trend over Replicates.
6. REFERENCES Alzheimer, A. (1907). Uber eine eigenartige Erkrankung der Hirnrinde. Allg. Z. Psychiatr. Psych. Gerichtl. Med., 64, 146-148; translated by Jarvik, L., and Greenson, H., 1987, Alzheimer Disease and Associated Disorders, 1, 7-8. Barnes, L. L., Mendes de Leon, C. F., Wilson, R. S., Bienias, J. L., Bennett, D. A., & Evans, D. A. (in press). Racial differences in perceived discrimination in a community population of older blacks and whites. Journal of Aging and Health. Bienias, J. L. (2001). “Replicate-Based Variance Estimation in a SAS® Macro.” Proceedings of the Fourteenth Annual Meeting of the NorthEast SAS Users Group, Statistics, Data Analysis, and Econometrics Section, pp. 727-735. [Available from http://www.nesug.org.] Bienias, J. L., Beckett, L. A., Bennett, D. A., Wilson, R. S., and Evans, D. A. (2003). “Design of the Chicago Health and Aging Project (CHAP).” Journal of Alzheimer’s Disease, 5, No. 5. Evans, D. A., Bennett, D. A., Wilson, R. S., Bienias, J. L., Morris, M. C., Scherr, P. A., Hebert, L. E., Aggarwal, N., Beckett, L. A., Joglekar, R., BerryKravis, E., and Schneider, J. (2003). Incidence of Alzheimer’s disease incidence in a biracial urban community: Relation to apolipoprotein E allele status. Archives of Neurology, 60, 185-189. Everson-Rose, S. A., Mendes de Leon, C. F., Bienias, J. L., Wilson, R. S., & Evans, D. A. (in press). Early life conditions and cognitive functioning in later life. American Journal of Epidemiology. Fuller, W. A. (1975). Regression analysis for sample survey.” Sankhya, Series C, 37, 117-132. Hebert, L. E., Scherr, P. A., Bienias, J. L., Bennett, D. A., and Evans, D. A. (2003). Alzheimer’s disease in the U.S. population: Prevalence estimates using the 2000 census,” Archives of Neurology, 60, 1119-1122. Hidiriglou, M. A. (2001). Double sampling. Survey Methodology, 27, 143-154. Korn, E. L., and Graubard, B. (1990). Simultaneous testing of regression coefficients with complex survey data.” American Statistician, 44, 270-276. Korn, E. L., and B. I. Graubard. (1998). Variance
5. CONCLUSIONS The delete-a-group jackknife variance estimator is extremely useful in settings where standard techniques are not applicable or difficult to implement. In our setting, this complexity arose as a consequence of the doublesampling design (see, for example, Hidiroglou, 2001): The individual probabilities of selection became quite complex to compute and describe, because people could have many different paths through the data from the first wave to the third. Therefore, there were no longer any clear “strata” to provide a basis for more common variance estimation procedures. Because we used Poisson sampling, we could proceed directly to the delete-a-group jackknife formulation once the design became more complex. We are continuing to investigate the effect of varying the number of replicates, as well as considering the utility of the delete-a-group jackknife variance estimator in settings with stratified random sampling with or without replacement. One theoretical issue that needs to be addressed in future research is whether it was appropriate to sort the firstphase sample by probability of selection before systematically dividing it into random groups. This tended to make the delete-a-group jackknife variance estimator analogous to the stratified jackknife. Unfortunately, since the sample itself has random rather than fixed "stratum" sample sizes, the stratified jackknife itself may be problematic. Heuristically, a better approach would be to randomly sort the sample before systematically assigning observations to random groups. The problem could
543
2003 Joint Statistical Meetings - Section on Survey Research Methods
N. T., Mendes de Leon, C. F., Morris, M. C., Schneider, J. A., and Evans, D. A. (2002). Cognitive activity and incident Alzheimer’s disease in a population-based sample of older persons.” Neurology, 59, 1910-1914. Wilson, R. S., Bennett, D. A., Bienias, J. L., Mendes de Leon, C. F., Morris, M. C., and Evans, D. A. (2003). Cognitive activity and cognitive decline in a biracial community population. Neurology, 61, 812-816. Barnes, L. L., Mendes de Leon, C. F., Wilson, R. S., Bienias, J. L., Bennett, D. A., & Evans, D. A. (in press). Racial differences in perceived discrimination in a community population of older blacks and whites. Journal of Aging and Health. Wilson, R. S., Mendes de Leon, C. F., Bennett, D. A., Bienias, J. L., & Evans, D. A. (in press). Depressive symptoms and cognitive decline in a community population of older persons. Journal of Neurology, Neurosurgery, and Psychiatry. Wolter, K. M. (1985). Introduction to Variance Estimation. New York: Springer-Verlag.
estimation for superpopulation parameters. Statistica Sinica, 8, 1131-1151. Kott, P. S. (1998a), Using the Delete-A-Group Jackknife Variance Estimator in NASS Surveys, RD Research Report No. RD-98-01, U. S. Department of Agriculture, National Agricultural Statistics Service. Kott, P. S. (1998b). Using the Delete-a-Group Jacknife variance estimator in practice. Proceedings of the Annual Meeting of the American Statistical Association, Section on Survey Research Methods, 763-768. Alexandria, VA: American Statistical Association. Kott, P.S. and Bailey , J. T. (2000). The theory and practice of maximal Brewer selection. Proceedings of the Second International Conference on Establishment Surveys, Invited papers, 269-278. Kott, P. S., and Bellow, M. (1999). Capturing and evaluating the effect of reweighting for unit nonresponse.” Paper presented at the International Conference on Survey Nonresponse, Portland, Oregon. Lee, E. S., Forthofer, R. N., and Lorimor, R. J. (1989). Analyzing Complex Survey Data (Sage University Paper series on Quantitative Applications in the Social Sciences, series no. 07-071). Newbury Park, CA: Sage Publications. Morris, M. C., Evans, D. A., Bienias, J. L., Tangney, C. C., Bennett, D. A., Aggarwal, N., Schneider, J., and Wilson, R. S. (2003). Dietary fats and the risk of incident Alzheimer’s disease.” Archives of Neurology, 60, 194-200. Morris, M. C., Evans, D. A., Bienias, J. L., Tangney, C. C., Bennett, D. A., Aggarwal, N., Wilson, R. S., and Scherr, P. A. (2002a). Dietary intake of antioxidant nutrients and the risk of incident Alzheimer’s disease in a biracial community study.” Journal of the American Medical Association, 287, 3230-3237. Morris, M. C., Evans, D. A., Bienias, J. L., Tangney, C. C., and Wilson, R. S. (2002b). Vitamin E and Cognitive Decline in Older Persons. Archives of Neurology, 59, 1125-1132. Skinner, C. J. (1989). Domain means, regression, and multivariate analysis.” In C. J. Skinner et al. (eds.), Analysis of Complex Surveys, New York: Wiley, pp. 5987. SAS Institute Inc. (2000). SAS/STAT® User's Guide, Version 8. Cary, NC: SAS Institute Inc. Valliant, R., Dorfman, A. H., and Royall, R. M. (2000). Finite Population Sampling and Inference: A Prediction Approach. New York: Wiley. Wilson, R. S., Bennett, D. A., Beckett, L. A., Morris, M. C., Gilley, D. W., Bienias, J. L., Scherr, P. A., and Evans, D. A. (1999). Cognitive activity in older persons from a geographically defined population. Journal of Gerontology: Psychological Sciences, 54B, P155P160. Wilson, R. S., Bennett, D. A., Bienias, J. L., Aggarwal,
SAS and SAS/STAT are trademarks or registered trademarks of SAS Institute Inc. in the U.S. and other countries. ® indicates U.S. registration.
544