Int. J. Mobile Learning and Organisation, Vol. 7, No. 1, 2013
29
Applying the technology acceptance model to the introduction of mobile voting Mohammed-Issa Riad Jaradat Management Information Systems, Department of Information Systems, Faculty of Prince Hussein Bin Abdullah for Information Technology, Al al-Bayt University, Mafraq, Jordan Email:
[email protected] Email:
[email protected] Abstract: This study presents an extended technology acceptance model to explore the factors that affect intention to mobile voting. This study aims to explore the utilisation of mobile phones in the education environment and investigate the expectations and intentions towards mobile voting in public Jordanian Universities. The proposed model was empirically tested using data collected from a survey containing 30 questions. The partial least squares structural equation analysis was used to evaluate the causal model. The researcher finds that all variables significantly affect students’ (voters) behavioural intention except perceived price level. This study gives quantified indicators about mobile voting and a model that might help in understanding the mobile voting environment and avoids spending thousands or millions of dollars that may invest in this field without ensuring that the students (voters) will actually use the mobile voting in Jordan. Keywords: MV; mobile voting; TAM; technology acceptance model; S&P; security and privacy; TMV; trust; PPL; perceived price level; SN; subjective norm; CMV; compatibility; students union. Reference to this paper should be made as follows: Jaradat, M.R.M. (2013) ‘Applying the technology acceptance model to the introduction of mobile voting’, Int. J. Mobile Learning and Organisation, Vol. 7, No. 1, pp.29–47. Biographical notes: Mohammed-Issa Riad Mousa Jaradat is an Assistant Professor in the Department of Information Systems/Management Information Systems in the faculty of Prince Hussein Bin Abdullah for Information Technology – Al al-Bayt University, Mafraq, Jordan. He earned a Doctorate in Management Information Systems. His research interests cover IT innovation adoption, learning technology, e-business, mobile technology, knowledge management, e-government, mobile government and mobile commerce. He was awarded for his best effort in computer programming by Philadelphia University for the year 2004.
1
Introduction
Manual voting has several drawbacks such as printing of ballot paper is expensive, voting consumes a lot of time, there is no good relationship and a lack of trust between the governments and popular, sometimes government forced the voters to vote for a Copyright © 2013 Inderscience Enterprises Ltd.
30
M.R. Jaradat
particular candidate, and eliminate them from voting freely. Some candidates trying to win by buying the votes from the voters, Government can cheat by substitute the original ballot by derivative ones (Kalaichelvi and Chandrasekaran, 2011). Also inaccuracy in ballot counting, votes lost through unclear or invalid ballot marks, limited accommodations for people with disabilities and the delayed announcement of election results. To overcome these drawbacks, the electronic voting (e-voting) technique appeared, e-voting refers to the use of computers or computerised equipment to cast votes in an election. e-voting aims at increasing participation, lowering the costs of running elections and improving the accuracy of the results (Qadah and Taha, 2007). Kumar et al. (2008) claimed that e-voting systems offer multiple advantages over manual voting (traditional voting) those advantages are first reduced costs through reduced materials required for printing and distributing ballots. Second, increased participation and voting options through increased convenience to the voter, encourages more voters to cast their votes remotely, and increases the likelihood of participation for mobile voters. Third, greater speed and accuracy placing and tallying votes step-by-step processes help minimise the number of miscast votes. Fourth, greater accessibility for the disabled because they support a variety of interfaces and accessibility features, they can vote independently and privately. Finally, flexibility through support multiple languages and multiple designs. By using e-voting, the voters can vote at anytime and anywhere, rather than voting still by behind the cables from a specific place. Economides and Grousopoulou (2010) claimed that ‘Mobile devices have become some of the fastest advancing communication gadgets’. Mulliah and Stroulia (2009) claimed that ‘Mobile devices are becoming increasingly powerful and accessible as wireless networks cover most of our daily environment and a variety of software frameworks’. Moreover, Nor Shahriza et al. (2006) said that the widespread use of mobile phones among students might have also lead to the positive opinion and perception on its application. Eschenbrenner and Nah (2007) identify the benefits of using mobile technology in education which gives greater efficiencies and effectiveness, increased individual support and opportunities for personal development, better methods of collaborating and communicating, and greater exposure to technology. Therefore, the students can now elect without stepping into a university as long as they carry their mobile phones. Mobile phone services have become a mass market commodity; more people use mobile phone worldwide. It becomes the most adopted means of communication both in the developing and the developed countries. In Jordan, according to Jordan telecommunication market establishment statistics (Telecommunication Regulatory Commission Jordan, 2012), there are 419,533 fixed telephone lines and 7,758,968 mobile lines which exceed the number of the population. This implies that mobile phone is not an option for our life but now it turned out to be a necessity of life and it is increasing continuously and rapidly. Mobile voting refers to the use of mobile device or mobile equipment to cast votes in an election without the need of cables at anytime anywhere. Mobile voting aims to increase participation more than e-voting because of the spread and adoption means of mobile communication both in the developed and the developing countries. It is also lowering the costs of running elections and improving the accuracy of the results. Even that the disabled persons and persons in hospitals can also cast their votes.
Applying the technology acceptance model to the introduction of mobile voting
31
Kalaichelvi and Chandrasekaran (2011) showed the requirements of e-voting which apply for manual (paper) voting and also for mobile voting:
Fairness: No one can learn the voting outcome before the tally.
Eligibility: Only eligible voters are permitted to vote.
Uniqueness: No voter should be able to vote more than once.
Privacy: No one can access any information about the voters’ vote.
Completeness/Accuracy: All valid votes should be counted correctly.
Soundness: Any invalid vote should not be counted.
Uncoercibility: No voter can prove how he/she voted to others to prevent bribery.
Efficiency: The computations can be performed within a reasonable amount of time.
Robustness: A malicious voters cannot frustrate or disturb the election.
Mobile voting is already in use in many countries all over the world; such as UK and Switzerland have pioneered mobile voting in local elections. In Asia, Korea leads the way in mobile voting through its use in the selection of presidential candidates (Georgescu, 2010). This research avoids spending thousands or millions of dollars that may invest in this field without ensuring that the student (voter) will actually use mobile voting. This paper examines the factors to adopt, design and implementation of a mobile voting system suitable for a university setting, where students can elect their union (students’ union) by casting their votes anytime, anywhere without the need of cables by using mobile devices including personal computers, personal digital assistants, and smart and regular mobile phones.
2
Theoretical background
In this study, the researcher investigates key factors that affect students’ (voters) intention to use mobile voting in public Jordanian universities. These key factors include (security and privacy, trust, perceived price level, subjective norm, and compatibility). The researcher evaluated the effects of these factors by using the Technology Acceptance Model (TAM), a well-known model of information technology adoption and use.
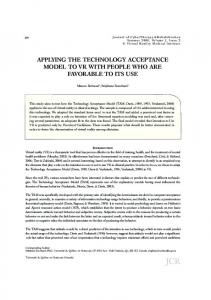
2.1 Technology Acceptance Model (TAM) TAM was initially introduced by Davis (1989). It has become one of the most widely used models in the investigation of user acceptance of information technology. TAM has been evaluated to be not only a powerful model for representing the determinants of system usage but also a valuable tool for system planning, since the system designers have some degree of control over easiness and usefulness (Taylor and Todd, 1995). The theoretical basis of the model was derived from the Theory of Reasoned Action (TRA) by Fishbein and Ajzen (1975). The original TAM depicted in Figure 1 is an information system acceptance theory, whose main purpose is simply to predict and explain the user acceptance of information technology. TAM is constructed from several indicators including Perceived Usefulness (PU), Perceived Ease of Use (PEOU),
32
M.R. Jaradat
Attitudes Towards Using (ATU), Behavioural Intention (BI), and Actual Usage (AU) and are defined as follows: Perceived Usefulness (PU) is defined as the degree to which a person believes that using IT system would improve his/her job performance (Davis, 1989; Davis et al., 1989; Davis and Cosenza, 1993). Perceived Ease of Use (PEOU) is defined by Adams et al. (1992) as the degree to which a person believes that using an information technology would be free of effort. Attitudes Towards Using (ATU) is defined by Fishbein and Ajzen (1975); Fishbein and Ajzen (1979); Davis and Cosenza (1993); and Yogesh and Dennis (1999) as a function of beliefs, positively or unfavourably towards the behaviour. Behavioural Intention (BI) is defined by Fishbein and Ajzen (1975); Fishbein and Ajzen (1979); and Davis and Cosenza (1993) as behavioural intentions are our goals, aspirations and expected responses to the attitude object. Actual Usage (AU) is defined by Chen et al. (2002) as the frequency of using a new technology system such as mobile voting and the approximate number of times the user uses it in a given period of time. Figure 1
Original technology acceptance model
Many researchers have suggested that TAM needs to be given additional variables to provide an even stronger model (Legris et al., 2003). Venkatesh and Davis (2000) proposed an extension, TAM2, which included social influence processes and cognitive instrumental processes, but they omitted ATU due to weak predictors of either BI or AU. This is consistent with prior research finding by Taylor and Todd (1995). Their research indicated that both social influence processes and cognitive instrumental processes significantly influenced user acceptance and that PU and PEOU indirectly influenced AU through BI. The interest of the current study is the acceptance of new information technology – mobile voting; thus, a review of prior studies suggested the theoretical foundations of the formulations used in our hypotheses. Much research also indicated that TAM needed integration with additional variable(s) in order to improve its prediction of system use (Szajna, 1996; Lucas and Spitler, 2000). To this end, this study examines a prevalent theory (i.e. TAM) for investigating individual acceptance of mobile voting context with external variables (security and privacy, trust, perceived price level, subjective norm, and compatibility).
2.2 Security and privacy in mobile voting Khalifa and Ning shen (2008) defined Security as the safety of exchanged information regardless of the level of privacy involved. In otherwise NECCC (2001) defined security as the protection from intended and unintended threats that would result in the loss or dissemination or steal of data such as personal data, social security number and credit
Applying the technology acceptance model to the introduction of mobile voting
33
card numbers. Ghosh and Swaminatha (2001) said that security is the safety of exchanging information regardless of the level of privacy involved. In addition to electronic security measures associated with data transmission (e.g. encryption) and storage (e.g. firewalls), mobile security should also include mobile devices, which can store highly sensitive data. Khalifa and Ning shen (2008) defined privacy as the extent to which customers have control over the timing, and circumstances of sharing oneself (physically, behaviourally or intellectually) with others. In otherwise, Legnini (2006) defined privacy as ‘the right to be left alone and to control the conditions under which information pertaining to you is collected, used and disseminated’. As personal information is important for delivering customised/personalised services, some individuals may be willing with more privacy than others, so if the student (voter) lost his privacy he will not use the system (mobile voting) again. Liu and Amet (2002) claimed that the second important driver in their study is privacy. And the privacy issue is more salient in mobile commerce than in e-commerce; because mobile service providers have access to sensitive information related to personal data. With more private information exposed to service providers, mobile customers require more assurance of privacy protection and more control over the information that can be released. According to this study, Security and Privacy (S&P) is introduced as an external variable of the suggested model. It is hypothesised that the security and privacy to TAM causal relationships may potentially explain a greater proportion of the variance in user BIs towards the use of mobile voting. It is expected that the study will show that security and privacy will have some effect on the adoption and use of mobile voting.
2.3 Trust in mobile voting Lee (1998) defined trust as a complex social phenomenon that reflects technological, behavioural, social, psychological as well as organisational aspects of interactions among various human and non-human agents. Kini and Choobineh (1998) showed in the theoretical framework of trust that trust is defined in the Webster Dictionary as:
An assumed reliance on some person or thing. A confident dependence on the character, ability, strength or truth of someone or something.
A charge or duty imposed in faith or confidence or as a condition of a relationship.
To place confidence (in an entity).
According to them they define trust as ‘a belief that is influenced by the individual’s opinion about certain critical system features’. Gefen et al. (2003) defines trust as the expectation that the trusted party will behave in an ethical, dependable and socially appropriate manner and will fulfil their expected commitments in conditions of interdependence and potential vulnerability. Dahlberg et al. (2003) and Grandison and Sloman (2000) showed that trust is the key to success and major facilitator of wireless transactions because of the natural human needs to understand the social surroundings of the virtual environment. Bhattacherjee (2002) theoretically conceptualised and empirically validated a scale to measure individual trust in online firms. He found that one’s willingness to interact with an online firm may be predicted by additional variables, above and beyond trust, such as perceived usefulness and perceived ease of use of such interactions.
34
M.R. Jaradat
Mukherjee and Nath (2003) tested a model of trust in India in which ‘shared value’, ‘communication’ and ‘opportunistic behaviuor’ were antecedents of trust. They concluded that both shared value and communication played a significant positive role on trust and that trust had a significant positive influence on commitment. Doney and Cannon (1997) and Garbarino and Johnson (1999) claimed that trust is the essential ingredient for successful long-term business relationships with individuals. Gefen et al. (2003) introduced trust as another construct of Davis’ TAM. An empirical investigation that included 213 subjects confirmed the positive relationship between trust and intended usage of E-commerce websites. The researcher found that perceived ease of use of the site positively influenced the degree of trust in the site. Dahlberg et al. (2003) proposed the application of trust enhanced technology acceptance model in order to investigate user acceptance of internet applications. According to this study, trust is introduced as an external variable of the suggested model. It is hypothesised that the trust to TAM causal relationships may potentially explain a greater proportion of the variance in user behavioural intentions towards the use of mobile voting. It is expected that the study will show that trust will have some effect on the adoption and use of mobile voting.
2.4 Perceived price level in mobile voting (PPL) Cheong and Park (2005) said that the Perceived Price Level (PPL) of using mobile internet acceptance in Korea can be categorised into two types. First, the initial cost such as the cost of the devices. Second, the subscription service provider cost such as service fee and communication fee. They defined PPL in their research as ‘The willingness to pay for the service’. They found that PPL has a negative role in developing the attitude as well as the intention. Rupp and Smith (2002) defined PPL (cost) as the possible expenses of using, i.e. equipment costs, access cost, transaction fee, etc. Pin and Hsin-Hui (2004) defined cost as the extent to which a person believes that using a service such as mobile voting will cost money. They found that financial cost had a significant effect on BI to use. Yi-Shun et al. (2006) found that the higher perceived financial resources will lead to higher BI to use mobile service and higher perceived financial resources will lead to higher PU of mobile service. On other hand, they found that the higher perceived financial resources will not lead to higher PEOU mobile service. Qingfei et al. (2008) claimed that cost is a user’s assessment of the object world or reality, not his/her perception. Cost factor should thus be included because it will directly affect the users’ adoption behaviour. Also, they believe that cost factor will significantly affect mobile commerce user acceptance. Wu Jen-Her et al. (2007) claimed that cost is one of major concerns in the initial stage and important predictors of M-commerce adoption and has a significantly negative direct effect on behavioural intention to use from consumer perspective. Jaradat (2010) claimed that there is no statistically significant relationship discovered between cost and ATU, PU and PEOU to use mobile university services in Jordan. But he found that the arithmetic grand mean of cost equal to 3.34 which is greater than the agreement point (+3). So this means it is under the category (high) except the sentence number two ‘I think the equipment cost is expensive to use mobile university services’, it is under category low. But they agree that the cost in general will not be a barrier to use a mobile university services in Jordan and that may be due to the following reasons:
Applying the technology acceptance model to the introduction of mobile voting
35
Competition and the prices of mobile services and devices are generally low.
Grateful features of mobile devices such as portability and mobility, flexibility and utility.
Students do not use mobile university services and do not know about this new technology cost.
The cost of the technology is relatively cheap.
According to this study, PPL is introduced as an external variable of the suggested model. It is hypothesised that the perceived price level to TAM causal relationships may potentially explain a greater proportion of the variance in user BIs towards the use of mobile voting. It is expected that the study will show that PPL will have some effect on the adoption and use of mobile voting.
2.5 Subjective norm in mobile voting (SUN) Subjective Norm (SN) was earlier proposed in the Theory of Reasoned Action (TRA) by Fishbein and Ajzen (1975) and they defined it as the person’s perception that most people who are important to him approve or disapprove his performing a given behaviour. Subjective norm was also included as a direct determinant to behavioural intention in Theory of Planned Behaviour (TPB) by Ajzen (1991). SN is defined as ‘the person’s perception that most people who are important to him think he should or should not perform the behavior in question’ (Dillon and Morris, 1996). SN describes the individual’s social influences towards adopting the service whether perform or not the behaviour in question (Taylor and Todd, 1995). Ching and John (2009) claim that people may choose to perform the behaviour even if they are not favourable to perform if they believe that people who are important to him think he/she should or should not perform it. SN was found to have an effect on intention to use and usage behaviour on technology adoption studies (Fishbein and Ajzen, 1975; Venkatesh and Davis, 2000; Khalifa and Ning shen, 2008; Jaradat, 2010). Nor et al. (2008) in Malaysia found that subjective norm positively and significantly effecting intention. AL-Majali (2011) in Jordan found that customer’s attitude and their belief about social influence play a vital role in influencing the intention. In addition, attitude and subjective norm are influenced by attitudinal belief and normative belief structures. Additionally, family and mass media are significant factors that influence subjective norm. According to this study, SN is introduced as an external variable of the suggested model. It is hypothesised that the subjective norm to TAM causal relationships may potentially explain a greater proportion of the variance in user BIs towards the use of mobile voting. It is expected that the study will show that subjective norm will have some effect on the adoption and use of mobile voting.
2.6 Compatibility in mobile voting Compatibility was defined by Rogers (1995) as the degree to which an innovation is seen to be compatible with values, experiences, beliefs, and needs of adopters. The concept of compatibility captures a students’ (voters) perception of the congruence of mobile voting with students (voters) lifestyle. And he said (Rogers, 2003) compatibility is one of the important innovation characteristics.
36
M.R. Jaradat
Teo and Pok (2003) claimed in the context of WAP-enabled mobile phone that a person’s life styles will strongly influence his/her decision to adopt the technology. Especially a person, who leads a busy life, will be more likely to adopt a mobile phone services. Lee and Cheng (2003) found that compatibility played the most significant direct factor of individual’s intent to adopt university smart card. Wu Jen-Her et al. (2005) indicated that compatibility has a significant effect on behavioural intention to use. Wu and Wang (2005) claimed that compatibility has the most important effect on behavioural intention to use and the second most important effect on the actual use. This is indicated that high compatibility will lead to preferable adoption. Wu Jen-Her et al. (2007) found that compatibility has a direct effect on behavioural intention to use, and has the strongest significant and positive effects. Prior researches indicated that compatibility had strong direct impact; according to this study, compatibility is introduced as an external variable of the suggested model. It is hypothesised that the compatibility to TAM causal relationships may potentially explain a greater proportion of the variance in user behavioural intentions towards the use of mobile voting. It is expected that the study will show that compatibility will have some effect on the adoption and use of mobile voting.
3
Research model and hypotheses
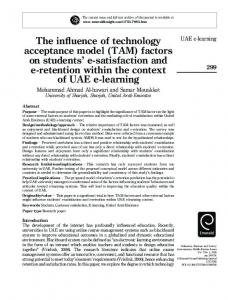
3.1 Research model The present study uses TAM and incorporates variables (security and privacy, trust, perceived price level, subjective norm and compatibility) as external variables. The research model tested in this study is shown in Figure 2. Figure 2
Research model of the study
Applying the technology acceptance model to the introduction of mobile voting
37
3.2 Research hypotheses This section presents the hypotheses to be tested and tests the effects of the external variables (security and privacy, trust, perceived price level, subjective norm, and compatibility) and their relationship with a well-known model, i.e. TAM, as shown in Figure 3. Table 1 presents a summary of the interrelationships between hypotheses in the research model. Figure 3
Table 1
Proposed research model for mobile voting acceptance
Hypotheses of the study Hypothesis
Independent
Dependent
H1:
Behavioural intention to use mobile voting has a direct effect on future actual use of mobile voting in Jordan.
BI
AU
H2a:
Perceived ease of use has a direct effect on behavioural intention to use mobile voting in Jordan.
PEOU
BI
H2b:
Perceived ease of use has a direct effect on perceived usefulness of using mobile voting in Jordan.
PEOU
PU
H3:
Perceived usefulness of mobile voting has a direct effect on behavioural intention to use mobile voting in Jordan.
PU
BI
H4:
Compatibility has a direct effect on behavioural intention to use mobile voting in Jordan.
CMV
BI
H5:
Subjective norm has a direct effect on behavioural intention to use mobile voting in Jordan.
SN
BI
PPL
BI
H6:
Perceived price level has a direct effect on behavioural
intention to use mobile voting in Jordan.
H7:
Trust has a direct effect on behavioural intention to use mobile voting in Jordan.
TMV
BI
H8:
Security and privacy has a direct effect on behavioural intention to use mobile voting in Jordan.
S&P
BI
38
4
M.R. Jaradat
Research design and method
4.1 Population and sample This study was conducted at public universities in Jordan as shown in Table 2 below, which have approximately 167,551 students from all Jordanian territories. The data was randomly gathered from undergraduate students by using a stratified random sample. Table 2
Public universities in Jordan
#
University name
Number of student
Percentage
1
Jordan University
35,099
20.9%
2
Hashemite University
22,943
13.7%
3
Al Balqa Applied University
8,746
5.2%
4
Yarmouk University
33,500
20%
5
Jordan University for Science and Technology
22,600
13.5%
6
Al al-Bayt University
13,350
7.8%
7
Mutah University
17,890
10.7%
8
Al-Hussein Bin Talal University
7,498
4.5%
9
Tafila Technical University
5,925
3.5%
Total Note:
167,551
German Jordanian University does not have a student’s Union. So, it excluded from the survey.
According to Sekaran (2006), sample size can be defined as the number of elements to be included in the study, a sample of 417 students was selected for the study.
4.2 Measuring the constructs The researcher developed a questionnaire to achieve the objectives based on literature review of the study. The questionnaire consisted of multiple items and its organisation based on ten groups using a five point Likert scale ranging from (1) ‘strongly disagree’ to (5) ‘strongly agree’. Measurement items used in this study were adapted from previously validated measures such as Davis (1989), Davis and Cosenza (1993), Davis and Venkatesh (1995), Lin and Wu (2002), Luarn and Lin (2005), Venkatesh et al. (2003), Yang and Peterson (2001); they were derived from thorough consultation with IS/IT experts to ensure their reliability and validity. The questionnaire was given to a number of referees. The questionnaire statements were modified based on the results of the referees, specifically the general information and the translation of the statement from Arabic to English. A pilot test of the measures was conducted on a representative sample of 30 students (voters) and some statements on the questionnaire were modified based on the results of the pilot test.
4.3 Data collection procedure For this study, the researcher utilised a survey. The questionnaire was distributed to a representative sample including prospective mobile voting students (voters). All
Applying the technology acceptance model to the introduction of mobile voting
39
participants were selected from public Jordanian universities randomly by using a stratified random sample. The researcher used computer software for the analysis; Partial Least Squares (PLS) structural equation analysis to test the hypotheses. Statistical descriptive was used to find out the respondents’ demographic and general characteristics to provide a descriptive profile of the respondents by using SPSS 16.0.
4.4 Data analysis The data for this research has been collected by using a questionnaire containing 30 questions describing nine latent constructs: S&P, TMV, PPL, SN, CMV, PU, PEOU, BI to use and AU. About 381 returned questionnaires were received after the follow-up activities from 417. Ten participants gave incomplete answers and their results were dropped from the study. This left 371 sets of data for statistical analysis, with 89% valid return rate. The PLS structural equation analysis was used to test the hypotheses. PLS employs a component-based approach for estimation purposes and can readily handle formative factors and also places minimal restrictions on the sample size and residual distributions Chin et al. (2003). To validate the measurement model, convergent validity was evaluated by examining composite reliability and Average Variance Extracted (AVE) from the measures. Values for composite reliability are recommended to exceed 0.70 (Chin et al., 2003) and AVE values should be greater than the generally recognised cut-off value of 0.50 (Fornell and Larcker, 1981). All composite reliability and AVE values meet the recommended threshold values except perceived price level. Table 3 summarises the results. Table 3
1
Composite reliability, AVE, and of constructs values
Composite reliability
AVE
Security and privacy
0.829 0.618 0.786
2 Trust
1
2
3
4
5
6
7
8
9
0.859 0.550 0.630 0.742
3
Perceived price level
0.846 0.734 0.158 0.083 0.856
4
Subjective norm
0.792 0.567 0.513 0.548 0.140 0.753
5 Compatibility 0.882 0.714 0.510 0.521 0.130 0.573 0.849 6
Perceived usefulness
0.841 0.643 0.552 0.607 0.128 0.577 0.695 0.802
7
Perceived easy of use
0.872 0.630 0.512 0.466 0.121 0.544 0.588 0.649 0.794
8
Behavioural intonation
0.921 0.795 0.556 0.576 0.154 0.559 0.639 0.677 0.622 0.892
9 Actual use Note:
0.920 0.854 0.439 0.517 0.098 0.578 0.565 0.602 0.523 0.786 0.924
Square roots of the AVE are the bolded diagonal values.
40
M.R. Jaradat
The AVE for each variable was obtained to check discriminant validity (Campbell, 1960). As shown in Table 3, the square root of AVE for each construct is greater than the correlations between the constructs and all other constructs, indicating that these constructs have discriminant validity (Fornell and Larcker, 1981).
4.5 Reliability and validity We used Cronbach’s alpha to measure internal consistency for state survey and research variables. The results of the reliability test for the measures suggest that all the measures in this study are reliable. The alpha coefficients for the measures ranged from 0.62 to 0.87 as presented in Table 4. According to Hair et al. (2003) values greater than 0.6 (60%) are a satisfactory level of internal consistency of measure. Table 4
An illustration of Cronbach’s alpha of the study variables Variables
Cronbach’s alpha
Actual use
0.823623
BI
0.871083
Compatibility
0.800290
Perceived ease of use
0.804038
Perceived usefulness
0.717936
Perceived price level
0.706685
Security and privacy
0.691758
Subjective norm
0.622675
Trust
0.793910
Heneman and Judge (2003) defined validity as ‘the degree to which an instrument measures the attribute or construct it intends to measure’. Therefore, we distributed a questionnaire to a number of referees and a group of participants and both of them agreed that the questionnaire measured the attributes it intended to measure.
5
Results
5.1 Descriptive statistics (demographic profile of respondents) This section describes respondents’ personal background such as gender, age and monthly income. The demographic profile of the respondents is illustrated in Table 3. As depicted in Table 5, about 57.1% of the respondents were female. The majority of the respondents’ ages were students in the range of 20-25 years old (which was 72.2% of respondents) while 96 were 19 years old or younger (a total of 25.9% of respondents) and the fewest respondents were in the range of 26 years old or older (only 1.9%). The majority of the respondents’ monthly expenses were students with 51-100 JD (44.2%), 84 when the monthly expenses were 101-200 JD (22.6%), 89 when the monthly expenses of 50 or less (24%), and 34 with monthly expenses that are more than 201 (9.2%).
Applying the technology acceptance model to the introduction of mobile voting Table 5
41
Demographic profile of respondents Variable
Gender
Age (years)
Frequency
Percentage
Female
212
57.10
Male
159
42.90
19 or Less
96
25.90
20–25
268
72.20
More than 26
7
1.90
50 or Less
89
24.00
51–100
164
44.20
101–200
84
22.60
More than 201
34
9.20
Monthly expense
5.2 Arithmetic grand mean for the scores of responses for all study variables statements Table 6 illustrates the arithmetic grand mean for the scores of responses for all the study variables statements. When this grand mean is compared with the 5-points scale from 1 to 5 (High > 3, Neutral = 3 and Low < 3), it is found that results of the respondent’s categorisation of the main study is greater than the agreement point (+3). So, this means all the study variables are under the category (High) except PPL under the category (low). Table 6
Arithmetic grand mean for the scores of responses for all study variables statements
No.
Variable
Grand Mean
1
Security and privacy
3.35
2
Trust
3.24
3
Perceived price level
2.96
4
Subjective norm
3.23
5
Compatibility
3.68
6
Perceived usefulness
3.70
7
Perceived easy of use
3.72
8
Behavioural intonation
3.59
9
Actual use
3.69
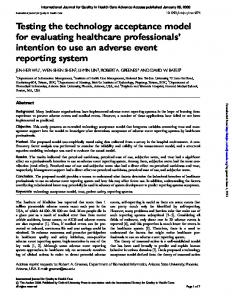
5.3 Hypotheses test Figure 4 presents the significant structural relationship among the research variables and the standardised β coefficients for each independent variable, and total variance explains for each dependent variable. All the hypotheses are strongly supportive except for the relationship between perceived price level and behavioural intention to use. As shown in Figure 4 and Table 7, the results indicate that behavioural intention to use mobile voting has a significant effect on the actual use (H1: β = 0.786, P < 0.001). This means that users’ behavioural intention is an important determinant of mobile voting usage. The data
42
M.R. Jaradat
also shows that perceived ease of use of mobile voting has a significant effect on behavioural intention to use mobile voting (H2a: β = 0.189, P < 0.001) Moreover, it does have a significant indirect effect on both behavioural intention to use and actual use through perceived mobile voting usefulness, and also has a significantly positive direct effect on perceived mobile voting usefulness (H2b: β = 0.649, P < 0.001). The data also shows that perceived usefulness significantly and directly influences the behavioural intention to use (H3: β = 0.216, P < 0.001) and indirectly influences actual use. The data also shows that compatibility significantly and directly influences the behavioural intention to use (H4: β = 0.179, P < 0.001) and indirectly influences actual use. The data also shows that subjective norm significantly and directly influences the behavioural intention to use (H5: β = 0.145, P < 0.001) and indirectly influences actual use. For hypothesis 6 which is proposed that perceived price level has a direct effect on behavioural intention to use mobile voting in Jordan, the data shows that it is not supported (H6: β = 0.036, P < 0.05). The data also shows that trust significantly and directly influences the behavioural intention to use (H7: β = 0.124, P < 0.01) and indirectly influences actual use. For hypothesis 8, the security and privacy has a significant direct effect on the behavioural intention to use mobile voting (H8: β = 0.089, P < 0.05) and indirectly influences actual use. Figure 4
Table 7
The empirical results for mobile voting acceptance
An illustration of the results of the hypotheses of the study Independent
Dependent
Result
H1:
BI
AU
Supported
H2a:
PEOU
BI
Supported
H2b:
PEOU
PU
Supported
H3:
PU
BI
Supported
H4:
CMV
BI
Supported
H5:
SN
BI
Supported
H6:
PPL
BI
Rejected
H7:
TMV
BI
Supported
H8:
S&P
BI
Supported
Applying the technology acceptance model to the introduction of mobile voting
6
43
Discussion and Conclusions
This study attempts to analyse the adoption and the factors that affect intention to use mobile phones in the educational environment at public Jordanian universities. Moreover, it assists developers in building and quantifying indicators about mobile voting and a model that might help in understanding mobile voting environment to avoid spending thousands or millions of dollars that may be invested in this field without ensuring that the students (voters) will actually use the mobile voting system through the Technology Acceptance Model (TAM) with external variables (security and privacy, trust, perceived price level, subjective norm and compatibility). The findings generally supported the hypotheses derived from the model as well as earlier empirical studies except the Perceived Price Level (PPL). First, this study confirms that Perceived Usefulness (PU) has the most important direct effect on predicting students (voters) behavioural intention to adopt and use of mobile voting in public Jordanian universities, as well as many ICT technologies in other TAM research. This implies that the service and content provider should take advantage of the value adding features and functions of mobile voting services. Second, Perceived Ease of Use (PEOU) comes after the perceived usefulness and it has an important effect on predicting students (voters) behavioural intention to adopt and use of mobile voting even direct or indirect through perceived usefulness, this result indicates that the progress of student (voter) acceptance in mobile voting could be made by focusing on easy-to-use interface design so the developers should keep developing user oriented easy-to-use and user friendly interface. As can be seen from Figure 4, perceived usefulness and perceived ease of use will indirectly influence the actual usage through behavioural intention to use mobile voting. Third, compatibility has a direct effect on behavioural intention to use mobile voting and indirectly influences the actual usage through behavioural intention. Wu, Jen-Her et al. (2007) claimed that besides developing useful and easy to use systems, mobile IT/IS designers should also pay more attention to user requirements analysis to determine their expectations and requirements. Only when participants have higher perceptions in compatibility with their previous or current practice, values, experiences, beliefs and need there is a higher possibility to achieve successful acceptance. This indicates that high compatibility will lead to preferable adoption, our findings confirm those of other researchers such as Rogers (2003), Teo and Pok (2003), Wu Jen-Her et al. (2005), Wu and Wang (2005) and Wu Jen-Her et al. (2007). Forth, Subjective Norm (SN) has a direct effect on behavioural intention to use mobile voting and indirectly influences the actual usage through behavioural intention. This implies that the students (voters) may choose to perform the behaviour even if they are not favourable to perform if they believe that students (voters) who are important to him think he/she should or should not perform it (Ching and John, 2009). Our findings confirm those of other researchers such as Fishbein and Ajzen (1975), Venkatesh and Davis (2000), Khalifa and Ning shen (2008), Nor and Pearson (2008), Jaradat (2010) and AL-Majali (2011). Fifth, trust has a direct effect on behavioural intention to use mobile voting and indirectly influences the actual usage through behavioural intention. This implies that the students (voters) willingness to rely on the service provider and the university administration.
44
M.R. Jaradat
Sixth, security and privacy has a direct effect on behavioural intention to use mobile voting and indirectly influences the actual usage through behavioural intention. This conclusion is in accordance with the research results of Ghosh and Swaminatha (2001), Liu and Amet (2002). Seventh, the study finds that PPL in mobile voting does not have any significant effect on behavioural intention and even indirectly to the actual usage through behavioural intention; also the results of the respondent’s categorise less than the agreement point (3) with 2.96 grand mean. So this means that perceived price level falls under the category (low). Some studies found opposite results which state that cost influences the use and adoption of technology (Pin and Hsin-Hui, 2004; Wu and Wang, 2005; Yi-Shun et al., 2006; Qingfei et al., 2008). However, in the development of behavioural intention, individuals may compare the benefit from the service to the cost of using it. In this study, the researcher found that there are no statistically significant relationships according to perceived price level and our findings confirm those of other researchers such as Cheong and Park (2005) and Jaradat (2010). Finally, user adoption and use of mobile voting can be predicted from the students’ behavioural intentions, which are affected significantly by perceived usefulness, perceived ease of use, compatibility, subjective norm, trust, and security and privacy. As an ultimate aspiration, the researcher finds that there is a direct effect between behavioural intention and actual use towards using mobile voting in public Jordanian universities. This research presents a new opportunity for further research in the field of mobile voting adoption in a country like Jordan, which actually focuses on improving and developing the information technology in all fields. This research avoids spending thousands or millions of dollars that may be invested in this field without ensuring that the student will actually use the mobile voting. This research could assist decision maker and IT/IS developers, and could help in future researches by deploying other external variables which are suitable for educational environment in Jordan.
References Adams, D., Nelson, R. and Todd, P. (1992) ‘Perceived usefulness, ease of use, and usage of information technology: a replication’, MIS Quarterly, Vol. 16, No. 2, pp. 227–247. Ajzen, I. (1991) ‘The theory of planned behavior’, Organizational Behavior and Human Decision Processes, Vol. 50, pp.179–211. AL-Majali, M. (2011) ‘The use of theory reasoned of action to study information technology in Jordan’, Journal of Internet Banking and Commerce (JIBC), Vol. 16, No.2, pp.01–11. Bhattacherjee, A. (2002) ‘Individual trust in online firms: scale development and initial test’, Journal of Management Information Systems, Vol. 19, No. 1, pp. 211–241. Campbell, D.T. (1960) ‘Recommendations for APA test standards regarding construct, trait, or discriminant validity’, The American Psychologist, Vol. 15, pp.546–553. Chen, L., Gillenson, M. and Sherrell, D. (2002) ‘Enticing online consumers: an extended technology acceptance perspective’, Information and Management, Vol. 39, No. 8, pp.705–719. Cheong, J. and Park, M. (2005) ‘Mobile internet acceptance in Korea’, Internet Research: Electronic Networking Applications and Policy, Vol. 15, pp.125–140.
Applying the technology acceptance model to the introduction of mobile voting
45
Chin, W.W., Marcolin, B.L. and Newsted, P.R. (2003) ‘A partial least squares latent variable modeling approach for measuring interaction effects: results from a Monte Carlo simulation study and an electronic-mail emotion/adoption study’, Information Systems Research, Vol. 14, No. 2, pp.189–217. Ching, S.Y. and John, W.H.H. (2009) ‘ Factors affecting the adoption of mobile commerce in Malaysia’, The IUP Journal of Information Technology, Vol. V, No. 3, pp.24–37. Dahlberg, T., Mallat, N. and Öörni, A. (2003) ‘Trust enhanced technology acceptance model – consumer acceptance of mobile payment solutions’, Proceedings of the Stockholm Mobility Roundtable, Stockholm. Davis, F. (1989) ‘Perceived usefulness, perceived ease of use, and user acceptance of information technology’, MIS Quarterly, Vol. 13, No. 3, pp.318–339. Davis, F. and Venkatesh, D. (1995) ‘Measuring user acceptance of emerging information technologies: an assessment of possible method biases’, 28th Annual Hawaii International Conference on System Sciences, Hawaii, IEEE computer society press, Los Alamitos, Calif, pp.729–736. Davis, D. and Cosenza, R. (1993) Business Research for Decision Making, Wadsworth Publishing Co., Belmont, CA. Davis, F., Bagozzi, R. and Warshaw, P. (1989) ‘User acceptance of computer technology: a comparison of two theoretical models’, Management Science, Vol. 35, No. 8, pp.982–1003. Dillon, A. and Morris, M. (1996) ‘User acceptance of information technology: theories and models’, Journal of the American Society for Information Science, Vol. 31, pp.3–32. Doney, P. and Cannon, J. (1997). ‘An examination of the nature of trust in buyer-seller relationships’, Journal of Marketing, Vol. 61, No. 2, pp35–51. Economides, A. and Grousopoulou, A. (2010) ‘Mobiles in education: students’ usage, preferences and desires’, Int. J. Mobile Learning and Organisation, Vol. 4, No. 3, pp.235–252. Eschenbrenner, B. and Nah, F. (2007) ‘Mobile technology in education: uses and benefits’, Int. J. Mobile Learning and Organisation, Vol. 1, No. 2, pp.159–183. Fishbein, M. and Ajzen, I. (1975) Belief, Attitude, Intentions and Behavior: An Introduction to Theory and Research, Addison-Wesley, Boston. Fishbein, M. and Ajzen, I. (1979) ‘A theory of reason action: some application sand implications’, in Howe, H. and Page, M. (Eds): Nebraska Symposium on Motivation, University of Nebraska Press, Lincoln, NB, pp.65–116. Fornell, C. and Larcker, F.L. (1981) ‘Evaluating structural equation models with unobservable variables and measurement error’, Journal of Marketing Research, Vol. 18, pp.39–50. Garbarino, E. and Johnson, M. (1999) ‘The different roles of satisfaction, trust, and commitment in consumer relationships’, Journal of Marketing, Vol. 63, No. 2, pp.70–87. Gefen, D., Karahanna, E. and Straub, D. (2003) ‘Trust and TAM in online shopping: an integrated model’, MIS Quarterly, Vol. 27, No. 1, pp.51–90. Georgescu, M. (2010) ‘Mobile government: an emerging direction’,. analele stiintifice ale universitatii, alexandru ioan cuza” din iasi, Stiinte Economice, No. special, pp.380–386. Ghosh, A.K. and Swaminatha, T.M. (2001) ‘Software security and privacy risks in mobile e-commerce’, Communications of the ACM, Vol. 44. No. 2, pp.51–57. Grandison, T. and Sloman, M. (2000) ‘A survey of trust in internet applications’, IEEE Communications Surveys, Vol. 3, No. 4, pp.2–16. Hair, J., Babin, B., Money, A. and Samouel, P. (2003) Essentials of Business Research Methods,. Lehigh Publishing, Inc. Heneman, H. and Judge, T. (2003) Staffing Organisation, 4th ed., McGraw-Hill, New York. Jaradat, M-I.R.M. (2010) ‘Understanding the acceptance of mobile university services: an empirical analysis’, Int. J. Mobile Learning and Organisation, Vol. 4, No. 4, pp.407–427.
46
M.R. Jaradat
Kalaichelvi, V. and Chandrasekaran, R.M. (2011) ‘Secured single transaction e-voting protocol: design and implementation’, European Journal of Scientific Research, Vol. 51, No. 2, pp.276–284. Khalifa, M. and Ning shen, K. (2008) ‘Drivers for transactional B2C mobile commerce adoption: extended theory of planned behavior’, Journal of Computer Information Systems, Vol. 48, No. 3, pp.111–117. Kini, A. and Choobineh, J. (1998) ‘Trust in electronic commerce: definition and theoretical considerations’, 31st Annual Hawaii International Conference on System Sciences, Hawaii, http://ieeexplore.ieee.org/iel4/5217/14270/00655251.pdf Kumar,M., Suresh Kumar, T.V., Hanumanthappa, M. and Evangelin Geetha, D. (2008) Secure Mobile Based Voting System, Emerging Technologies in E-Governmen-SIGeGov Publications, http://www.csi-sigegov.org/emerging_pdf/ 35_324-330.pdf, pp.324–330. Lee, H. (1998) ‘Do Electronic Marketplaces Lower the Price of Goods?’ Communications of the ACM, Vol. 41, No. 1, pp.73–80. Lee, C.H.M. and Cheng, Y.W. (2003) ‘Comparing smart card adoption in Singapore and Australian universities’, Int. J. Human-Computer Studies, Vol. 58, No. 3, pp.307–325. Legnini, M. (2006) ‘Privacy act’, Privacy and You. Available online at: http://www.doiu. nbc.gov/orientation/privacy_act.html (accessed 2012). Legris, P., Ingham, J. and Collerette, P. (2003) ‘Why do people use information technology? A critical review of the technology acceptance model’, Information & Management, Vol. 40, No. 3, pp.191–204. Lin, S. and Wu, S. (2002) ‘Exploring the impact of online service quality on portal site usage’, Proceedings of the 35th Hawaii International Conference on System Sciences, Vol. 7, p.206. Liu, C. and Amet, K.P. (2002) ‘Raising a red flag on global WWW privacy policies’, Journal of Computer Infonnation Systems, Vol. 43, No. 1, pp.117–127. Luarn, P. and Lin, H. (2005) ‘Toward an understanding of the behavioural intention to use mobile banking’,. Computers in Human Behavior, Vol. 21, No. 6, pp.873–891. Lucas, H.C. and Spitler, V.K. (2000) ‘Implementation in a world of workstations and networks’, Information & Management, Vol. 38, No. 2, pp. 119–128. Mukherjee, A. and Nath, P. (2003) ‘A model of trust in online relationship banking’, International Journal of Bank Marketing, Vol. 21, No. 1, pp.5–15. Mulliah, A. and Stroulia, E. (2009) ‘Mobile devices for collaborative learning in practicum courses’, International Journal of Mobile Learning and Organisation, Vol. 3, No.1 pp.44–59. NECCC (2001) ‘Enterprise electronic government: E2Gov’, Paper presented at the National Electronic Commerce Coordinating Council 2001 Symposium, Las Vegas, Nevada. Nor Shahriza, A., Siti Hawa, D. and Ramlah, H. (2006) ‘Mobile phone applications in academic library services: a students’ feedback survey’, Campus-Wide Information Systems, Vol. 23, No. 1, pp.35–51. Nor, K., Shanab, E. and Pearson, J. (2008) ‘Internet banking acceptance in Malaysia based on the theory of reasoned action’, Journal of Information Systems and Technology Management, Vol. 5, No. 1, pp.03–14. Pin, L. and Hsin-Hui, L. (2004) ‘Toward an understanding of the behavioural intention to use mobile university’, Computers in Human Behavior, Vol. 21, No. 6, pp.873–891. Qadah Ghassan, Z., Taha, R. (2007) ‘Electronic voting systems: requirements, design, and implementation’, Computer Standards & Interfaces, Vol. 29, pp.376–386. Qingfei, M., Ji, S. and Gang, Q. (2008) ‘Mobile commerce user acceptance study in China: a revised UTAUT model’, Tsinghua Science and Technology, Vol. 13, No. 3, pp.257–264. Rogers, E.M. (1995) Diffusion of Innovations, The Free Press, New York. Rogers, E.M. (2003) The Diffusion of Innovation, 5th ed., Free Press, New York. Rupp, W. and Smith, A. (2002) ‘Mobile commerce: new revenue machine or black hole?’, Business Horizons, Vol. 45, No. 4, pp.26–29.
Applying the technology acceptance model to the introduction of mobile voting
47
Sekaran, U. (2006) Research Methods for Business: A Skill-Building Approach, 4th ed., John Wiley & Sons, New Delhi. Szajna, B. (1996) ‘Empirical evaluation of the revised technology acceptance model’, Management Science, Vol. 42, No. 1, pp. 85–92. Taylor, S. and Todd, P. (1995) ‘Understanding information technology usage: a test of competing models’, Information Systems Research, Vol. 6, No. 2, pp.143–176. Telecommunication Regulatory Commission Jordan (2012) Available online at: http://www.trc. gov.jo (accessed on 2012). Teo, T.S.H. and Pok, S.H. (2003) ‘Adoption of WAP-enabled mobile phones among internet users’, The International Journal of Management Science (Omega), Vol. 31,No. 6, pp.483–498. Venkatesh, V. and Davis, F. (2000) ‘A theoretical extension of the technology acceptance model: four longitudinal field studies’, Management Science, Vol. 46, No. 2, pp.186–204. Venkatesh, V., Morris, M.G., Davis, G.B., Davis, E.D. (2003) ‘User acceptance of information technology: towards a unified view’, MIS Quarterly, Vol. 27, No. 3, pp. 425–478. Wu, J-H., Wang, S-C. and Lin, L-M. (2005) ‘What drives mobile health care? an empirical evaluation of technology acceptance’, Proceedings of the 38th Hawaii International Conference on System Sciences, 0-7695-2268-8/05/$20.00 (C) IEEE. Wu, J. and Wang, S. (2005) ‘What drives mobile commerce? an empirical evaluation of the revised technology acceptance model’, Information and Management, Vol. 42, No. 5, pp.719–729. Wu, J-H., Wang, S-C. and Lin, L-M. (2007) ‘Mobile computing acceptance factors in the healthcare industry: a structural equation model’, International Journal of Medical Informatics, Vol. 7, No. 6, pp.66–77. Yang, Z. and Robin, T.P. (2001) ‘Exploring underlying services quality dimension of internet purchasing: suggestions from customers’, Electronic World-of-Mouth, Submit to the 2001 EIASM-Workshop on Management and Innovation of Services. Yi-Shun, W., Hsin-Hui, L. and Pin, L. (2006) ‘Predicting consumer intention to use mobile service’, Information Systems Journal, Vol. 16, No. 2, pp.157–179. Yogesh, M. and Dennis, F. (1999) ‘Extending the technology acceptance model to account for social influence: theoretical bases and empirical validation’, Thirty-Second Annual Hawaii International Conference on System Sciences, Vol. 1, p.1006, IEEE.