APPROACH OF DYNAMIC PRODUCTION SETTINGS FOR MACHINE STRENGTH GRADING Alpo Ranta-Maunus1, Goran Turk2
ABSTRACT: Objective of this paper is to present for machine strength grading a new method for determination of settings which combines the best parts of machine and output control methods, and is based on modern grading technology and utilisation of accumulated data. Key-element of the new method is continuous recording of the grading measurement data in computer and automated adjustment of the settings. Method is verified by using grading data and simulated strength values of 200 000 spruce timbers. Results show that this method can smoothen the effect of quality variation of incoming timber. As a result, the graded timber has less variable strength which fulfils the requirements. Economic benefit is obtained by higher yield to better grades. KEYWORDS: Strength grading, stress grading, timber, spruce, settings, machine control, output control
1 INTRODUCTION 123 Unlikely of most other species, European spruce (Picea abies) has quite similar properties independently of the growth area [11]. However, mechanical properties of spruce can be variable depending on the growth conditions, forestry management practices, dimensions and sawing patterns. In Europe, machine strength grading is normally based on the so called "machine control" method defined in EN 14081-2 [1]. This implies that same settings are used for spruce grown within an administrative growth area. Until now, a growth area is defined as a country or a combination of countries. This method takes care that settings are safe as long as a producer of timber receives its material regularly from the total growth area and as long as the material chosen for determination of settings was representative. There is no limit how much lower the mechanical properties of a single graded sub-sample representing a region or dimension can be. Obviously this may result in situations where the production of a sawmill can have significantly different properties from the values given in EN 338 [2], at least for limited periods of time. Similar situation is in visual grading in which same thresholds are used nation wide and even in larger areas. When correlation of knot size to strength is lower than correlation of machine measured indicating properties to strength, the strength variation of visually graded in-grade timber is larger than that of machine graded timber [3] 1
Alpo Ranta-Maunus, VTT, Lehdokintie 28, FI-13500 Hämeenlinna, Finland. Email:
[email protected] 2 Goran Turk, University of Ljubljana, FGG, Jamova 2, 1000 Ljubljana, Slovenia. Email:
[email protected]
"Output control" method, as it has been adopted in European standard, is based on destructive tests or proof loading. If strength is not within the agreed limits, settings will be adjusted. Recent works show that in a big sawmill, this feedback is much too slow: quality has been changing many times when thousands of timbers have been graded before information is available [4,5]. Even if this feedback would come sooner, it would not be reliable, while based only a small sample. Objective of this paper is to be part in the process of developing a new method which combines the best parts of machine and output control methods, and is based on modern methods of grading. Key-element of the new method is continuous recording of the grading measurement data in computer, evaluation of the quality of timber based on this data and automated adjustment of the settings. This paper will propose a potential method of determination of settings and compare of results obtained to the "machine control" standard method. The objective is to find a simple and robust method which is not as sensitive to quality variation of incoming material as present standardised visual and machine grading methods are.
2 MATERIALS Grading methods are applied to measured strength grading data with addition of simulated bending strength values of each board. 2.1 GRADED MATERIAL The readings of the strength grading equipment GoldenEye-706 at two saw mills in Nordic countries are analysed. The strength grading machine uses X-Ray radiation to determine sizes, knots and density of a board
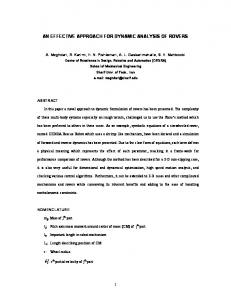
via grey scale image, and combines this information to a frequency measurement to determine dynamic modulus of elasticity Edyn. Using this information the machine estimates the bending strength of each board by calculating its indicating property IP-MOR = fm,mod for bending strength with an equation based on multi linear regression. Also IP-MOE and IP-density are used as grading parameters. In total nearly 200 000 boards of spruce run through the machine. The dimensions varied between w = 75 mm and w = 225 mm in width and t = 40 mm to t = 50 mm in thickness. Sample sizes and average properties are given in Table 1 and variation of material properties, estimated density, MOE and MOR is illustrated in Figure 1. Dimension changes are shown by change in grey scale. Time wise variation at sawmill is larger than expected. Similar variation has been reported also earlier [4].
Figure 1: Grading machine IP-data characterising density, MOE and MOR. Single values in grey and moving averages of 10, 100 and 1000 consecutive timbers of ungraded material
Table 1: Average properties of graded material. Number of sample id means width of timber in mm
Sample
n
ρmean kg/m³
fm,mod,mean N/mm²
SE 100-200 FI 225 FI 200 FI 175 FI 150 FI 125 FI 100 FI 75
22 503 16 065 22 900 7 867 42 609 13 829 53 473 17 334
470 401 423 461 447 449 460 461
44.0 35.6 39.2 43.8 42.3 41.7 42.6 43.4
all
196570
Figure 2: Grading machine IP-data characterising density, MOE and MOR. The moving coefficient of variation (COV) of 100 and 1000 consecutive timbers of ungraded material
The measured IP data of the density, MOE and MOR are presented in Figure 1. All values are shown in different shades of grey, the first 22503 pieces of Swedish data (light grey), the next 16065 Finish data with the width of 225 mm (dark grey), etc. We can clearly see that the widths of the boards have a significant effect on IP values. Specifically, the values for larger boards (225 and 200 mm) exhibit lower values of all IP’s. However, this effect is not the size/height effect known by engineers, but related to timber quality. The coefficients of variation for 100 and 1000 boards for IP of the density, MOE and MOR are shown in Figure 2. In general, the COV does not differ as much as the moving average values (compare to Figure 1). The only exception is the IP-MOR for the largest width (225 mm), for which a considerably higher COV are observed. 2.2 SIMULATION METHOD The simulation is based on available data. The IP’s for strength, MOE and density were obtained from the MiCROTEC machine GoldenEye-706. Totally there were 197490 pieces for which the IP’s were known. Among those there were 920 pieces (from the Combigrade project [6]) for which the actual MOE’s and strengths were also known. From the remaining 196570 pieces only IP’s were known. The basic statistical analysis revealed that the averages, variances and correlations matrix between IP’s are very similar (see Table 2). Therefore, it was assumed that the data corresponds to the same population. A procedure which includes condensation of the transformation matrix is used to generate such MOR and MOE that the averages, variances and correlations correspond to those obtained in Combigrade [6]. Table 2: Basic statistical data of two data bases
Combigrade data (920 boards) IP MOR IP MOE IP density Averages 43.96 11805 439.7 Standard deviations 8.90 2273 43.58 Correlations 1 0.963 0.692 0.963 1 0.809 0.692 0.809 1 0.810 0.778 0.553 0.915 0.947 0.754 Additional data (196570 boards) IP MOR IP MOE IP density Averages 41.86 11889 448.7 Standard deviations 9.54 2436 49.94 Correlations 1 0.937 0.687 0.937 1 0.816 0.687 0.816 1
MOR
MOE
43.21
11622
10.79
2381
0.810 0.778 0.553 1 0.804
0.915 0.947 0.754 0.804 1
Simulation procedure The generation of normally distributed random vector with known variance−covariance matrix is carried out by the following procedure: 1. Perform a Cholesky decomposition of variancecovariance matrix Σ of random vector Y (determination of H ). 2. Generate a set of independent random variables with standardized normal distribution (generation of random vector X ). 3. Since one part of the vector Y is known, the following procedure includes the condensation. We denote Y1 as the known part of the vector normalized to the zero mean, whereas Y2 is the unknown part. Correspondingly the uncorrelated normal random vector X and transformation matrix H is divided into two parts:
0 ⎤ ⎡ X1 ⎤ ⎡ Y1 ⎤ ⎡ H11 ⎢Y ⎥ = ⎢H ⎥⎢ ⎥ . ⎣ 2 ⎦ ⎣ 12 H 22 ⎦ ⎣ X 2 ⎦ The unknown part of the correlated random vector is obtained from the last equation as: −1 Y2 = H12 H11 Y1 + H 22 X 2
(1)
4. Perform an additional transformation to obtain a random vector Z with non-zero mean values
Z = Y + E[Z]
(2)
[ ]
where E Z is determined so that the averages of the first three variables are equal to the actual data, and the last two is such that the difference between IP mean value and actual mean value corresponds with the difference of the same averages from Combigrade data.
Table 3: Basic statistical data of simulated data bases
Simulated data (196570 boards) IP MOR IP MOE IP density Averages 41.86 11889 448.7 Standard deviations 9.54 2435 49.9 Correlations 1 0.937 0.687 0.937 1 0.816 0.687 0.816 1 0.828 0.775 0.561 0.896 0.954 0.765
MOR
MOE
41.09
11704
11.31
2533
0.828 0.775 0.561 1 0.799
0.896 0.954 0.765 0.799 1
European "machine control" method is given in standard EN 14081-2 [1]. Settings are published in EN14081-4 [7]. Main features of the method for determination of settings are: - at least 900 test specimens representing the growth area are needed for a new machine - optimum grades are determined for each specimen based on results of destructive testing - "cost matrix" puts price on wrong grading by grading machine, and there is a limit for allowed unjustified upgrading - settings will be determined so that requirements put to grade determining properties are fulfilled (special rule for combinations of sub-samples, individual sub-samples need not fulfil requirement), cost matrix limit is fulfilled and a few rejects are below the lowest grade. The method has many details which make it not easily understood and it is also quite sensitive the data being sampled [8]. Basically, the use of standard settings gives required properties of in-grade timber. However, local variations of raw material quality come through the grading process, if the material to be graded has different quality from the sample used for determination of settings [5, 9]. This will be discussed in next section where results of a recent analysis [3] are summarised. 3.2 VARIATION OF STRENGTH WHEN USING MACHINE CONTROL METHOD Data of all 8 samples of Table 1 is utilised in such a way that two sub-samples of 2000 are selected from each sample (the values where moving average of fm,mod of 2000 consecutive timbers in the order they were graded, attains its maximum and minimum values). As a result we obtain 16 sub-samples of 2000 specimens each with grading machine measured values and simulated strength values. One of the sub-samples is shown in Figure 3, the lower Swedish sub-sample, which is the median sample of all 16. This sub-sample has r2=0.69 between simulated and modelled strength which is nearly same in the subsamples. All 16 sub-samples are graded according to EN 14081-4 settings for GoldenEye-706 and Nordic spruce in bending. Grading is made to three grade combinations: 1. C40-C30-C18-rej 2. C40-C24-rej 3. C27-rej
(3)
f m ,05 = 0.85 f m ,mod,mean − 6.65
(4)
f m ,05 = 0.75 f m ,mod,mean − 7.10
(5)
f m ,05 = 1.15 f m ,mod,mean − 22.03
(6)
f m ,05 = 1.25 f m ,mod,mean − 20.56
(7)
90 80 70 60
2
3.1 EN 14081-2 METHOD
f m ,05 = 0.56 f m ,mod,mean + 10.30
fm,sim [N/mm ]
3 METHODS OF DETERMINATION OF SETTINGS FOR GRADING MACHINES
Characteristic strength of each graded sub-sample will be compared to the "quality of the timber", mean value of fm,mod of in-grade timber. Characteristic strength of in-grade timber can be predicted by average of IP of the same timber as illustrated by Figure 4. Regression lines are shown for C30, C27 and C24, and equations for all grades are as follows: C40: Equation (3), C30: Equation (4), C27: Equation (5), C24: Equation (6) and C18: Equation (7):
C40 50
C30
40
C18 rej
30 20 10 0 0
20
40
60
80
2
fm ,m od [N/mm ]
Figure 3: Example of simulated strength values, subsample "SE 100-200 lower"
50 40
C 27
2
After the simulation of the values of MOE and strengths of 196570 boards was done, the basic statistic analysis confirmed that the properties of the simulated data are very similar to the properties of Combigrade data (see Tables 2 and 3). Densities were not simulated because IP-density values are expected to be at least as accurate as densities measured in laboratory.
fm ,s im ,0.05 [N /mm ]
2.3 SIMULATED DATA
30
C 24 C 40
20
C 30 10
C 18
0 20
30
40
50
60
2
f m ,m o d ,m ea n [N/mm ]
Figure 4: Characteristic strength of in-grade timber vs. average IP of in-grade timber [3]
Characteristic strength of in-grade timber is lower than required when yield to any grade is more than 80% and
the average quality of timber is lower than in the sample used for determination of settings. In these cases strength is dependent of material to be sorted so that in the highest quality case of 16 analysed samples fm,05 of C24 is 27 N/mm2 and in the lowest 17 N/mm2. For C27 the results are between fm,05=20...30 N/mm2. In C40-C24 grading of the better half of material, strength of both grades is above requirement, and there would be potential to allow higher yield to C40. When grading to three grades C40-C24-C18, yield to any grade is below 80%, and strength is generally above required value, for high quality material more than for low quality material. Obtained values are however closer to requirement than in case of grading to C40-C24 or to C27 alone. More even strength values could be obtained if we would use dynamic settings adapting information of the previously graded timber collected by the grading machine. Based on Equations (3) to (7) we can conclude that one N/mm2 higher mean of IP results in 0.6 to 1.2 N/mm2 higher characteristic strength of in-grade timber. This information can be utilised in determination of dynamic settings. Basically the approach is to adjust settings for each board based on the mean IP of certain number of previous boards. 3.3 SIMPLIFIED PREDICTION LIMIT METHOD The prediction limit method was presented in CIB W18 meeting [10]. When sample size is large enough and no distinction needs to be made between predicted values and sample estimates, and settings (thresholds fmod,th) in grading for modelled strength f mod are of the form: fmod,th = f05,req + Δ
(8)
th
where f05,req is the required 5 percentile of strength and Δ depends the variability of material properties and applied confidence limit [9]. Here we use Δ = s which is standard deviation of random error ε when estimating strength by linear regression. The average s (save) is easily calculated from test data. Based on results of Gradewood project [11] for bandwidths, the strength dependence of s is approximated for bending of European spruce on average as follows
s = 0.25save f 050.,4rqm
(9)
control settings should be continuously adapted to the material quality, based on grading machine readings only. Destructive quality control testing is not effective for control of settings, because results are not representative for the material graded currently (they reflect the past), and relatively small numbers tested include considerable statistical uncertainty. This proposal has two parts: determination of initial settings (including characterisation of the material used for initial destructive tests) and determination of production settings, the method to continuously adjust the settings to the material quality under grading. 3.4.1 Initial settings Method proposed for determination of initial settings is combination of simplified EN 14081-2 method and prediction limit method. Simplification means ignoring "cost matrix" and division to sub-samples in EN-method. New is the change of definition of characteristic value of strength: it is the 5th percentile, but not higher than 1.5 times the 0.5 percentile value. Initial settings for a species can be determined by using a random sample of a minimum of 900 as follows: - new definition of characteristic strength will be used as given above - modelled strength based on regression equation is used as IP - total sample is analysed as one sub-sample when determining settings - number of timbers in each grade (including reject) shall be minimum of 200 - settings are determined so that requirements for grade determining properties are fulfilled. However, no threshold for strength must be lower than requirement for characteristic value: fmod,th > f05,req . - settings of the lower grades (which cannot be determined because of too few rejects) shall be determined by the use of Equation (8) and choosing Δ = s, which will be calculated by the use of Equation (9). When initial settings are being determined, mean values of grade indicating properties such as fmod,mean,ref in each grade / grade combination will be documented to be used as reference when production settings are determined. 3.4.2 Production settings Settings to be used in production will be adjusted for each timber separately as follows
where required characteristic strength f05,rqm is given in N/mm2. The advantage of this method is that obtained settings are quite safe and robust. For the same confidence, sample size can be smaller than in EN14081-2 method.
f mod,th = f mod,th ,ini + α ( f mod,mean,ref − f mod,mean,nw ) (10)
3.4 PROPOSAL FOR OUTPUT CONTROL
where f mod,th means settings (thresholds), f mod,mean ,nw
European standard includes as an option the output control method based on CUSUM method to be applied to destructive quality control test results. Recently, there have been proposals that more information could be obtained by statistical analysis of grading machine readings [12]. In this paper it is proposed that output
is the average of last nw values graded to the grade by using initial settings, f mod,mean ,ref is the average value in reference sample used for determination of initial settings, and α is parameter to be optimised. In this paper we use
α = 1.75 − 0.03C
(11)
where C means C-class (i.e. C=24 for C24). Equation (11) is based on slopes of regression lines in Figure 4 (Equations (3) to (7)), which indicate that characteristic strength of in-grade timber can be well predicted by average IP-MOR of the same sample. When having more than one IP, same method is applied to all IP's.
4 VERIFICATION 4.1 DEFINITION OF EXAMPLES Initial settings are determined following the method described above based on Combigrade project spruce (n=920). Received results are shown in Tables 4 and 5 for grade combinations C40-C30-C18 and C40-C24. For reference, EN 14081-4 settings are given in Table 6. Settings and reference values given in Tables 4 and 5 are applied to samples with high, medium and low quality. High quality sample (n=1000) has consecutive pieces in production where mean IP-MOR was high fmod,mean = 49.1 N/mm2, medium (n=50000) has fmod,mean = 44.0 N/mm2, and low (n=11000) fmod,mean =35.7 N/mm2. The window size nw i.e. the number of previous boards in a specific grade used to evaluate the average is taken to be 100. Table 4: Initial settings (method of section 3.4.1)
Grade
f mod,th
Emod,th
ρ mod,th
(combination)
N/mm2
N/mm2
kg/m3
C40 C30(C40/C30/) C18(C40/C30/) C24(C40/C24)
47.5 26.8 20.7 26.6
12000 10300 5500 5500
410 370 310 320
Table 7: Requirements
f05 f005 Emean ρ05
2
N/mm N/mm2 N/mm2 kg/m3
C40 40 26.7 13300 420
C30 26.8 17.9 11400 380
C24 21.4 14.3 10450 350
C18 16.1 10.7 8550 320
Table 7 gives European standard requirements for grades (kv-factor for strength and 0.95 factor for MOE are applied). In addition, the requirement applied in this analysis to 0.5 percentile of strength, f005 > 0.67f05 is shown. 4.2 COMPARISON BETWEEN HIGH, MEDIUM AND LOW QUALITY TIMBER The test samples of high, medium and low quality timber were graded to combination C40-C24 by using standard settings of EN 14081-4, initial settings only given in Table 4, and production settings proposed for output control method in Equation (10) and in related text. Obtained averages of production settings are given in Table 8. They are higher than initial settings for low quality material and lower for high quality material as expected. Yields are given in Table 10. For high quality material, the share of rejects is very low in all cases, but proposed output control method gives higher yield to highest grade C40. In low quality material, the share of rejects is much higher in output control method. Obtained values of grade determining properties are given in Table 9 as ratio to requirement (Table 7). For high quality timber all values exceed requirement which is not surprising. For medium quality timber all values exceed requirement except machine control settings of EN 14081-4 which gives 0.5 percentile of bending strength 13.4 N/mm2 for C24 which is 94% of requirement in Table 7. This requirement is not applied in present standard and accordingly this value is not violation of rules.
Table 5: Reference values related to initial settings
Grade Yield C40 C30 C18 C24
f mod, mean
Emod, mean
ρ mod, mean
N/mm2
N/mm2
N/mm2
53.5 43.0 33.9 40.3
14230 11623 9102 10829
475 438 398 425
0.33 0.42 0.25 0.64
Table 6: EN 14081-4 settings
Grade
f mod,th
Emod,th
ρ mod,th
(combination)
N/mm2
N/mm2
N/mm2
C40
49.6
12000
410
C30(C40/C30/) C18(C40/C30/) C24(C40/C24)
36.1 15.3 15.3
10000 5500 5500
370 310 320
Lowest strength values are obtained for the low quality material sample. For EN 14081-4 settings all values obtained for C40 are acceptable, but none of the requirements are fulfilled in case of C24. Lowest ratios were obtained for strength, where 5 percentile value is 17.5 N/mm2 which is 82% of requirement and 0.5 percentile as low as 9 N/mm2. Initial settings applied without feed back of material quality give acceptable results for strength but not fully for MOE and density of C24. When production settings are used in output control method, all requirements are met, but number of rejects is very high in case of low quality timber. This reflects the fact that we cannot obtain better grades than the material has. Use of this method might lead to the use of low grades such as C14 in all combinations in order to avoid high number of rejects during such days when low quality raw material is purchased.
Table 8: Mean production settings obtained for high, medium and low quality material
Mean production settings high/medium/low Grade (combination) C40 C24(C40/C24)
f mod,th
Emod,th
ρ mod,th
2
2
kg/m3 396 395 420 294 291 316
N/mm 46.1 47.6 48.4 26.4 27.1 30.0
N/mm 11294 11633 12126 4777 4877 6050
Table 9: Ratio of obtained characteristic values to requirements given in Table 7 when three different settings are applied
EN 14081-4 Initial settings C40 C24 C40 C24 high quality material f05 1.07 1.14 1.04 1.17 f005 1.48 1.08 1.20 1.11 1.15 1.08 Emean 1.18 1.10 ρ05 1.06 1.09 1.05 1.09 medium quality material f05 1.05 1.09 1.01 1.17 f005 1.33 0.94 1.26 1.21 1.11 1.07 Emean 1.14 1.08 1.08 1.12 1.06 1.13 ρ05 low quality material f05 1.04 0.82 1.00 1.04 f005 1.39 0.62 1.33 1.10 1.04 Emean 1.07 0.93 0.97 1.00 0.98 1.00 ρ05 0.99
Production settings C40 C24 1.02 1.18 1.14 1.04
1.14 1.09 1.06 1.08
1.01 1.27 1.11 1.06
1.19 1.24 1.08 1.13
1.02 1.37 1.06 1.01
1.16 1.27 1.02 1.03
Table 10: Yields obtained to C40, C24 and reject
Initial settings C40 C24 rej C40 C24 rej high quality material 0.49 0.51 0.00 0.57 0.42 0.01 medium quality material 0.27 0.73 0.00 0.35 0.62 0.03 low quality material 0.06 0.90 0.04 0.09 0.72 0.19 EN 14081-4
Production settings C40 C24 rej 0.62 0.37 0.01 0.35 0.61 0.04 0.08 0.60 0.32
4.3 VERIFICATION OF THE GRADING PROCEDURES ON ALL AVAILABLE DATA The measured IP data of 195071 boards are included in verification. This sample was divided in the sequence of sub-samples of size 2000. For each of 98 sub-samples,
the grading using the EN 14081-4 settings and production settings were used for grading. In all cases the yield to every strength class is determined, and the check if the graded material fulfils the requirements from Table 7 is performed. In the analysis, the number of cases (sub-samples) for which the graded material does not fulfil the requirements is counted. For determination of production settings by Equation (10) different window sizes nw were tried. Two sets of initial settings were tested. The basic initial settings are presented in Table 4. However the results obtained by these settings lead to larger number of rejects. Therefore the alternative initial settings were changed so that the initial setting for IP-MOR of the lowest grade is equalled to EN 14081-4 settings. In fact, this trial was not fully in accordance with the method, because new reference value was not calculated for the lowest grade, but values of Table 5 were used. The results for grade combination C40-C30-C18 show that different window size does not have a major effect on the yield, see Table 11. On the other hand the number of cases where the grading requirements from Table 7 are not fulfilled depends strongly on the window size. The window sizes larger than 400 lead to minimum cases of wrongly graded batch, see Table 12. Production settings method exhibits fewer number of wrongly graded sub-samples regardless the window size. Same conclusions can be derived for the grade combination C40-C24 (see Tables 13 and 14). The comparison of production settings for MOE and density shows that the production settings for MOE are much more stable than the production settings for density (see Figure 6). Table 11: Yields obtained to C40, C30, C18 and reject for 195071 boards
EN 14081-4 settings C40 C30 C18 Rejects Total 0.199 0.515 0.279 0.006 1.00 Production settings method – Initial settings according to Table 4 window C40 C30 C18 Rejects Total size 100 0.258 0.492 0.210 0.040 1.00 300 0.259 0.493 0.210 0.038 1.00 500 0.259 0.494 0.209 0.038 1.00 1000 0.259 0.495 0.209 0.038 1.00 Production settings method – Initial settings for MOR (C18) is lowered to 15.3 window C40 C30 C18 Rejects Total size 100 0.258 0.492 0.230 0.019 1.00 300 0.259 0.493 0.230 0.018 1.00 500 0.259 0.494 0.229 0.017 1.00 1000 0.259 0.495 0.229 0.017 1.00
Table 12: Percentage of sub-samples in which the requirements from Table 7 were not fulfilled ( total 98 sub-samples)
EN 14081-4 settings C40 C30 C18 9.2% 4.1% 0.0% Production settings method – Initial settings according to Table 4 window size C40 C30 C18 100 3.1% 4.1% 0.0% 300 2.0% 1.0% 0.0% 400 2.0% 0.0% 0.0% 500 2.0% 0.0% 0.0% 1000 2.0% 0.0% 0.0% Production settings method – Initial settings for MOR(C18) is lowered to 15.3 window size C40 C30 C18 100 3.1% 4.1% 0.0% 300 2.0% 1.0% 0.0% 400 2.0% 0.0% 0.0% 500 2.0% 0.0% 0.0% 1000 2.0% 0.0% 0.0% Table 13: Yields obtained to C40, C24 and reject for 195071 boards
of 100 it happened twice that the production settings for lower grade exceeded the settings for the higher grade. Certainly, such settings do not have a reasonable justification. Larger window size (e.g. 300) overcomes this problem (see Figure 5). Table 14: Percentage of sub-samples in which the requirements from Table 7 were not fulfilled (total 98 sub-samples)
EN 14081-4 settings C40 C24 9.2% 19.4% Production settings method – Initial settings according to Table 4 window size C40 C24 100 3.1% 2.0% 300 2.0% 2.0% 400 2.0% 1.0% 500 2.0% 1.0% 1000 2.0% 0.0% Production settings method – Initial settings for MOR(C24) is lowered to 15.3 window size C40 C24 100 3.1% 7.1% 300 2.0% 8.2% 400 2.0% 7.1% 500 2.0% 7.1% 1000 2.0% 10.2%
EN 14081-4 settings C40 C24 Rejects Total 0.199 0.793 0.007 1.00 Production settings method – Initial settings according to Table 4 window C40 C24 Rejects Total size 100 0.258 0.644 0.098 1.00 300 0.259 0.646 0.095 1.00 500 0.259 0.647 0.094 1.00 1000 0.259 0.648 0.092 1.00 Production settings method – Initial settings for MOR(C24) is lowered to 15.3 window C40 C24 Rejects Total size 100 0.258 0.701 0.041 1.00 300 0.259 0.702 0.039 1.00 500 0.259 0.703 0.037 1.00 1000 0.259 0.713 0.027 1.00 The reason for noncompliance with the requirements from Table 7 is different for different grades. In the cases of grades C40 and C30 the required density is the predominant reason, whereas in grade C24 the requirement for MOR as well as density is generally the reason for wrongly graded sub-sample. The production settings method was tested on almost 200000 boards. Quite surprisingly for the windows size
Figure 5: Production settings of IP- MOR for the windows size 100 and 300 when grading to C40-C30-C18
supported by TEKES in Finland and by the research project (L2-2214-0792) financed by the Slovenian research agency. Stora Enso Timber and MiCROTEC are owners of the strength grading data of sawmills and they kindly forwarded the data to be analysed. The contributions from funding organisations and other support are gratefully acknowledged.
REFERENCES
Figure 6: Production settings for IP-MOE and IP-density for the windows size 300 when grading to C40-C30-C18
5 CONCLUSIONS New proposed method for determination of settings in machine strength grading, one for initial settings and another for adaptive production settings have been verified for grade combinations C40-C30-C18 and C40C24 of Nordic grown spruce. New method gives acceptable values for grade determining properties, they all fulfil requirements also when quality of incoming timber changes to low. In the same situation, machine control method gives high yields but all grade determining properties are below the requirement for grade C24. For high and normal quality incoming timber the new method gives higher yield to the highest grade. This paper shows that the proposed method can be safely used in Nordic growth area for grading of spruce to Cgrades. The proposed method could work also on timber segregated in earlier stages of processing (log sorting, green grading). It remains to be shown, if this method would work also independently of growth areas and for other species. Also it should be verified with tension strength grading data even if it is not expected to be a problem for spruce.
ACKNOWLEDGEMENT This work is part of Gradewood-project which is based on a feasibility study made by the European wood industries under the Roadmap 2010 Building With Wood programme, and this project is supported by the industry via CEI-Bois. The Gradewood-project belongs to the Wood Wisdom.Net-programme. This work was partly
[1] CEN: EN 14081-2: 2005 Timber structures – Strength graded structural timber with rectangular cross section – Part 2: Machine grading; additional requirements for initial type testing. European Committee for Standardization. 69 p. , 2005. [2] CEN: EN 338: 2009 Structural timber – Strength classes, European Committee for Standardization, 2009. [3] Ranta-Maunus A.: Variability of strength of ingrade spruce timber. In: COST Action E53 Final Conference in Edinburgh, 2010. [4] Bacher M.: GoldenEye-706 Quality shifts. In: COST Action E53, Topic 4: Quality control in production of wood and wood based material. Meeting in Bled, Slovenia. 5p. 2009. [5] Ranta-Maunus A., Denzler J. K.: Variability of strength of European spruce, In: CIB W18-meeting, paper 42-6-1, 10 p., 2009. [6] Hanhijärvi A., Ranta-Maunus A.: Development of strength grading of timber using combined measurement techniques – Report of the Combigrade-project – phase 2. VTT Publications 686, Espoo, Finland, 55 p., 2008. http://www.vtt.fi/inf/pdf/publications/2008/P686.pdf [7] CEN: EN 14081-4:2009 Timber structures – Strength graded structural timber with rectangular cross section – Part 4: Machine grading – Grading machine settings for machine controlled systems". European Committee for Standardization. 69 p., 2009 [8] Turk G., Ranta-Maunus, A.: Analysis of strength grading of sawn timber based on numerical simulation. Wood Sci. Technol., 38(7): 493-505, 2004. [9] Ranta-Maunus A.: Comparison of four basic approaches in machine strength grading. In: COST Action E53 Conference in Lisbon, 2009. [10] Ziethén R., Bengtsson C.: Machine Strength Grading – a New Method for Derivation of Settings. In: CIB W18-meeting, paper 42-5-1 ,12 p, 2009. [11] Ranta-Maunus A. (ed): Strength of European timber. Part 1. Analysis of growth areas based on existing test results. VTT Publications 706, Espoo, Finland. 174 p., 2009. http://www.vtt.fi/inf/pdf/publications/2009/P706.pdf [12] Sandomeer M., Köhler J., Faber M. H.: Probabilistic output control for structural timber – Modelling approach. In: Proc. of CIB-W18 Meeting, Paper 455-1, 12 p., 2008.