APPROACH TO SPATIAL AVALANCHE FORECASTING USING A NON-HYDROSTATIC MODEL AND A SNOW COVER MODEL Satoru Yamaguchi*, Atsushi Sato, Katsushi Iwamoto, Sento Nakai Nagaoka Institute of Snow and Ice Studies, NIED, Nagaoka, Niigata, Japan. Michael Lehning Swiss Federal Institute for Snow and Avalanche Research, Davos Dorf, Switzerland. ABSTRACT: To estimate the spatial variation in snowpack characteristics, two numerical models, a regional meteorological model (NHM) and a snow cover model (SNOWPACK), were connected on the Sea of Japan side, one of the heaviest snowfall areas. Each simulation using NHM was calculated with 2kmx2km grid scales and 21 hours predictive time. A series of NHM simulation results in January 2003 at each grid were used as input data of SNOWPACK to simulate variation in snowpack characteristics. NHM simulations of air temperature, relative humidity, and wind speed were in relatively good agreement with measurements. On the other hand, the quantity of precipitation simulated by NHM was much smaller than the measurements. Thus, NHM requires improvement of the precipitation simulation process. Snow depths from the coastal region to the mountainous region were simulated using SNOWPACK with the results of NHM excepting precipitation. Although the trends of snow depth variation were relatively reconstructed, the simulated amplitudes of variation in snow dept were smaller than the measurements at each site. The simulation results of snow type at NISIS agreed with the measurements relatively well, though unrealistic types “faceted particles” sometimes appeared in the model. In order to forecast spatial avalanche, improvements of each model, along with more detailed analyses, will be needed. Keywords: snow disaster, avalanche forecast, snow cover model, non-hydrostatic model, Japan. 1. INTRODUCTION The Japanese Island experiences heavy snowfall on the Sea of Japan side, and many snow disasters including avalanches occur every winter. To mitigate the risk presented by snow disasters, the Nagaoka Institute of Snow and Ice Studies (NISIS) is creating the system using several numerical models to forecast such disasters (Sato and others, 2004). In this system, ______________________ *Corresponding author address: Satoru Yamaguchi, Nagaoka Institute of Snow and Ice Studies, National Research Institute for Earth Science and Disaster Prevention (NIED), Suyoshi-machi, Nagaoka-shi, Niigata-ken, 9400821, Japan; tel: +81-258-35-7522; fax: +81-258-35-0020; email:
[email protected] the snow cover model is adopted to estimate the variations in characteristics of snow and plays an important role in forecasts. Although the snow cover model requires data on several
meteorological elements, there are only a few meteorological stations in mountainous areas. Thus, forecasting snow disasters such as avalanches in mountainous areas requires estimating meteorological conditions by a numerical model. The purposes of this study are to establish a method for combing a non-hydrostatic model (NHM) and a snow cover model (SNOWPACK), and to examine the problems using these models in combination. 2. TEST SITE The area in which this study was conducted is located on the Sea of Japan side, one of the heaviest snowfall areas in Japan. There are several automatic weather stations (AWS) set by NISIS in the mountainous areas. They are distributed from 100 to 1300 m a.s.l. (Fig.1b)). The elements of meteorological data at each meteorological observation site are shown in Table 1. Snowpit investigations were carried out at NISIS almost every day in the winter of 2002/03. The elements examined in the snowpit
199
investigation were snow depth, stratigraphic factors, snow type, snow density, snow temperature, and liquid water content. These parameters were measured at 5 to 10 cm intervals.
snowpack characteristics. Due to differences of meteorological conditions between European Alps and Japan, several revisions were carried out to apply SNOWPACK to heavy snowfall areas in Japan (Yamaguchi and others, 2004).
3. METHODS NHM, developed by the Japan Meteorological Agency (JMA), is a multipurpose non-hydrostatic atmospheric model that includes explicit cloud physics schemes (Ikawa and Saito, 1991; Saito and others, 2001). It was recently adapted for operational weather forecasts in Japan. NISIS has attempted to apply the model to heavy snowfall areas with higher resolution (Iwamoto and others, 2004). SNOWPACK, developed by the Swiss Federal Institute for Snow and Avalanche Research (Bartelt and Lehning, 2002; Lehning and others, 2002a; Lehning and others, 2002b), is one of the most valid snow cover models, and has been used to estimate the likelihood of avalanches in Switzerland (Bartelt and Lehning, 2002, Lehning and others, 1999). The model requires meteorological parameters (air temperature, relative humidity, wind speed, short wave radiation, long wave radiation, and precipitation) as input, and its output provides predicted a) NHM 10km Sea of Japan
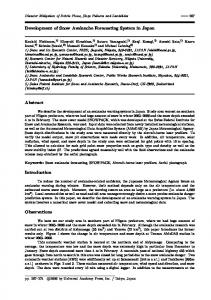
The NHM simulation utilized a nested grid system with an outer grid of 10km spacing and an inner grid of 2km including the area from the Sea of Japan to the mountain range of the water dividing the Sea of Japan region and the Pacific Ocean region of Japan (Fig. 1a)). The model can simulate the meteorological conditions for the 21 hours after input of the initial condition data, though the data from 10 to 21 hours are useful because of the spin –up of the model. The initial data are distributed by JMA every 12 hours (9:00 A.M. and 9:00 P.M.), thus a time series of simulated meteorological data, as a set, could be supplied to SNOWPACK by NHM. The elements predicted by NHM were air temperature, relative humidity, wind speed, wind direction, short wave and long wave income radiations, and precipitation. In this study, one time series (4 to 18 January in 2003) was chosen for simulations. First, to evaluate meteorological conditions simulated by NHM, each data set was compared with the corresponding measurements. Then snow depths simulated by SNOWPACK using NHM results were compared with measurements at
NHM 2km Pacific Table 1. The elements of meteorological data at each site. A: air temperature, H: relativeOcean humidity, W: wind speed, R: Short wave radiation, P: precipitation, SD: snow depth. Location Nishiyama Yakishi b) (NY) Nagaoka Institute of Snow and Ice Studies (NISIS) Tochio Kiyamazawa (TK) Sumon Ordaira (SO) Myoko Sasagamine (MS)
MS
37˚28’N 138˚43’E 37˚25’N 138˚53’E
Altitude (m a.s.l.) 330
A, H, W, P, SD
98
A, H, W, R, P, SD
250
A, H, R, P, SD
510
A, W, R, P, SD
1310
A, R, P, SD
37˚25’N 138˚59’E 37˚23’N NY TK139˚04’E 36˚52’N NISIS SO 138˚05’E
0
40km
Elements
each meteorological observation site. Moreover, the characteristics of snow cover simulated by
Figure 1: Location of study area a) Simulation area of NHM b) Simulation area of NHM (2kmX2km) and locations of AWS.
200
SNOWPACK were compared measurements at NISIS.
with
AirRelative Air Air Air AirRelative Relative temperature temperature temperature temperature temperature humidity o o o humidity o humidity ( C) ( C) (oC) ( C) ( C) (%) (%) (%)
20 NY 10 0 -10 -20
the
20 NISS 10 0 -10 -20
4. RESULTS AND DISCUSSION 4.1 Comparisons with simulation results of NHM and measurements
20 TK 10 0 -10 100 -20 75 20 50 SO 10 25 00 NY -10 100 -20 75 20 50 MS 10 25 NISIS 00 -10 100 -20 754 9 14 19 50 January in 2003 25 TK Figure 2:0Comparisons between variation in air temperature4 simulated9 by NHM 14 (straight lines) 19 January and measurement (dot lines) in at 2003 each AWS.
Fig 2 shows the comparison results of air temperature. There is strong resemblance between simulated variations and measured variations, though the model occasionally can not follow the variations in measured air temperature. Comparisons of relative humidity show a trend similar to that of comparisons of air temperature (Fig.3). These results indicate that air mass transformation may be reconstructed in the model. For wind speed, although large differences between the simulation and the measurement occasionally occurred, a similar trend was shown relatively (Fig. 4). One reason the model sometimes shows a wind speed different from that of measurement might be some failure in the reconstruction of the effects of the landform.
Figure 3: Comparisons between variation in relative humidity simulated by NHM (straight lines) and measurement (dot lines) at each AWS.
4.2 Comparisons with simulation SNOWPACK and measurements
results
of
Precipitation Wind Precipitation Wind (mm/h) speed speed (mm/h) (m/s) (m/s)
8 NY 612 NY 49 26 03 0 8 12 6 NISIS NISIS 49 6 2 03 0 812 6 9 TKSO 46 23 00 9 14 19 8 4 January in 2003 6 SO 4 Figure 2 4: Comparisons between variation in wind speeds0 simulated by NHM (straight lines) and measurement (dot lines) at each AWS. 8 6 MS 4 2 0 4 9 14 19 January in 2003 Precipitation Precipitation Precipitation Wind (mm/h) (mm/h) (mm/h) speed (m/s)
On the other hand, each quantity of precipitation simulated by the model was much smaller than the corresponding measurement, while the precipitation events in the model appeared to occur with timing similar to that of measured precipitation (Fig. 5). An explanation for the model’s underestimation of the mass of precipitation is not yet clear, but this problem should be resolved summarily in order to use NHM to forecast snow disasters. Dramatic lack of precipitation quantity would render inaccurate simulation of snow cover characteristics. Thus, in this study, to eliminate errors arising from unrealistic simulated precipitation values, measured precipitations were adopted for use with SNOWPACK simulation. In the model, the data from pit work on simulation start day were adopted as initial condition (distribution of snow type, density, temperature, etc.).
Figure 5: Comparisons between precipitation simulated by NHM (straight lines) and measurement (dot lines) at each AWS.
201
Snow depth (cm)
100 75 NISIS 50 25 0 150 125 TK 100 75 50 250 225 SO 200 175 150 325 300 MS 275 250 225 4
9 14 January in 2003
19
Figure 6: Comparisons between simulated variation in snow depth (straight lines) and measurement (dot lines). Fig. 9 shows the comparisons between the density measurements and simulations. The figure indicates that simulated densities were in relatively good agreement with the measurements. The mean deviation from measured density (measurements/simulation) was about 20%. Stability evaluations of avalanches are frequently discussed in terms of the stability index (SI) calculated using shear strength (Σ) and overburden of snow weight. According to Jamieson and Johnston (2001), Σ is the function of snow type and snow density (ρ), as follows: 1.73
Σ I = 14.5⎛⎜ ρ ⎞⎟ ⎝ ρi ⎠ (Snow type I), (1)
Σ II = 18.5⎛⎜ ρ ⎞⎟ ⎝ ρi ⎠ (Snow type II). (2) Here, ρi is the density of ice (917 kgm-3), snow type I includes “precipitation particles”,
202
2.11
Amount of precipitation (mm)
Fig. 7 shows the distribution of precipitation relative to air temperature in the winter season (2002/03) at NISIS. The peak of distributed precipitation was located at around 0 o C; therefore, even a small error of simulated air temperature, like that shown in Fig. 2, would have a large influence on snow depth. Fig 8 indicates variations in simulated and measured snow types. The simulation showed trends similar to those of the measurements; that is, malt forms appeared during all simulation period, though the simulated change speed of the change of (lightly) compacted snow into melt forms was slower than that of the measurements. The model occasionally constructed unrealistic snow types, such as “faceted particles”, which were never observed at NISIS during the simulation period. The cause of the appearance of unrealistically faceted particles would result from the larger simulated temperature gradients associated with the lower temperatures because of lack in simulated energy given into snow.
Snow depth Snow depth Snow depth Snow depth (cm) (cm) (cm) (cm)
Fig. 6 shows the comparisons of variation in snow depth at each point. Each simulated snow depth shows relatively good agreement with measurements, though the simulated variation ranges in snow depth were smaller than the measurements. There are two possible explanations for underestimations of the snow depth peaks in the model. One is the error of precipitation measurement. Each precipitation value used in this study was measured using precipitation gauges. It is reported that the catch rate of precipitation varies from approximately 60% to 100% with dependence on gauge type and wind speed, and some formulas to correct precipitation quantity have been suggested (Yokoyama and others, 2003). Such formulas were not used to correct precipitation values in this study because some meteorological stations did not obtain the wind speed data. Hence, the simulated snow depth would show a higher peak if precipitations were corrected by the formulas. The second is the influence of error in simulated air temperature. The air temperature of the division between rain and snow was defined as 0 ˚C in this study, thus error in air temperature affects snow depth directly.
100 75 NY 50 25 0
200 150 100 50 0 -20 -10 0 10 20 Air temperature (oC)
Figure 7: Relationship between precipitation and air temperature at NISIS from Dec. 2002 to Mar. 2003.
“decomposed/fragmented snow”, and “Rounded grain”, while snow type II includes “faceted crystals” and “depth hoar”. Using these formulas, influences of the mean error of simulated density (20%) upon SI were evaluated. The errors of SI at snow types I and II are approximately 15% and 22%, respectively. On the other hand, if the model reconstructed snow type II instead of measured snow type I (Fig. 5), the error of SI is dependent on snow density; that is, the error shows a range from 60% (100kgm-3) to 30% (400kgm-3).
II. Simulated snow densities almost agreed with the corresponding measurements. The mean deviation of simulated density was 20%, and this error would increase the error of SI from 15 to 22%. III. Reconstructions of snow type were almost successful; unrealistic snow type “faceted particles” occasionally appeared in the simulation. This error would increase the error of SI from 30 to 60%.
Simulation (kg m-3)
600
5. CONCLUSIONS Establishment of connection between NHM and SNOWPACK was attempted in order to facilitate a system for forecasting spatial snow disasters, especially avalanche. The comparison results with simulations of NHM and measurements indicate following tendencies: I. Air temperature and relative humidity were reconstructed in the model. II. The simulated variation in wind speed showed a trend almost similar to that of measurements though large differences occasionally occurred. III. Most of the timings of simulated precipitation agreed with measurements, but the quantities of simulated precipitation were much smaller than the measurements at each point. Using input data simulated by NHM and measured precipitation, variations in snow cover were reconstructed using SNOWPACK. A comparison of results between simulations and measurements indicated following tendencies: I. Variations in simulated snow depth showed relatively good agreement with the corresponding measurements, though the simulated amplitudes of variation were smaller than those of measurements.
400 200 0
0
200 400 600 Measurement (kg m-3)
Figure 9: Comparisons between simulated density and measurement at NISIS.
This study represents a preliminary attempt to connect NHM and SNOWPACK. The future direction of this investigation will involve solving the problems encountered in this study and continuing the attempt to establish a realistic system for spatial snow disaster forecast. 6. ACKNOWLEDGEMENTS We would like to thank M. Shimizu, K. Nishimura, H. Hirashima, M. Ishizaka, T. Kobayashi and T. Noguchi of NISIS, and T. Sato, O. Abe, K. Kosugi and N. Nemoto of Shinjo Branch, NISIS for their useful suggestions.
203
Snow depth (cm)
100
a)
50
0
Snow depth (cm)
100
b)
50
0 New snow Lightly compacted snow Compacted snow Melt form Faceted snow
Figure 8: Comparisons between simulated variations in snow type and measurement at NISIS. a) Measurements. b) Simulations. 7. REFFERENCES
Lehning, M., P. B. Bartelt, B. Brown and C. Fierz. 2002b. A physical SNOWPACK model for the Swiss avalanche warning: Part III. Meteorological forcing, thin layer formation and evaluation. Cold Reg. Sci. Technol., 35(3), 169184. Lehning, M., P. B. Bartelt, B. Brown, T. Russi, U. Stöcli and M. Zimmerli. 1999. SNOWPACK model calculations for avalanche warning based upon a new network of weather and snow stations. Cold Reg. Sci. Technol., 30(1-3), 145157. Saito, K. T. Kato, H. Eito and C. Muroi. 2001. Documentation of the Meteorological Research Institute / Numerical prediction division unified nonhydrostatic model. Technical reports of the Meteorological Research Institute, 42, pp133. Sato, A., M. Ishizaka, M. Shimizu, T. Kobayashi, K. Nishimura, S. Nakai, T. Sato, O. Abe, K. Kosugi, S. Yamaguchi and K. Iwamoto, 2004. Construction of snow disaster forcasting system in Japan. Proceedings of the fifth International Conference on Snow Engineering, 235-238. Yamaguchi, S., A. Sato and M. Lehning. 2004. Application of the numerical snowpack model (SNOWPACK) to the wet snow region in Japan. Ann. Glaciol., 38 (in print). Yokoyama, K., H. Ohno, Y. Kominami. 2003. Performance of Japanese precipitation gauges in winter. Seppyo, J. Jpn. Soc. Snow Ice, 65(3) (In Japanese with English summary).
Bartelt, P. B. and M. Lehning. 2002. A physical SNOWPACK model for avalanche warning: Part I. Numerical model. Cold Reg. Sci. Technol. 35(3), 123-145. Ikawa, M. and K. Saito. 1991. Description of a nonhydrostatic model developed at the forecast research department of the MRI. Technical reports of the Meteorological Research Institute, 28, pp238. Iwamoto, K., S. Nakai, M. Ishizaka, M. Shimizu, A. Sato and T. Maruyama. 2004. A numerical study of the snowfall around the Niigata region. Proceedings of 14th International Conference on Clouds and Precipitation, 1673-1674. Jamieson, B. and C. D. Johnston. 2001. Evaluation of the shear frame test for weak snowpack layers. Ann. Glaciol., 32, 59-69. Lehning, M., P. B. Bartelt, B. Brown, C. Fierz and P. Satyawali. 2002a. A physical SNOWPACK model for the Swiss avalanche warning: Part II. Snow Microstructure. Cold Reg. Sci. Technol., 35(3), 147-167.
204