called Phase I observations is required to estimate the limits of the chart before the ...... Hodges-Lehmann estimator and work with Walsh averages. However, as ...
Control charts using minima instead of averages Willem Albers and Wilbert C.M. Kallenberg Department of Applied Mathematics Faculty of Electrical Engineering, Mathematics and Computer Science University of Twente P.O. Box 217, 7500 AE Enschede The Netherlands
Abstract Traditional control charts are commonly based on the averages of the inspected groups of observations. It turns out to be quite worthwhile to consider alternative approaches. In particular, a very good proposal is to use instead the group minimum for comparison to some suitable upper limit (and likewise the group maximum for comparison to a lower limit). The power of detection during Out-of-Control of the resulting chart is comparable to that of the standard Shewhart approach, while it offers much better protection to the effects of parameter estimation and/or nonnormality than the traditional methods. Keywords: Statistical Process Control, Phase II control limits, order statistics 1. Introduction Consider the case where the mean of a production process is monitored using a Shewhart chart based on (groups of) incoming measurements. An upper limit and a lower limit are set and as soon as either of these is exceeded for a newly arriving (group of) measurement(s), an Out-of-Control (OoC) signal occurs. While the process is in fact In-Control (IC), the resulting false alarm rate (FAR) should equal some very small quantity p, typically of the order 0.001. Almost always, the underlying distribution generating the measurements is unknown and a sample of socalled Phase I observations is required to estimate the limits of the chart before the actual control can begin. Standard practice assumes normality, which reduces the problem to estimating the normal mean and variance involved. However, even in this relatively simple setup, it is by now rather well-known that a very large sample of Phase I observations is required before the estimation errors become sufficiently small to be safely ignored. See e.g. Ghosh et al. (1981), Quesenberry (1993), Roes (1995), Chen (1997), Woodall and Montgomery (1999) (p. 379) and Chakraborti (2000). Therefore, Albers and Kallenberg (2004a, b, 2005a) (to be denoted for short as AK
(2004a, b, 2005a) in the sequel) have demonstrated how this can be solved by using relatively simple corrections. But the normality assumption itself is often questionable as well, as was pointed out before by several authors, see e.g. Chan et al. (1988), Pappanastos and Adams (1996). Without normality, the resulting estimation problem is essentially more complicated and so far results are mainly restricted to the case of individual measurements, i.e. where the observations arrive one at a time. In fact, for this situation Albers, Kallenberg and Nurdiati (2004, 2005) (AKN (2004, 2005) for short) have extended the usual normal charts to parametric ones. Essentially, in addition to mean and variance, a shape parameter is estimated there as well. As a further alternative, nonparametric charts are considered in AK (2004c). (For some closely related charts see Willemain and Runger (1996) and Ion et al. (2000); for a recent overview of nonparametric charts in general, see e.g. Chakraborti et al. (2001).) Finally, AKN (2006) presents a data driven procedure to select the best solution in a given case from among the normal, parametric and nonparametric choices offered. Attractive aspects of this latter approach are that one sticks with the (corrected!) normal chart as long as the data permit; if the departure from normality apparently is too strong, the parametric alternative kicks in; only in really extreme situations one has to resort to the fully nonparametric chart. Consequently, it seems worthwhile to extend the above to the grouped case, where the measurements become available m (m ≥ 1) at a time (or do arrive individually, but are grouped before applying the chart). However, as soon as we start with this program, once more a new and quite substantial complication arises. In the individual case, it is trivially clear that a signal will arise if either the new observation is too large or too small. But in the grouped case, first the question has to be dealt with which statistic based on the m observations, should actually be used. Under normality, the answer is straightforward: the sample mean is optimal and easy to work with. In fact, in a
few simple steps the case m > 1 is reduced to the case m = 1. Beyond the normal model, the picture is quite different, however. The sample mean is not necessarily optimal, and it also is not particularly easy to deal with (usually m ≤ 5, so the central limit theorem is not of much use here, especially not as the interest is focused on the tails of the distribution). Hence the subject of the present paper will be the study of a variety of possible statistics for use in grouped control charts. One aspect will obviously be how efficient a particular choice is: given a certain FAR, how large is the probability of detection during OoC offered by the choice made? Another criterion will be its ease of application. Moreover, note that in fact two types of comparisons play a role. In the first place, for each fixed value of m, various statistics can be compared. But in situations where observations arrive individually and grouping is applied afterwards, each given type of statistic can also be compared for varying m. Even the normal case is not quite trivial in this respect and still leads to some interesting insights. The point is of course that we are not dealing with a single given OoC-situation, implying that the optimal choice of m will vary according to the alternative considered. It turns out that answering the various questions raised in the previous paragraph already poses quite a task in itself. Hence it seems wise to make a similar division as in the individual case. The first step thus is to figure out these answers for a known (but not necessarily normal) underlying distribution. Once a more or less clear picture has been obtained about which statistics have which properties under which conditions, the second step can be taken. This will entail the estimation of the parameters and/or distributions involved, the study of the estimation effects incurred and the derivation of possible corrections for errors which are considered to be intolerably large. In the present paper we shall address the first step, and thus work under the assumption of a known underlying distribution. The second step, concerning the estimation aspects, will be dealt with in a forthcoming paper. The paper is structured as follows. In section 2 we shall use the case of individual measurements to introduce the setup and the notation involved and to identify the issues to be addressed in more detail. Next, in section 3, we treat the situation where the known distribution is in fact normal. Section 4 is devoted to the case of general known F. A brief summary of the conclusions is given in section 5.
2. Individual observations To fix ideas, for the FAR we choose p = 0.001, unless stated otherwise. For ease of presentation we concentrate on the one-sided case where only an upper limit UL is needed. As mentioned above, the standard assumption about the underlying distribution function (df) F of the measurements X is that in fact F ( x) = Φ(( x − μ ) / σ ) , in which Φ stands for the standard normal df. For any df H we will write and H = 1 − H , and H −1 and H −1 for the respective inverse functions. (Observe that the inverse is defined unambiguously for continuous and increasing H; for the remaining cases a choice has to be specified.) Then it is immediate that P( X > UL) = p will result for UL = μ + σu p , with u p = Φ −1 ( p ) . Note that e.g.
u 0.001 = 3.09 , while moreover u 0.00135 = 3 , leading to the well-known ‘3σ-limits’. As μ and σ are typically not known, these parameters need to be replaced by estimators μˆ and σˆ (e.g. sample mean X and sample standard deviation S, respectively), based on Phase I observations X 1 ,K , X n . This leads to UˆL = μˆ + σˆu p , and thus to a random FAR Pn = P( X n +1 > UˆL | ( X 1 ,..., X n )).
(2.1)
The stochastic error SE = Pn − p → P 0 as n → ∞ , but this convergence is much slower than intuitively anticipated. Actually, since p is very small, the relative error SE/p remains really too large for sample sizes n encountered in practice. This is amply demonstrated in AK (2004a,b, 2005a), using the relative bias E(SE/p) and exceedance probabilities like P( SE p > ε ) as criteria. In these papers corrections c are derived which lead to corrected upper limits UˆLc = μˆ + σˆ (u p + c) , the use of which ensures that either bias or exceedance probabilities are under control again. (Note the similarity in form to more traditional corrections, like the replacement of the sample standard deviation σˆ = S by σˆ = S / c4 or of the moving range σˆ = MR by σˆ = MR / d 2 ; however, these are of little use in this respect.) A further remark is that all of this has been done not merely for the random FAR Pn from (2.1), but also for quantities like 1/Pn (which is the random average run length (ARL)) or 1 − (1 − Pn ) k (which is P( RL ≤ k | ( X 1 ,K , X n )) . Note that studying these quantities does make sense: the estimation process obviously causes dependence, but conditional on
( X 1 ,K , X n ) (cf. (2.1)), independence continues to hold. Hence then Pn is still geometric and the conditional ARL indeed equals 1/Pn. Finally, the impact of the corrections on the OoC behavior is negligible (bias criterion) to small (exceedance criterion), which means that the premium to be paid for such protection is very acceptable. Hence the above adequately deals with the SE, which is in principle quite nice. However, do observe that all this presupposes normality, which may be a rather dubious assumption, especially as far as the tails of the underlying df F are involved. But if normality indeed is not true, in addition to the SE = Pn − F (UL) we are faced with a model error ME = F (UL) − p . In a sense, that is even worse: the SE → P 0 , but the ME will remain, no matter how large n is chosen. A possible remedy for this new problem can be to generalize the standardized normal quantile up. For example, replace it by up1+γ, where γ > -1 is some third parameter. Heavy-tailed distributions will require a positive γ, the normal case obviously has γ = 0, and lighter-tailed distributions can be modeled using negative γ. Inclusion of a normalizing factor c(γ) allows σ to still stand for the standard deviation in the thus generalized UL = μ + σc(γ )u 1p+γ . For the application of this upper limit, all three parameters μ, σ and γ need to be estimated, leading to a quite flexible UˆL . This choice is amply analyzed in AKN (2004, 2005), following the same pattern as in AK (2004a,b, 2005). It turns out that this so-called normal power family model indeed provides a major improvement over the simple normal model. For a large variety of underlying df’s F, good to acceptable results are obtained with respect to the ME, whereas the normal limit usually produces unacceptably large outcomes in this respect. The price for this protection clearly is a larger SE (because an additional, and rather tricky, parameter has to be estimated), but suitable corrections are again derived to control the behavior of the corresponding charts with respect to the two criteria mentioned before. Obviously, the effect on the OoC behavior will be larger as well than in the normal case. But, especially for the bias criterion, it is still quite small. Nevertheless, it is obvious that many choices of df’s F remain which are still not adequately covered by such a wider family. In such cases essentially all that remains is to move on to a nonparametric chart, based e.g. on UL = X ( n − r ) , where X(j) stands for the jth order statistic of the X 1 ,K , X n and r = [np], the largest integer not exceeding np. In this way, the ME is
effectively removed for all possible F, but as a consequence, the SE will for common values of p and n be too large too handle. To see this, just note that the default choice p = 0.001 will produce r = 0 unless n ≥ 1000, which will typically not be the case in standard practice. A more detailed account of the behavior of nonparametric charts can be found in AK (2004c). In particular, corrected versions of the chart are derived with respect to the two criteria used before. It is demonstrated that the effects will be quite large. This paper is used in AKN (2006), together with the previously cited ones, to derive a data driven procedure: on the basis of the Phase I observations, a selection rule decides whether it is safe to use the ordinary normal chart, whether it is more prudent to take the normal power chart, or whether it is even necessary to settle for the nonparametric chart. Hence this procedure largely represents the optimal behavior so far. The above has served to introduce the setup and the notation involved. In addition, it has made clear that, even in the individual case, determining the best chart is a rather complex issue. Moreover, for fixed p and n, the existence of a satisfactory solution for the case m = 1 is by no means guaranteed. The wish to avoid a ME which really is intolerably large may prompt to abandon the normal chart. But as a consequence, we may wind up with an unpleasantly large SE when using the nonparametric chart. This in its turn requires substantial correction to meet the bias or exceedance criterion, which has considerable impact on the OoC behavior. Hence there remains ample reason to search for attractive alternative approaches for such cases by using m > 1. Finally, the discussion for the individual case has also been useful because it already implicitly has brought up some alternatives for the sample average. The use of e.g. X(n – r) from the Phase I sample in the nonparametric case suggests to consider order statistics as well within the new group of m observations. Especially the maximum or minimum will be easy to handle. A related alternative will be to essentially apply ranks instead of the observations themselves. 3.Grouped observations: normal distribution
The decision of giving a signal will from now on no longer be based on a single X, but instead on a group X 1 ,K , X m , with m typically rather small, e.g. m = 2, 3, 4 or 5. A suitable statistic w has to be selected, after which it can be checked whether w( X 1 ,..., X m ) > UL(m),
(3.1)
for some given upper limit UL(m). Clearly, the individual case corresponds to m = 1. Choosing w( X 1 ,K , X m ) proportional to X in (3.1) is rather obvious, but, as we will show, it is by no means the only or even the best possibility in many respects. Moreover, the OoC-behavior of the grouped observations chart is quite different from that of the individual chart based on X > UL. Hence considerable attention has to be devoted to the question how the cases with m > 1 can be compared to the case where m = 1. Consequently, we shall concentrate here on the case where the underlying F is completely known.
very small, 1 − (1 − p) m virtually equals mp, so we just settle for the choice from (3.3). Next we compare the performance during OoC of the thus matched pairs AVE and IND. Using the ARL’s once more, it makes sense to look at h AVE , IND (m, d ) = =
ARL AVE (m, d ) ARL(1, d ) mΦ (u p − d ) Φ (u mp − m1 / 2 d )
(3.4) .
In line with the exposition given for the individual case, we shall even begin by letting F = Φ during IC. (In fact we should take F ( x) = Φ (( x − μ ) / σ ), but since μ and σ are assumed known, we can without loss of generality take the standard normal case). The OoC situation we model in the standard way by letting F ( x) = Φ ( x − d ), with d > 0. 3.1 IND
For the individual chart (IND) we then have that UL = UL(1) = u p , with obviously under OoC probability p(1, d ) = Φ (u p − d ) and ARL(1, d ) = 1 p(1, d ).
Next we turn to possible competitors for m > 1. 3.2 AVE
To begin with we consider the obvious choice, which is the average chart (AVE), based on w( X 1 ,..., X m ) 1/ 2
= m X . For some suitably chosen small value p(m), let UL(m) = u p (m ) , then ARL(m, d ) = 1 p(m, d ), where p ( m, d ) = Φ (u p ( m ) − m1 / 2 d ).
(3.2)
The question now is how to select p(m) = p(m,0) in order to compare AVE in a fair way to IND from section 3.1 based on p. The easiest way is to match the ARL’s of the two charts during IC, which means that m/p(m) = 1/p and thus simply p(m) = mp.
(3.3)
Alternatively, we can argue as follows: the probability that IND has stopped after m steps equals 1 − (1 − p) m , which can also be used for p(m). Fortunately, as p is
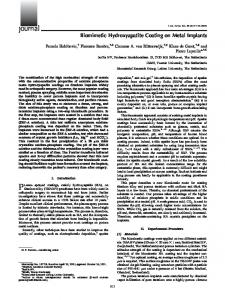
Figure 3.1
In Figure 3.1, these hAVE,IND from (3.4) are given as functions of d for m = 2, 3 and 4. As expected (cf. discussions about the relative merits of Shewhart and CUSUM charts), the answer to the question which chart is best depends on d: the larger d, the smaller m should be chosen. As h AVE, IND (m, ∞) = m , IND will eventually be best. More specifically, from (3.4) it is evident that values above 1 will definitely result as soon as Φ (u p − d ) ≥ m −1 , i.e. when d ≥ d1 = u p − u1 / m . For p = 0.001, we obtain d1 = 3.09, 2.66
and 2.42, for m = 2, 3, 4, respectively. Note that these values are quite close to the actual d1 for which h AVE, IND (m, d1 ) = 1 : d1 = 2.97, 2.63 and 2.40 for m = 2, 3 and 4, respectively. Hence IND beats the various AVE’s, but not really much sooner than in the obvious case where p(1, d ) > m −1 . Consequentially, a considerable range of values of d remains for which
p(1,d) is not (very) small and for which the AVE’s are better. The purpose of the discussion above has been twofold. In the first place, it has made clear that the comparison requires care, and moreover it has demonstrated that abandoning IND in favor of a grouped chart may be worthwhile in itself, i.e. without taking possible advantages with respect to estimation aspects into account. The next step will be the consideration of other choices for w in (3.1). 3.3 MIN (and MAX or MIX)
Clearly, the choice based on X is optimal in the normal case. But, as was remarked in the previous section, quite often the normality assumption is dubious and we are forced to look beyond this simple model. Under these circumstances, other choices will be of interest as well. Nevertheless, we still begin by considering such alternatives under normality. The idea is that if normality holds after all, the loss due to using a suboptimal choice for w should be sufficiently small. This small loss can then be viewed as a reasonable premium, providing protection against the occurrence of completely wrong results when the normal model does not hold true.
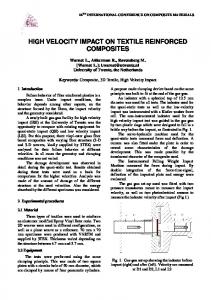
where q = (mp)1/m. In passing note the following: p in IND (and in MAX) is extremely small, mp in AVE is slightly less so, but (mp)1/m in MIN is really much less extreme. In the previous section we observed that the large relative errors in the estimation part of the procedures stem from the extremeness of the quantiles to be estimated. Note that in this respect, MIN thus looks quite promising! However, as mentioned in the Introduction, to avoid confounding we shall not go into these estimation aspects here but concentrate on the merit of each proposal in itself, i.e. for the case of known F. Hence we are going to compare the performance of MIN to that of AVE and IND. Obviously, ARLMIN ( m, d ) = m /{Φ (u q − d )}m , which leads in analogy to (3.4) to functions hAVE,MIN and hMIN,IND and thus to Figures 3.2a and 3.2b.
A first alternative choice has in fact already been contained in the comparison of AVE and IND in section 3.2. There we observed that the probability that IND had stopped after m steps during IC equals 1 − (1 − p ) m ≈ mp. Note that this suggests the choice w( X 1 ,..., X m ) = max( X 1 ,..., X m ), with corresponding UL(m) = up*, where p* = 1 − (1 − mp )1 / m is chosen such that (3.3) holds here as well. For this maximum chart (MAX) the average run length equals m (1 − Φ (u p* − d )). Although there is some gain because p* < p, the relative difference 1 – p*/p is negligible. Hence essentially MAX does nothing but finish the series of m observations in which IND has given a signal. In other words, it is not only inferior to the optimal (that is, under normality!) AVE, but also to IND. Consequently, this alternative is as easily eliminated as it arises. However, it brings us to another, related choice: just let w( X 1 ,..., X m ) = min( X 1 ,..., X m ) in (3.1). As in this case P( w( X 1 ,..., X m ) > UL(m)) = {Φ (UL(m))}m , it follows that a fair comparison is obtained by defining the minimum chart (MIN) through min( X 1 ,..., X m ) > u q ,
(3.5)
Figure 3.2a
Comparison of Figure 3.2a to Figure 3.1 reveals that MIN actually performs quite well. Just as MAX, it loses from AVE under normality, as should be the case. But note that the minima of hAVE,MIN are quite acceptable, in particular if we compare them to those of hAVE,IND. For example, for m = 2, the former minimal value equals 0.79, whereas the latter is 0.49. Moreover, just as we observed for AVE, it takes rather large values of d before MIN starts to lose to IND. In fact, hMIN , IND (m, d1 ) = 1 in Figure 3.2b now produces d1 = 2.74, 2.43 and 2.23 for m = 2, 3 and 4, respectively (for h AVE, IND (m, d1 ) = 1 the corresponding values were d1 = 2.98, 2.63 and 2.41). Hence, in addition to AVE, also MIN forms an attractive alternative to IND.
optimal MIX is indeed slightly better than MIN. For example, if m = 2, the minimum attained is 0.90, as compared to 0.79 for hAVE,MIN. It remains a matter of taste whether this type of improvement outweighs the increased complexity of the resulting chart. 3.4 UNI
In the individual case we check whether X > u p = Φ −1 ( p ) . Clearly, it is equivalent to verify whether Φ( X ) > 1 − p. As Ф(X) is uniformly distributed on (0,1), this readily suggests yet another type of generalization to the grouped case: let
w( X 1 ,..., X m ) = ∑i =1 Φ( X i ) = ∑i =1U i m
m
in (3.1). To
determine the appropriate UL(m) from (3.1) for this case, we begin by observing that for c ≤ 1 we simply
P(∑i =1U i > m − c) =P(∑i =1U i < c) = c m m! m
have Figure 3.2b
Many other choices exist. For example, rather than the maximum or the minimum, other order statistics of X 1 ,K , X m could be used. Yet another possibility is to combine several such statistics, in order to make the resulting region somewhat more comparable to the region determined by X > u mp . By way of example we briefly consider the following mixed chart (MIX): a signal is given if for some probability s and some δ with 0 ≤ δ ≤ 1 min( X 1 ,..., X m ) > u s and max( X 1 ,..., X m ) > uδs .
(3.6)
It is immediate to see that during IC the event in (3.6) has probability s m {1 − (1 − δ ) m } . If as before, the comparison is made fair again by setting this equal to mp, it follows that ⎛ mp s=⎜ ⎜ 1 − (1 − δ ) m ⎝
⎞ ⎟ ⎟ ⎠
1/ m
(3.7)
.
Letting δ increase from 1 − (1 − mp )1 / m to 1, we go from MAX to MIN. The best value for δ is the one that minimizes the corresponding ARL during OoC, given by
m m
Φ (u s − d ) − {Φ (u s − d ) − Φ (uδs − d )}m
.
For p = 0.001, this optimal δ approximately equals (4m)–1. The corresponding hAVE,MIX reveals that this
m
This will equal the once again desired outcome mp if we let c = (m!(mp ))1 / m , which result will indeed be ≤ 1 for m ≤ 5 and p = 0.001. (Of course, for larger c the result can also be readily obtained, but for ease of presentation we concentrate on this most simple case.) Consequently, we define the uniform (UNI) chart through
∑i=1 Φ( X i ) > m − (m!(mp)) (1/ m) , m
or equivalently by
(3.8)
∑i=1 Φ ( X i ) < (m!(mp)) (1/ m) . m
Just as in the case of MIN, in passing we comment briefly on the estimation aspects, among others to establish relations to previous work. If the underlying df F is unknown, in this situation a Phase I sample X 1 ,K , X n will have to precede the group of new observations, say X n +1 ,K , X n + m , and the empirical df Fn of X 1 ,K , X n can be used to estimate F. Observe that Fn ( X n +i ) = R( X n +i ) − 1 , where R(Xn+i) is the rank of Xn+i among X 1 ,K , X n , X n +i . Hence the statistic in (3.8) produces a Wilcoxon-type of approach in the estimated version, and as such offers a likely and possibly attractive alternative to the standard parametric approach. In the review on nonparametric charts by Chakraborti et al. (2001), rank based charts of this nature by e.g. Bakir and Reynolds (1979) and Hackl and Ledolter (1991, 1992) are mentioned. However, here we shall once more refrain from going into the estimation aspects and concentrate on the performance under known F. Hence ranks will remain in the background and uniform charts are the ones we focus on.
Next we consider the OoC behavior of UNI. When F ( x) = Φ ( x − d ), the probability of a signal for this case can be written as
p(m, d ) = P(∑i =1U i < (m!(mp))1 / m ), m
where
now
U i = Φ ( X i ) has df Φ ( Φ −1 (t ) − d ) . Although not really complicated, the resulting expressions for p(m,d) are much less explicit than the corresponding ones for AVE and MIN. Hence in this sense UNI is somewhat less attractive to work with. Pictures for comparing its performance to that of AVE and/or IND are very similar to those in Figure 3.2. Hence for brevity we do not present such pictures here. We merely mention that as far as performance is concerned, UNI appears to lie between AVE and MIN: it also loses a bit compared to the optimal AVE, but even less than MIN. To give an example, ARL(AVE)/ARL(UNI) decreases for the case m = 2 from 1 at d = 0 to 0.87 at d = 1.7, after which it increases again. Moreover ARL(MIN)/ARL(UNI) rises from 1 at d = 0 to 1.10 at d = 1.6, after which it decreases again. All in all, this agrees with the intuition according to which Φ ( X 1 ) + Φ( X 2 ) is somewhat closer to X1 + X2 than min(X1, X2). 3.5 Example
To conclude this section, we summarize the above by means of an explicit example. Remember that p = 0.001 unless stated otherwise. Hence for m = 2 we subsequently have that a signal occurs for
• • • • • •
IND if X1 exceeds u0.001 = 3.09 and otherwise (or again) if X2 ≥ 3.09, MAX if X1 and/or X2 exceeds u0.001 = 3.09, AVE if X1 + X2 exceeds u0.00221/2 = 4.07, MIN if both X1 and X2 exceed u0.045 = 1.70, MIX (with δ = 1/8) if both X1 and X2 exceed u0.092 = 1.33 and at least one of these exceeds u0.012 = 2.27, UNI if Φ ( X 1 ) + Φ( X 2 ) exceeds 2 – (0.004)1/2 = 1.94.
4. Grouped observations: general F 4.1 IND
In this section we again require that the underlying df F is completely known (and thus its mean μ and its standard deviation σ can without loss of generality be taken equal to 0 and 1, respectively). However, we no longer assume F to be normal. Hence ut = Φ −1 (t ) is
replaced by ξ t = F −1 (t ) for t = p, mp, q, s, etc. For IND we then obtain under F ( x − d ) the OoC probability p(1, d ) = F (ξ p − d ) . However, for m > 1,
the situation is less simple. 4.2 AVE First of all, note that the optimality of X is lost: the optimal statistic now should be based on
∑i=1 log{ f ( X i − d ) m
f ( X i )}, where f is the density of
F. But this solution cannot be applied, as d is unknown. Its commonly used locally most powerful approximation
∑i=1{− f ′( X i ) m
f ( X i )} also does not
make much sense, as the alternatives figuring in Shewhart charts are typically not local. Moreover, even if this obstacle would be ignored, the usual normal approximation to such a statistic breaks down, as m is as small as 2-5. Summarizing this point, because of d being large and m being small, rather than the other way around, optimality is out of reach. Hence we are back at X , and thus at AVE, but note that even this choice is cumbersome now, as for such general F convolutions are hard to deal with. For special cases, explicit results can still be obtained. We shall consider an example of this type, but postpone it till the next subsection (see (4.2)), in order to allow several comparisons at the same time. Just as before, let us briefly digress into the estimation case, to see whether matters might look more promising there. Unfortunately, this does not seem to be the case here. Using averages while F is unknown brings us into the area of normal permutation tests. Some efforts of this type were already mentioned in Chakraborti et al. (2001). For example, Alloway and Raghavachari (1991) use a procedure based on the Hodges-Lehmann estimator and work with Walsh averages. However, as pointed out by Chakraborti et al. (2001) and by Pappanastos and Adams (1996), the resulting charts are in fact not truly nonparametric or distributionfree. Their actual in-control run length distribution involved does depend on the underlying distribution of the observations. A thorough analysis of the problem was performed by AK (2005b), focusing on the tail behavior of the empirical df of convolutions. It turns out that going to m > 1 does not really help that much: the estimation step will still require uncomfortably large values of n. 4.3 MIN (and MAX or MIX)
Fortunately, for the choice from section 3.3, the situation remains comparable to that for IND: adaptation to the general case is immediate. To be specific, we have ARLMIX (m, d ) =
m m
F (ξ s − d ) − {F (ξ s − d ) − F (ξ δs − d )}
m
,
(4.1)
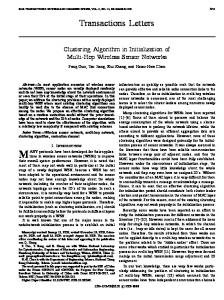
with s as in (3.7), which for δ =1 gives the corresponding result for MIN with s = q = (mp)1/m. Consequently, comparison of these procedures to IND can be made in precisely the same way as in the previous section. For example, consider the family of t-distributions with f degrees of freedom (standardized by a factor {(f – 2)/f}½ to obtain σ = 1). This family is quite attractive for our purposes, as it nicely models departures from the normal model towards df’s with heavier tails. In Figure 4.1 the resulting hMIN,IND for the case m = 2 are presented for f = 10, 20 and 200. The latter case is virtually identical to the normal situation, and indeed its graph corresponds to the one obtained in Figure 3.2b. The other two choices produce similar shapes, but the minimal value clearly decreases substantially as f decreases. For the normal case the minimum of hMIN,IND equals 0.62, whereas for f = 10 a value 0.19 is found. Note that this means that in this more general family MIN compares considerably more favorably to IND than in the normal case, where it already was seen to be an attractive alternative.
Figure 4.1
This same picture can be observed for other examples. If we choose for F the standardized logistic df (i.e. a scale factor 3–½π is used to let σ = 1), we have ξ0.001 = 3.81, which differs quite a bit from u0.001 = 3.09. Note
that this outcome illustrates the danger of deciding that normality ‘looks O.K.’ on the basis of a casual visual inspection. Indeed the logistic df is often considered to be ‘very normal’, which may be true in the middle and even as far as the ordinary tail (e.g. ξ0.025 = 2.02 and u0.025 = 1.96), but clearly this does not continue to hold for p as small as 0.001. The graph of hMIN,IND looks very similar to the case f = 10 from Figure 4.1. The corresponding minimum value for example equals 0.17. Hence in the comparison to IND, again MIN scores even better than in the normal case. Yet another possibility is to consider a random normal mixture F ( x) = (1 − γ )Φ ( x / σ 1 ) + γΦ ( x / σ 2 ),
(4.2)
where the σi are such that (1 − γ )σ 12 + γσ 22 = 1 . Again, the normal df, which occurs if K = σ2/σ1 = 1, represents the worst case: as K moves away from 1, the minimum of hMIN,IND again decreases. Hence in this sense (4.2) has not much additional information to offer beyond what was already noticed for the t-distributions and the logistic case. However, an additional advantage of (4.2) is that for such F convolutions for m in a range like 2-5 are relatively easy to deal with. Hence in this example, also AVE can be included in the comparisons. In Figure 4.2a-c we present once more for some representative graphs hAVE,MIN , using the value K = 1, 2 and 3 together with γ = 0.25, 0.50 and 0.75. Clearly, in the normal case (K = 1) AVE is optimal and as such outperforms MIN, as already observed in Figure 3.2a. But note that this superiority is lost for K > 1, especially as γ gets smaller. Hence, just as in the comparison to IND, it turns out that the attractiveness of MIN only increases once the normal model is left.
Figure 4.2a-c
It remains to investigate the behavior of MIX, which can be done along the same lines. However, note that the optimal value of δ in (3.7) will depend on F as well. Hence the truly optimal combination of MAX and MIN is out of reach. An alternative is to continue using the approximately optimal δ = (4m)–1 from the normal case. But it turns out that this is not sufficiently robust: using the family from (4.2) once more, it is easily checked that the gain of MIX over MIN – which was not that large to begin with – quite often is lost, meaning that MIN can in fact be the better of the two.
4.4 UNI
Under general F, the IC behavior of UNI remains unaltered: we merely have to replace Ф(Xi) in (3.8) by F(Xi), which again is uniformly distributed on (0,1). Likewise, during OoC, we still have
p(m, d ) = P(∑i =1U i < (m!(mp))1 / m ), but now U i = m
F ( X i ) has df F (ξ t − d ). Again, the analysis itself is rather straightforward, but the results obtained are not very explicit. Hence during IC, UNI, just like MIN, compares favorably to AVE as far as ease of computation is concerned, but during OoC this advantage is lost and UNI joins AVE in the sense that it is awkward to work with. Obviously, just as in the previous subsection, a wide variety of performance comparisons could be made. However, to avoid repetition, we shall merely consider the standardized logistic df again, as it plays a somewhat special role here (cf. the optimality of the Wilcoxon score function for the logistic family). Indeed, UNI still beats MIN here: in analogy to the example from section 3.4 we now have for m = 2 that ARL(MIN)/ARL(UNI) rises from 1 at d = 0 to 1.06 at d =2.1, after which it decreases again. The difference thus has become even smaller. As concerns AVE, the roles are now reversed: in the logistic case, ARL(AVE)/ARL(UNI) increases as well, even till about 1.40 at about d = 1.5, before it goes down again. Hence we see something similar as in Figure 4.2: the optimality of AVE is indeed easily lost once normality has been be abandoned. 5. Summary
In section 3 MIN already turned out to be a quite attractive alternative to IND. In the previous section this tentative conclusion has been strengthened considerably. The relative performance of MIN with respect to its competitors IND, AVE, MIX and UNI typically only further improves under departures from normality towards heavier tails. Moreover, the alternatives AVE, MIX and UNI become more complicated or even impossible to apply. References
Albers, W. and Kallenberg, W.C.M. (2004a). Estimation in Shewhart control charts: effects and corrections. Metrika 59, 207 – 234. Albers, W. and Kallenberg, W.C.M. (2004b). Are estimated control charts in control? Statistics 38, 67 – 79. Albers, W. and Kallenberg, W.C.M. (2004c). Empirical nonparametric control charts: estimation effects and corrections. J.Applied Statistics 31, 345 – 360. Albers, W. and Kallenberg, W.C.M. (2005a). New corrections for old control charts. Quality Engineering 17, 467 – 473. Albers, W. and Kallenberg, W.C.M. (2005b). Tail behavior of the empirical distribution function of convolutions. Math. Methods of Statist. 14,133 – 162. Albers, W., Kallenberg, W.C.M. and Nurdiati, S. (2004). Parametric control charts. J. Statist. Plann. Inference 124, 159 – 184. Albers, W., Kallenberg, W.C.M. and Nurdiati, S. (2005). Exceedance probabilities for parametric control charts. Statistics 39, 429 – 443. Albers, W., Kallenberg, W.C.M. and Nurdiati, S. (2006). Data driven choice of control charts. J. Statist. Plann. Inference 136, 909 – 941. Alloway, J.A. and Raghavachari, M. (1991). Control chart based on the Hodges-Lehmann estimator. J. Qual. Technol. 23, 336 – 347. Bakir, S.T. and Reynolds, M.R.Jr. (1979). A nonparametric procedure for process control based on within-group ranking. Technometrics 21, 175 – 183. Chan, L.K., Hapuarachchi, K.P. and Macpherson, B.D. (1988). Robustness of X and R charts. IEEE Trans. Reliability 37, 117 – 123. Chakraborti, S. (2000). Run length, average run length and false alarm rate of Shewhart X chart: exact derivations by conditioning. Commun. Statist. Simul. Comput. 29, 61 – 81. Chakraborti, S., van der Laan, P. and Bakir, S.T. (2001). Nonparametric Statistical Process control: an overview and some results. J. Qual. Technol. 33, 304 – 315.
Chen, G. (1997). The mean and standard deviation of the run length of X charts when control limits are estimated. Statist. Sinica 7, 789 – 798. Ghosh, B.K., Reynolds, M.R.Jr. and Hui,Y.V. (1981). Shewhart X -charts with estimated process variance. Commun. Statist. Theory Methods 10, 1797 – 1822. Hackl P. and Ledolter J. (1991). A control chart based on ranks. J. Qual. Technol. 23, 117 – 124. Hackl, P. and Ledolter, J. (1992). A new nonparametric quality control technique. Commun. Statist. Simul. Comput. 21, 423 – 443. Ion, R. A., Does, R.J.M.M. and Klaassen, C.A.J. (2000). A comparison of Shewhart control charts based on normality, nonparametrics, and extremevalue theory. Report 00-8, University of Amsterdam. Pappanastos, E.A. and Adams, B.M. (1996). Alternative designs of the Hodges-Lehmann control chart. J.Qual.Technol. 28, 213 – 223. Quesenberry , C.P. (1993). The effect of the sample size on estimated limits for X and X control charts. J. Qual. Technol. 25, 237 – 247. Roes, C.B. (1995). Shewhart-type Charts in Statistical Process Control. Ph.D.-thesis, University of Amsterdam. Willemain, T.R. and Runger, G.C. (1996). Designing control charts using an empirical reference distribution. J. Qual. Technol. 28, 31 – 38. Woodall, W.H. and Montgomery, D.C. (1999). Research issues and ideas in statistical process control. J. Qual. Technol. 31, 376 – 386.