Approximate Image Color Correlograms Claudio Taranto
Nicola Di Mauro
Stefano Ferilli
Department of Computer Science University of Bari "Aldo Moro" via E. Orabona, 4 - Bari, Italy
Department of Computer Science University of Bari "Aldo Moro" via E. Orabona, 4 - Bari, Italy
Department of Computer Science University of Bari "Aldo Moro" via E. Orabona, 4 - Bari, Italy
[email protected]
[email protected] Floriana Esposito
[email protected]
Department of Computer Science University of Bari "Aldo Moro" via E. Orabona, 4 - Bari, Italy
[email protected] ABSTRACT
General Terms
The recent explosion in Internet usage and the growing amount of digital images caused by the more and more ubiquitous presence of digital cameras has created a demand for effective and flexible techniques for automatic image retrieval. As the volume of the data increases, memory and processing requirements need to correspondingly increase at the same rapid pace, and this is often prohibitively expensive. Image collections on this scale make performing even the most common and simple image processing and machine learning tasks non trivial. In this paper we present a method to reduce the computational complexity of a widely known method for image indexing and retrieval based on a second order statistical measure. The aim of the paper is twofold: Q1) is it possible to efficiently extract an approximate distribution of the image features with a resulting low error? Q2) how the resulting approximate distribution affects the similarity-based accuracy? In particular, we propose a sampling method to approximate the distribution of correlograms, adopting a Monte Carlo approach to compute the distribution on a subset of pixels uniformly sampled from the original image. A further variant is to sample the neighborhood of each pixel too. Validation on the Caltech 101 dataset proved that the proposed approximate distribution, obtained with a considerable decrease of the computational time, has an error very low when compared to the exact distribution. Result obtained in the second experiment on a similarity-based ranking task are encouraging.
Experimental, Performance
Categories and Subject Descriptors I.4 [Computing Methodologies]: Image Processing And Computer Vision—Feature Measurement
Permission to make digital or hard copies of all or part of this work for personal or classroom use is granted without fee provided that copies are not made or distributed for profit or commercial advantage and that copies bear this notice and the full citation on the first page. To copy otherwise, to republish, to post on servers or to redistribute to lists, requires prior specific permission and/or a fee. MM’10, October 25–29, 2010, Firenze, Italy. Copyright 2010 ACM 978-1-60558-933-6/10/10 ...$10.00.
Keywords Color correlograms, Feature Extraction and Representation
1.
INTRODUCTION
The rapid expansion of digital image libraries has encouraged the development of systems for content-based image retrieval based on indexing and querying engines [7]. In order to index an image the common approach is to extract low level information, such as pixel color, intensity, texture and shape, which could be used to make a feature vector representing the image. This paper addresses the problem of image feature vector computation. To date, the feature vector is calculated analysing each pixel belonging to the image, and thus involving both a huge computational time and a long indexing time. Our approach is to use a method to efficiently compute the image feature vector. We apply a Monte Carlo method to approximate the indexing, analysing a subset of the pixels belonging to an image. We prove that the obtained error is not significantly relevant when compared to the case of considering all the pixels. The first approach to calculate feature vectors is based on the color histogram [4, 6, 5]. This method is strongly based on pixel colors and it describes for each color level the number of corresponding pixels. For this reason, the image is usually converted in a color space (such as RGB or HSV). The major limit of histogram-based methods is that they only capture global information. It is possible that two semantically different images may correspond to a very similar histogram. An improved statistics is the joint histogram [3] that includes not only color information, but also some other features, such as edge, texture, brightness. This method is more accurate than histogram but it presents the same problem of characterising an image with global information only. In [2], a new approach, named color correlogram, combining both global and local image information has been presented. This new statistics describes how pixels with a given color are spatially distributed in the image. The
correlogram method is generally more accurate and effective than histogram-based methods [2]. The paper is organised as follows. We first briefly review the basic concepts on correlograms and then we present our method to approximate this statistics. Then we conclude the paper with some experimental results and future works.
2. THE PROPOSED APPROACH A correlogram is a statistics expressing how the colors of an image are spatially correlated. A correlogram is defined as a table indexed by color pairs, where the k-th entry for the component (i, j) specifies the probability of finding a pixel of color j at a distance k from a pixel of color i in an image, where k is a distance chosen from the set D. Let I be an n1 × n2 image, whose colors are quantised into m color classes C = {c1 , ...., cm } (bins). Give a pixel pxy ∈ I, I(p) denotes its color and Ic , {pij ∈ I|I(p) = c}. In the following, we assume to use the L∞ -norm to measure the distance beetween pixels. In particular, given px1 y1 and px2 y2 two pixel, the distance is computed as follows [2]: |px1 y1 − px2 y2 | , max{|x1 − x2 |, |y1 − y2 |}.
2.1
Since the correlogram based approach has been proved to be more effective than histogram, join histogram and autocorrelogram, we have decided to investigate how to decrease the time complexity required to calculate the correlogram. For this reason, we have applied a Monte Carlo approach implemented into two different ways.
2.1.1
γc(d) (I) = Prp1 ∈Ici ,p2 ∈I [p2 ∈ Icj ||p1 − p2 | = d], i ,cj
(2)
where ci and cj are two color classes from C, and d ∈ D. The size of the color correlogram matrix is dn1 n2 . A specialisa(d) (d) tion is the autocorrelogram defined as αc (I) = γc,c (I).
2. for each selected pixel the neighbourhood is computed and the correlogram matrix accordingly updated.
2.1.2
In order to calculate the correlogram matrix, given a distance d ∈ D, for each pixel one has to analyse all the pixels belonging to its complete neighbourhood Nd+ , with |Nd+ | = 8d. Here, we propose a method to compute the correlogram by considering only half neighbourhood. Given pij a pixel whose coordinates are xi and xj , and d a distance, we define the neighbourhood Nd− (pij ) of the pixel pij as Nd− (pij )
2. for each selected pixel p, h pixels are randomly selected from the complete neighbourhood Nd+ (p).
3.
VALIDATION
In order to validate the proposed approach, the Calltech101 dataset [1] has been used. It regards images, whose size is roughly 300x200 pixels, belonging to 101 different categories, with a mean of 50 images for each category. We performed two experiments. The former aimed to verify whether the proposed approximate methods are able to compute correlograms with a low error with respect to the exact distribution. While, the latter experiments show preliminary results regarding the retrieval accuracy rate comparing both the exact and approximate correlogram distributions. Images have been mapped to color spaces of 16 and 64 bins.
Indexing based error
In this experiment, for each class one random image has been selected. For each of these images all the algorithms MC1, MC2 and Exact (that compute the exact correlogram matrices) have been applied in order to compute the correlogram matrices along the distances 1, 3, 5 and 7. In order to obtain the error made by the approximate methods, a baseline value is computed considering the error obtained by a random matrix containing for each cell a random number among the interval [0,1], whose rows and columns sum to 1. Given CE the exact correlogram matrix, CM C the approximate correlogram matrix computed with a method among MC1 and MC2, and CR the random matrix, the gain is defined as G = 1 − eM C /eR ,
(4)
where eX
= {(xi+k , yj−d )}k=1,...,d ∪{(xi+d , yj−d+k )}k=1,...,2d ∪{(xi+d−k , yj+d )}k=1,...,d
The second method: MC2
1. For each distance d, k pixels are randomly selected from the image, with uniform distribution; and then
3.1
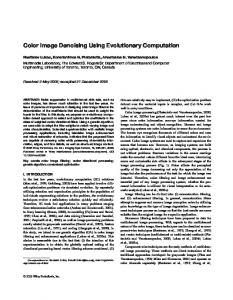
Figure 1: Exact algorithm
The first method: MC1
1. For each distance d, k pixels are randomly selected from the image, with uniform distribution; and then
(1)
The histogram h of an image I is defined as hci (I) = n1 n2 Prp∈I [p ∈ Ic ], for each color class ci ∈ C. Let d ∈ D be a distance, the correlogram of an image I is defined as follows:
Reducing the computing time
=
sX
(CE (i, j) − CX (i, j))2 /|CE |.
ij
(3) N2−
Figure 1 shows with grey pixels the neighbourhood of the black pixel. Hence, proceeding from left to right and (d) from top to bottom, the correlogram γci ,cj (I) can be calcu− lated considering Nd also.
Figure 3 shows experimental results, these are obtained by averaging across all the 101 images in the dataset. The graphs report the results using 16 and 64 colors bins, and let to vary percentage of the sampled pixels from 10% to 50% for MC1 and MC2, and sampling the 50% of the neighbourhood for MC2. The gain adopting 16 bins is better than that
0.018
3
eMC1 eR
0.016
2.5
0.014 0.012 Error
Time (sec)
2
1.5
0.01 0.008 0.006
1
0.004 0.002
0.5
exact mc1 mc2
0 1
3
5
0 10
20
30
40
50
% K pixel
7
0.98
Distance (d) 0.96
obtained with 64 bins, probably due to the fact that with few bins it is more simple to approximate the exact distribution. Furthermore, Figure 3 reports the error eM C1 using 16 colors bins with compared to the error eR both with the distance equal to 7. Figure 2 reports the time, averaged over all the considered images, to compute a correlogram matrix with the three algorithms. As we can see, we can affirmatively response to the question Q1, since both approximate methods turn out to be faster than the exact method. MC2 takes slightly longer because it calculates the list of the random neighbours to be analysed, while MC1 just considers all the neighbourhood.
0.94
Gain (G)
0.92
0.86
0.82 1
ci ,cj ∈C,d∈D
7
0.95 0.9 0.85 0.8 0.75
(d)
1 + γci ,cj (I) + γci ,cj (I ′ )
.
(5)
This process has been done by comparing each image with all the others and ranking the results adopting Equation 5, both with the exact and the approximate method. In order to evaluate the similarity-based error obtained with MC1 and MC2, the results obtained by the exact method are considered as the ground truth. Tables 1, 2, 3 and 4 report the results of this experiment, where %Pixel indicates the percentage of pixels examined for each image, %Neighbourhood represents the percentage of pixels in the considered neighbourhood and Depth is the number of images considered as a reference in comparison. In particular, let M be a method, S a set of images, and {Q1 , . . . , Qn } a set of query images. For a query Q, let AM be the list of images similar to Q sorted according to the metric reported in Equation 5 and obtained adopting the method M . Let us to define rankM (I), with I ∈ AM , the relative position of I in the ordered list AM . Hence, given n queries, and denoting with E the exact method and with M C a Monte Carlo approach: • Depth1 is the percentage of images that both the exact
10% 20% 30% 40% 50%
0.65 0.6 1
3
5
7
Distance (d) 0.98
0.97
0.96 Gain (G)
(d)
|γci ,cj (I) − γci ,cj (I ′ )| (d)
5 Distance (d)
0.95
0.94 10% 20% 30% 40% 50%
0.93
0.92 1
3
5
7
Distance (d) 0.95
0.9
Gain (G)
(d)
3
0.7
In this second experiment, five classes, with 200 images from each one, have been selected, and specifically airplanes, motorbikes, faces, watch and leopard. In order to measure the error made during the retrieval phase, for each image the most similar one has been identified. Each image in our system is represented by the correlograms calculated on 4 distances (1,3,5 and 7). The similarity between two images, I and I ′ , is calculated as follows, as reported in [2]: X
10% 20% 30% 40% 50%
0.84
3.2 Similarity based error
|I − I ′ | :=
0.9 0.88
Gain (G)
Figure 2: Time (MC1 50% pixel, and MC2 50% neighbourhood).
0.85
0.8
10% 20% 30% 40% 50%
0.75
0.7 1
3
5
7
Distance (d)
Figure 3: MC1 and random error with d=7 (top); MC1 gain (from the top: second with 16 bins, and third with 64 bins); MC2 gain (from the bottom: second with 16 bins and 50% neighbourhood, and first with 64 bins and 50% neighbourhood).
%Pixel 2 5 10 20 30 40 50
%Neighbourhood 100 100 100 100 100 100 100
1 34.2 48.9 55.3 63.2 64.7 68.4 74.5
Depth% 2 3 49.7 56.9 65.2 73.9 71.5 80.4 78.1 85.4 79.3 85.7 84.2 90.3 86.8 91.5
%Pixel 10 30 50
%Neighbourhood 10 30 50 10 30 50 10 30 50 10 30 50 10 30 50 10 30 50 10 30 50
1 29.2 35.9 31.4 48.6 45.4 48.2 53.1 54.8 54.2 58.2 62.8 61.1 61.5 61.9 66.3 64.9 67.5 67.8 67.2 68.2 71.7
Depth% 2 3 43.6 52.8 46.6 54.5 46.8 53.5 64.9 73.5 63.4 71.3 64.9 73.2 69.7 77.1 70.8 79.2 70.9 79.6 74.9 82.7 77.6 85.7 77.2 85.3 78.0 85.2 78.4 86.8 80.5 87.8 79.1 86.2 81.6 88.3 81.3 87.5 81.9 88.2 82.1 88.8 85.3 90.5
Table 2: MC2 16 bins similarity based error. and the approximate algorithm P P rank as the first best answer; i.e. i rankE (Qi ) = i rankM C (Qi ) = n;
• Depth2 is the percentage of images that the approximate algorithm ranks as the first best answer and the exact Palgorithm ranks in the firstly two best positions; i.e. i rankM C (Qi ) = n and rankE (Qi ) ≤ 2;
• Depth3 is the percentage of images that the approximate algorithm ranks as the first best answer and the exact algorithm ranks in the firstly three best posiP tions; i.e. i rankM C (Qi ) = n and rankE (Qi ) ≤ 3.
As we can see from the tables, satisfactory results have been obtained using 16 bins and the MC1 algorithm. As previously reported, with 64 bins the algorithm is not able to correctly approximate the exact distribution, and, hence the results are satisfactory. Finally, this slightly confirms the question Q2.
4. CONCLUSION AND FUTURE WORK In this work we presented a method to reduce the computational complexity to compute color correlograms adopting a Monte Carlo approach to compute the distribution on a subset of pixels uniformly sampled from the original
1 28.8 38.6 39.5
Depth% 2 3 44.0 52.5 58.8 67.9 59.9 69.5
Table 3: MC1 64 bins similarity based error. %Pixel 10 10 10 30 30 30 50 50 50
Table 1: MC1 16 bins similarity based error. %Pixel 2 2 2 5 5 5 10 10 10 20 20 20 30 30 30 40 40 40 50 50 50
%Neighbourhood 100 100 100
%Neighbourhood 10 30 50 10 30 50 10 30 50
1 29.8 27.1 24.8 38.6 38.6 38.8 40.9 43.8 43.7
Depth% 2 3 45.1 52.7 43.7 52.6 42.0 51.7 58.8 67.9 57.0 67.0 58.1 68.4 60.5 69.9 62.8 72.3 62.5 71.9
Table 4: MC2 64 bins similarity based error. image. We showed that it is possible to efficiently extract an approximate distribution of the image features with a resulting low error, and that the resulting approximate distribution slightly affects the similarity-based accuracy. As a future work, we will investigate the applicability of other approximate methods and the possibility to use compression methods to obtain similar results.
5.
REFERENCES
[1] Li Fei-Fei, Rob Fergus, and Pietro Perona. Learning generative visual models from few training examples: an incremental Bayesian approach tested on 101 object categories. In Workshop on Generative-Model Based Vision, 2004. [2] Jing Huang, S. Ravi Kumar, Mandar Mitra, Wei-Jing Zhu, and Ramin Zabih. Image indexing using color correlograms. In IEEE Conference on Computer Vision and Pattern Recognition, pages 762–768. IEEE, 1997. [3] Greg Pass and Ramin Zabih. Comparing images using joint histograms. Multimedia Systems, 7(3):234–240, 1999. [4] Raimondo Schettini, Gianluigi Ciocca, and Isabella Gagliardi. Content-based color image retrieval with relevance feedback. In Proceedings of the IEEE International Conference on Image Processing, pages 75–79, 1999. [5] Michael J. Swain and Dana H. Ballard. Color indexing. International Journal of Computer Vision, 7:11–32, 1991. [6] Leonid Taycher, Marco La Cascia, and Stan Sclaroff. Image digestion and relevance feedback in the imagerover www search engine. In Proceedings of International Conference on Visual Information, pages 85–94, 1997. [7] Adam Williams and Peter Yoon. Content-based image retrieval using joint correlograms. Multimedia tools and Applications, 34:239–248, 2007.


![COLOR IMAGE-ADAPTIVE WATERMARKING ] ,..., ,[ 2 w ... - CiteSeerX](https://m.moam.info/img/260x300/color-image-adaptive-watermarking-2-w-citeseerx_59b291841723dddac6d86854.jpg)