Dec 12, 2005 - A novel Adaptive Color Image Segmentation (ACIS) System for color image segmentation is ... (hue, saturation, intensity), and CMY (cyan, magenta, yellow) [9]. ... used to segment the image based on multiscale 'J-images'.
Electronic Letters on Computer Vision and Image Analysis 5(4):12-23, 2005
An Adaptive Color Image Segmentation Deshmukh K.S.* and Shinde G. N.+ * Computer Science Dept., M.G.M’s CS & IT, Near Air-port, Nanded, India. + Electronics Dept., Y.M. Research center, VIP road, Nanded, India. Received 12 May 2005; accepted 12 December 2005
Abstract A novel Adaptive Color Image Segmentation (ACIS) System for color image segmentation is presented. The proposed ACIS system uses a neural network with architecture similar to the multilayer perceptron (MLP) network. The main difference is that neurons here uses a multisigmoid activation function. The multisigmoid function is the key for segmentation. The number of steps i.e. thresholds in the multisigmoid function are dependant on the number of clusters in the image. The threshold values for detecting the clusters and their labels are found automatically from the first order derivative of histograms of saturation and intensity in the HSV color space. Here, the main use of neural network is to detect the number of objects automatically from an image. The advantage of this method is that no a priori knowledge is required to segment the color image. ACIS label the objects with their mean colors. The algorithm is found to be reliable and works satisfactorily on different kinds of color images. Experimental results show that the performance of ACIS is robust on noisy images also. Key Words: Color Image Segmentation, Adaptive Thresholding, Neural Network.
1.
Introduction
In the field of Computer Vision, image segmentation plays a crucial role as a preliminary step for highlevel image processing. To understand an image, one needs to isolate the objects in it and find relation among them. The process of separation of objects is referred as image segmentation [1]. In other words, segmentation is used to extract the meaningful objects from the image. The earlier research work in the segmentation field was mainly concentrated on monochrome images. Hence it is observed that color image segmentation algorithms are frequently derived from monochrome image segmentation methods. Color is a useful property which adds the information to images. The color perceived by human is a combination of three color stimului such as red (R), green (G), and blue (B), which forms a color space [31]. However, many color models are used to represent the colors in various representations such as RGB (red, green, blue), HSV (hue, saturation, intensity), and CMY (cyan, magenta, yellow) [9]. As compared to monochrome images, color images have the information of brightness, hue and saturation for each pixel. The existing color image segmentation techniques can be classified into five approaches based on edge detection, region growing, neural network based, fuzzy based, and histogram thresholding.
1.1 Edge detection Correspondence to: Recommended for acceptance by Xavier Otazu ELCVIA ISSN: 1577-5097 Published by Computer Vision Center / Universitat Autonoma de Barcelona, Barcelona, Spain
K. S. Deshmukh et al / Electronic Letters on Computer Vision and Image Analysis 5(4):12-23, 2005
13
An edge detector finds the boundary of an object. These methods exploit the fact that the pixel intensity values change rapidly at the boundary (edge) of two regions. Examples of edge detectors are Sobel, Prewitt, and Roberts [14, 16, 18, 23]. For color images the edge detection can be performed on color components separately (such as R, G, and B). These edges are merged to get a final edged image. Jie and Fei [24] proposed an algorithm for natural color image segmentation. In this technique, edges are calculated in terms of high phase congruency in the gray level image. It uses a K- means clustering algorithm to label the long edge lines. The global color information is used to detect approximately the objects within an image, while the short edges are merged based on their positions.
1.2 Region growing These techniques find the homogeneous regions in an image [5, 8, 21]. Here, we need to assume a set of seed points initially. The homogeneous regions are formed by attaching to each seed point those neighbouring pixels that have correlated properties [12, 22, 33]. This process is repeated until all the pixels within an image are classified. However, the obscurity with region based approaches is the selection of initial seed points. Moreover, it is superior to the thresholding method, since it considers the spatial association between the pixels [19]. Deng and Manjunath [20] proposed a JSEG algorithm to segment the image based on multiscale ‘Jimages’. The images which correspond to the measurements of local homogeneities at different scales are called as ‘J-images’. The system has the ability to segment color textured images without supervision. First the colors inside the image are quantized to several classes. The pixels are then replaced by their corresponding color class label which forms the class map of the image. A region growing method is then used to segment the image based on multiscale ‘J-images’.
1.3 Neural network based techniques Neural networks are formed by several elements that are connected by links with variable weights [4]. Artificial neural networks (ANN) are widely applied for pattern recognition. Their processing potential and nonlinear characteristics are used for clustering [2]. Self organization of Kohonen Feature Map (SOFM) network is a powerful tool for clustering [17, 27]. Ji and Park [26] proposed an algorithm for watershed segmentation based on SOM. This method finds the watershed segmentation of luminance component of color image. To solve the problem of over segmentation SOM network is used.
1.4 Fuzzy based techniques Fuzzy set theory gives a mechanism to represent ambiguity within an image [11]. Each pixel of an image has a degree of belongingness (membership) to a region or a boundary. A number of fuzzy approaches for image segmentation are reported in [7, 10, 15, 29, 32]. Li and Li [28] proposed an unsupervised algorithm for color image segmentation. The algorithm uses a neural network to extract features of the image automatically. The multiple color features are analyzed using a self organizing feature map (SOFM). Then the useful feature sequence (feature vector) is determined. The encoded feature vector is used for final segmentation. One of the advantages of this method is that a suitable feature vector for segmentation is extracted automatically. Consequently, this technique is an adaptive approach for segmenting different types of color images.
1.5 Histogram thresholding Histogram thresholding is one of the popular techniques for monochrome image segmentation [3, 34].This technique considers that an image consist of different regions corresponding to the gray level ranges. The histogram of an image can be separated using peaks (modes) corresponding to the different regions. A threshold value corresponding to the valley between two adjacent peaks can be used to separate these object [30]. But one of the weaknesses of this method is that, it ignores the spatial relationship information of the pixels. Guterman [13] proposed a neural network based adaptive thresholding segmentation algorithm for monochrome image. The main advantage of this method is that, it does not require a priori knowledge about number of objects in the image. Navon et al [25] proposed an algorithm for color image segmentation using a
14
K. S. Deshmukh et al / Electronic Letters on Computer Vision and Image Analysis 5(4):12-23, 2005
local threshold values. This technique divides an image into homogeneous regions by using a local threshold values. It calculates the threshold values automatically with the help of merging process. This paper proposes a system for color image segmentation using the concept of multithresholding. The clusters (segments) and their labels are found automatically using the histogram of color image in saturation and intensity plane. The neural network is used to detect multiple objects in the image. The neural network architecture is same in principle to [6]. The network consists of three layers as input layer, hidden layer and output layer. Each layer consists of fixed number of neurons equal to number of pixels in the image. The activation function of neuron is a multisigmoid. The main advantage of this technique is that, it does not require a priori information of the image. The number of objects in the image is found out automatically. The rest of the paper is organized as follows: Section II elaborates the detailed description of the proposed system. Section III presents experimental results. Section IV concludes with summary.
2.
Adaptive Color Image Segmentation System
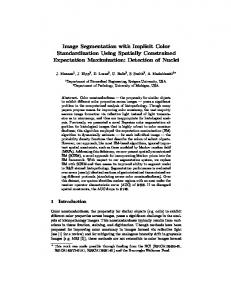
Figure 1 shows the block diagram of proposed ACIS system. ACIS uses HSV (hue, saturation, intensity) space for color image representation. The saturation and intensity planes are utilized for color image segmentation assuming that for a given color objects these are the two parameters that may vary and hue value remains same. The segmentation is carried out in saturation and intensity planes independently. The final segmentation is achieved by combining the results of saturation and intensity planes. The ACIS system is discussed as follows: ACIS system consists of two main processing units as shown in Figure 1. • •
Adaptive threshold block (A). Neural network segmentation block (B).
Figure 1. Block diagram of ACIS. The adaptive threshold block is responsible to find the number of segments in an image. Neural network segmentation block does the actual segmentation based on the number of objects found out by adaptive threshold block. A general flowchart of the working of the proposed method is depicted in Figure 2. As ACIS is a histogram multithresholding technique, we need to find different thresholds to segment objects in the image. To find thresholds, image histogram is smoothed and its derivative is utilized. Smoothing of histogram is required to avoid the small variations in it and to extract a general shape of the histogram curve. After detecting thresholds, labels for the objects are decided. The neurons in neural network use a multilevel sigmoid function as an activation function. The multisigmoid activation for neuron is designed using thresholds found out from the derivative of histogram. This activation function takes care of thresholding and labelling the pixels during recursive training process. The details are given in sections 2.2.
K. S. Deshmukh et al / Electronic Letters on Computer Vision and Image Analysis 5(4):12-23, 2005
15
2.1 Adaptive threshold block The adaptive threshold block is used to find out number of clusters and to compute the multi-level sigmoid function for the neurons. It is crucial to determine the number of clusters in an image so as to segment the objects appropriately. The main endeavour here is to find number of clusters without a priori knowledge of the image. To achieve this, first the histograms of given color image for saturation and intensity planes are found out. From the derivative curve of histogram we find the clusters in saturation and intensity planes independently. A group of saturation/intensity values with histogram derivative transiting from negative to positive (zero crossing) and subsequent positive to negative (zero crossing) is considered into one cluster. Similarly other clusters are found out with the help of zero crossings. The example is as shown in Figure 5. The threshold value is the first zero crossing (shown in Figure 5(e)) and average of two subsequent zero crossings is considered as label (target). The average value as a target helps to segment the object with a color appropriate to its original color. Hence in ACIS system objects are colored with their mean color i.e. system tries to maintain the color property of the object even after segmentation. This can be helpful in image post-processing. Once threshold and target values are calculated, a neural network activation function is constructed [13] as in Equation 1.
Figure 2. System Flowchart.
f ( x) =
[µ ((x − y Where
u Step function
⎛
y k − y k −1
∑ ⎜⎜⎝ 1 + e k
k −1
)× d
− ( x −θ k ) / θ 0
2
⎞ + y k −1 ⎟⎟ × ⎠
)− µ ((x − y
k
)× d
2
)]
(1)
16
K. S. Deshmukh et al / Electronic Letters on Computer Vision and Image Analysis 5(4):12-23, 2005
θ k Thresholds yk Target level of each sigmoid, will constitute the system labels
θ 0 Steepness parameter d Size of neighbourhood.
2.2 Neural network segmentation block ACIS system consists of two independent neural networks one each for saturation and intensity planes. The neural network consists of three layers namely input layer, hidden layer, and output layer as depicted in Figure 3. The input to a neuron in the input layer is normalized between [0-1]. The output value of each neuron is between [0-1]. Each layer is having a fixed number of neurons equal to the size (I x J) of the image. All neurons are having primary connection weight as 1. Each neuron in one layer is connected to respective neuron in the previous layer with its dth order neighborhood as shown in Figure 4. There are no connections between neurons in the same layer. Neural network tuning block is used to update the connection weight as in Equation 2 by taking into consideration the output error in network. At every training epoch, the error is calculated by taking difference between the actual output and the desired output of neuron.
⎛ − ∂E ⎞ ∂Oj ⎟⎟ ∆Wji = n ⎜⎜ Oi ⎝ ∂Oj ⎠ ∂Ij
Output layer
⎛ ⎛ ∂E ∂Ok ⎞ ⎞ ∂Oj n ⎜⎜ ∑ k ⎜ − wkj⎟ ⎟⎟ Oi ⎠ ⎠ ∂Ij ⎝ ⎝ ∂Ok ∂Ik
Hidden layer
(2)
Where
Ii
Total input to the i th neuron
Wji Weight of link from neuron i in one layer to neuron j in the next layer Oi
Output of the i th neuron i in one layer to neuron j in the next layer
E
Error in the network’s output
n
Learning rate.
K. S. Deshmukh et al / Electronic Letters on Computer Vision and Image Analysis 5(4):12-23, 2005
17
Figure 3. Neural network architecture.
(a)
(b)
(c)
Figure 4. Neighborhoods of a pixel (a) First order neighborhood (b) Second order neighborhood (c) Sequence of neighborhood. As the training progresses, a pixel gets the color depending upon its surrounding pixel colors. From the output image shown in Figure 5(b), it can be noted that network tries to label a cluster with an even color spread. We can see that all pixels which represent the ring are assigned to one color label similar to its original color after segmentation. The background is labelled with a color label appropriate to its original color. The segmentation using multiple thresholds is explained with an example in the next section. The technique to find threshold and target is demonstrated in Figure 5. Consider Figure 5(a) to realize the segmentation process. As a first step, thresholds in saturation (S) and intensity (V) planes are found out using histogram of the image in relevant planes. The histograms are then smoothed by passing the histograms through a low pass FIR (Finite impulse response) with a cut off frequency 0.001. Experimentally it is found that 0.001 cut off frequency is a suitable value for various types of images. The Figure 5(d) shows the smoothed histograms. Figure 5(e) shows the first order derivative with threshold. The thresholds are found out by tracking negative to positive transition (zero crossing) and subsequent positive to negative transition (zero crossing) in the derivative curve. The target values are found out by taking the average of two thresholds. By using threshold and target values, the neural network activation function is constructed as Equation 1. Figure 5(f) shows the multisigmoid function. Following are the figures for the saturation plane similar figures are for intensity plane.
(a)
(b)
(c) (d) Figure 5. (a) Original image (b) Segmented image (c) Histogram of the image (d) Smoothed histogram
18
K. S. Deshmukh et al / Electronic Letters on Computer Vision and Image Analysis 5(4):12-23, 2005
(Figure 5 Continued…)
(e) Figure 5. (e) First order derivative with threshold (f) Multisigmoid function.
3. Results and discussion Here we discuss the performance of ACIS system on different types of color images available on the World Wide Web such as [35][36]. Experimental results on images such as “Bacteria”, “Fruit”, “Hand”, “Panda” and “Peppers” are illustrated here. To verify the effectiveness of the proposed method, three types of experiments are conducted to test the capability of ACIS system (i) To isolate objects and label them with colors according to their mean color, (ii) To study effect of neighborhood size discussed in section 2.2 on segmentation and (iii) Performance on noisy images.
3.1 Segmentation results The proposed algorithm is implemented in matlab environment on a Pentium IV, 2.8GHz, 256 RAM. For all the experiments, the proposed method uses a second order (3 x 3) neighborhood scheme for neuron connection scheme as shown in Figure 4. A third order FIR (Finite impulse response) filter with cutoff frequency 0.001 is used to smooth the histogram. Experimentally it is found that 0.001 is a suitable cutoff frequency value for most of the images. The segmentation results for the Figures 6(a)-10(a) are depicted in Figures 6(b)-10(b) respectively. It can be observed from the experimental results that without a priori knowledge system could isolate the objects properly and are labeled with their mean colors. In case of Figure 8(a), where background is multicolor texture, the object (hand) is extracted properly and is labeled with its mean color Figure 8(b). Experiments were also carried out to see the effect of neighborhood size on segmentation. The result with increased neighborhood size (5x5) can be seen in Figure 11(b). It can be observed that as the neighborhood size is increased better smoothing is obtained at the cost of loss of details. Increase in the
K. S. Deshmukh et al / Electronic Letters on Computer Vision and Image Analysis 5(4):12-23, 2005
19
neighborhood in Figure 11(b) results into better segmentation of background and foreground compared to Figure 9(b).
3.2 Performance on noisy images The Effectiveness of ACIS system on noisy images is illustrated here. Panda image is distorted with different types of noise such as “Gaussian”, “Salt & Pepper”, and “Speckle” with mean 0 and variance 0.1, 0.01, 0.02 respectively. Figures 12(b)-14(b) show the segmentation results of distorted Panda image. Robust performance of the system on noisy images can be observed from the experimental results.
(a)
(b) Figure 6. (a) Original image (b) Segmented image.
(a) Figure 7. (a) Original image (b) Segmented image.
(a)
(b)
(b)
20
K. S. Deshmukh et al / Electronic Letters on Computer Vision and Image Analysis 5(4):12-23, 2005
Figure 8. (a) Original image (b) Segmented image.
(a) (b) Figure 9. (a) Original image (b) Segmented image.
(a)
(b) Figure 10. (a) Original image (b) Segmented image.
(a)
(b)
Figure 11. Effect of increased neighborhood size (a) Original image (b) Segmented image with 5x5 neighborhood.
K. S. Deshmukh et al / Electronic Letters on Computer Vision and Image Analysis 5(4):12-23, 2005
21
(a) (b) Figure 12. (a) Original image with Gaussian noise (b) Segmented image.
(a) (b) Figure 13. (a) Original image with Salt & Pepper noise (b) Segmented image.
Figure 14 (a) Original image with Speckle noise (b) Segmented image. However, to segment heavily multicolor textured object from multicolored background is a difficult job (Figure 15) and is concern for further work.
Figure 15.
22
K. S. Deshmukh et al / Electronic Letters on Computer Vision and Image Analysis 5(4):12-23, 2005
4. Conclusion A novel system for adaptive color image segmentation is described. The segments in images are found automatically based on adaptive multilevel threshold approach. One of the advantages of this system is that it does not require a priori information about the number of objects in the image. The use of first order derivative of histogram is found to be a powerful method to find clusters in the image. The neural network with multisigmoid function tries to label the objects with its original color even after segmentation. ACIS system is tested on several images and its performance was found satisfactory. The system can be used as a primary tool to segment unknown color images. Experimental results show that the system performance is robust to noisy images.
References [1] A.K. Jain, Fundamentals of Digital Image Processing, Upper Saddle River, NJ: Prentic Hall, 1989. [2] Simon Haykin, Neural Networks A Comprehensive Foundation, Pearson Education, 1999. [3] J.S. Weszka, “A Survey of threshold selection techniques”, Computer Graphics Image Process, 7: 259-265, 1978. [4] Jacek M. Zurada, Introduction to Artificial Neural Systems, Jaico publishing house, Mumbai, 2002. [5] K.S. Fu, J. K. Mui, “A survey on image segmentation”, Pattern Recognition, 13: 3-16, 1981. [6] K.S.Deshmukh, G.N. Shinde, A.V. Nandedkar, Y.V. Joshi, “Multilevel approach for color image segmentation”, Fourth Indian Conf. on Computer Vision, Graphics and Image Processing, 338-344, 2004. [7] L.O. Hall, A. Bensaid, L. Clarke, R. Velthuizen, M. Silbiger, J. Bezdek, “A comparison of neural network and fuzzy clustering techniques in segmenting magnetic resonance images of the brain”, IEEE Trans. Neural network, 3: 672-682, 1992. [8] L. Spirkovska, “A Summary of image segmentation techniques”, Computer Graphics Image Process, 7: 259-265, 1978. [9] R. C. Gonzalez, R.E. Woods Digital Image Processing, Pearson Education Pet. Ltd. New Delhi. [10] S. K. pal et al. “A review on image segmentation techniques”, Pattern recognition, 29: 1277- 1294, 1993. [11] S.K. Pal, “Image segmentation using fuzzy correlation”, Inform. Sci, 62: 223-250, 1992. [12] Y. Zhang, “A survey on evaluation methods for image segmentation”, Pattern Recognition, 29(8): 335-1346, 1996. [13] V. Boskovitz, Hugo Guterman, “An adaptive neuro fuzzy system for automatic image segmentation and edge detection”, IEEE Transaction fuzzy systems, 10(2): 247-262, 2002. [14] G.S. Robinson, “Color edge detection”, Opt. Eng, 16(5): 479-484, 1977. [15] H.D. Cheng, X.H. Jiang, Y. Sun, Jingli Wang, “Color image segmentation: advances and prospectus”, Pattern Recognition, 34: 2259-2281, 2001. [16] J. Canny, “A computational approach to edge detection”, IEEE Trans. Pattern Anal. Mach. Intell, 8(6): 679-698, 1986. [17] M. Egmont Peterson, D. de. Ridder, H. Handels, “Image processing with neural network – a review”, Pattern Recognition, 34: 2279-2301, 2002. [18] Milan Sonka, Vaclav Hlavac, Roger Boyle Image Processing, Analysis, and Machine Vision, Brooks/Cole Publishing Company. [19] R. Ohlander, K. Price, D.R. Reddy, “Picture segmentation using a recursive region splitting method”, Computer Graphics Image Processing, 8: 313-333, 1978. [20] Yining Deng, B.S. Manjunath, “Unsupervised segmentation of color texture region in images and video”, 1-25, 2001.
K. S. Deshmukh et al / Electronic Letters on Computer Vision and Image Analysis 5(4):12-23, 2005
23
[21] R. Adams, L. Bischof, “Seeded region growing”, IEEE Trans. Pattern Analysis and Machine intelligence,16: 641-647, 1994. [22] T.Q. Chen, Y. Lu, “Color image segmentation-an innovative approach”, pattern recognition, 25: 395-405, 2001. [23] K. Nevita, “Color edge detection and its use in scene segmentation”, IEEE Transaction System Man Cybernetics (SMC), 7(11): 820-826, 1977. [24] Xu Jie, Shi Peng Fei, “Natural color image segmentation”, ICIP, 973-976, 2003. [25] Ety Navon, Often Miller, Amir Averabuch, “Color image segmentation based on adaptive local thresholds”, Image and vision computing, 23: 69-85, 2005. [26] S. Ji, H.W. Park, “Image segmentation of color image based on region coherency”, International Conference on Image Processing, 80-83, 1998. [27] You Shen Lo, Soo Chang Pei, “Color image segmentation using local histogram and selforganization of Kohonen feature map”, International Conference on Image Processing, 232-239, 1999. [28] N. Li, Y.F. Li, “Feature encoding for unsupervised segmentation of color images”, IEEE Transactions on Systems Man Cybernetics (SMC), 33(3): 438-446, 2003. [29] J.C. Bezdek, P.F. Castelaz, “Prototype classification and feature selection with fuzzy sets”, Pattern Recognition Letter, 483-488, 1993. [30] Sahoo P.K. et al “A survey on thresholding techniques”, Computer Vision Graphics Image Processing, 41: 233-260, 1988. [31] Xiu-Qi Li, Shu-Ching Chen, Mei-Ling Shyu, Borko Furht, “An efficient content-based visual image retrieval system”, IEEE Computer Society International Computer Software and Applications Conference (COMPSAC), 2002. [32] N.R. Pal, S.K. Pal “Object-background segmentation using new definition of entropy”, IEE Proc. Part E, 136(4): 284-295, 1989. [33] Skarbek W. et al “Color image segmentation – A survey”, Technical Report, Tech. Univ. of Berlin, 1994. [34] S.K. Pal, A. Rosenfeld, “Image enhancement and thresholding by optimization of fuzzy compactness”, Pattern Recognition Letter, 7: 77-86, 1988. [35] Computer Vision Test Images, http://www.cs.cmu.edu/~cil/v-images.html [36] Manolis Lourakis, “ECVNET Image Database”, http://zeus.ics.forth.gr/forth/ics/cvrl/proj/ecvnet/imagedb