ance of galaxy countsâinâcells on a scale R, using eq. (61). These methods are ..... tensions of the model such as mixed dark matter (CHDM) or CDM plus a.
arXiv:astro-ph/9505005v1 2 May 1995
Approximation Methods for Non–linear Gravitational Clustering Varun Sahni IUCAA – Inter–University Centre for Astronomy & Astrophysics, Post Bag 4, Ganeshkind, Pune 411007, India
and
Peter Coles Astronomy Unit, School of Mathematical Sciences, Queen Mary & Westfield College, Mile End Road, London E1 4NS, United Kingdom
Abstract: We discuss various analytical approximation methods for following the evolution of cosmological density perturbations into the strong (i.e. nonlinear) clustering regime. We start by giving a thorough treatment of linear gravitational instability in cosmological models and discussing the statistics of primordial density fluctuations produced in various scenarios of structure formation, and the role of non–baryonic dark matter. We critically review various methods for dealing with the non–linear evolution of density inhomogeneities, in the context of theories of the formation of galaxies and large–scale structure. These methods can be classified into five types: (i) simple extrapolations from linear theory, such as the high–peak model and the lognormal model; (ii) dynamical approximations, including the Zel’dovich approximation and its extensions; (iii) non–linear models based on purely geometric considerations, of which the main example is the Voronoi model; (iv) statistical solutions involving scaling arguments, such as the hierarchical closure ansatz for BBGKY, fractal models and the thermodynamic model of Saslaw; (v) numerical techniques based on particles and/or hydrodynamics. We compare the results of full dynamical evolution using particle codes and the various other approximation schemes. To put the models we discuss into perspective, we give a brief review of the observed properties of galaxy clustering and the statistical methods used to quantify it, such as correlation functions, power spectra, topology and spanning trees.
To appear in Physics Reports (1995)
1. Introduction The last two decades have been an exciting period for astrophysicists working on the problem of the origin of the large–scale structure of the Universe. Over this period, as a result of a continual interplay between theory and observation, a picture has emerged within which most of the properties of galaxy clustering can be understood. In this picture the Universe is almost homogeneous in the early stages, but has some small amplitude density inhomogeneities with a characteristic spectrum. The theory of inflation can offer explanations for both the initial almost– smoothness and the small density perturbations. As the Universe evolves, these perturbations grow by gravitational instability, at first linearly (so that the evolution of the different spatial Fourier modes are independent and the perturbations have a small amplitude), but eventually forming non–linear concentrations of mass (where the Fourier modes are coupled together and the density perturbations are large); these non–linear concentrations are the eventual sites for galaxy and cluster formation. An important ingredient in this picture is the (postulated) existence of large quantities of non–baryonic dark matter which allow fluctuations to begin to grow even in the early phases of the evolution of the Universe when radiation pressure inhibits the growth of structure in the baryonic material. This general idea has some empirical confirmation from both galaxy clustering data and, most recently, by the discovery by the COBE satellite of small anisotropies in the Cosmic Microwave Background radiation, which may be the signature of primordial density perturbations. Successful though this basic picture has been, it has to be admitted that at present there is no model of galaxy and structure formation that can account for all the observational data. Models with different kinds of dark matter, different initial fluctuation spectra, different relationships between luminous material and dark matter have all been suggested at various times but none has been successful enough to deserve the status of a “standard model” of galaxy formation. The most fundamental problem one must tackle in a theory of the origin of large–scale structure is that structures around us in the Universe today correspond to density fluctuations many orders of magnitude greater than the mean density of the Universe. A galaxy cluster, for example, will have a density around a factor 1000 greater than the mean density of cosmic material. This means that such structures are non–linear objects. While the growth of density fluctuations in an expanding Universe is tractible analytically if the fluctuations are small (using linear perturbation theory), there is no general exact solution for the non–linear regime. Traditionally, astrophysicists have
2
therefore resorted to numerical N–body methods to understand this latter regime. Alternatively, one can try to look to scales large enough so that density fluctuations are small enough that linear theory is still applicable. The problem with the former approach is that such methods are extremely time– consuming and can only be used to look at a small part of the parameter space of possible models. The latter approach has two weaknesses. One is that it is extremely hard to obtain direct empirical information about galaxy clustering on such large scales (and galaxy clustering need not give us direct information about the mass distribution). The second problem is that we actually want to understand the formation of non–linear objects, not just the super–large structures which are still evolving more–or–less linearly. What has been missing is a good theoretical understanding of the non–linear regime of gravitational clustering. Being able to produce a particular clustering property in a numerical simulation is not the same as understanding it! In recent years, however, there has been a great deal of interest in analytical methods for studying this difficult problem. Various approximation schemes have been suggested which can be applied to study different aspects of the growth of non–linearity in the cosmological mass distribution. These range from straightforward perturbative extensions of linear theory, to simplified kinematical models, scaling solutions and arguments based on statistical mechanics. The description of galaxy clustering is essentially statistical, but its origin is dynamical. Different aspects of the clustering pattern are therefore reproduced with differing degrees of accuracy by different approximation schemes. Our aim in this review is to give a thorough treatment of the most important of these approximation schemes, explaining their physical motivation and, where appropriate, suggesting situations where they might be sufficiently accurate to be useful. We have tried to make the paper as self–contained as possible, so we have included a fairly thorough grounding in linear perturbation theory before introducing the non–linear approximations. To put these methods in context, we have also included a discussion of numerical simulation methods and some aspects of the statistical analysis of galaxy clustering. We do, however, assume basic knowledge of physical cosmology such as can be obtained from [324,447,579].
2. Cosmological Perturbations and Linear Evolution
3
2.1. Field Equations for the Unperturbed Universe. The Universe is generally believed to be homogeneous and isotropic on scales greater than several hundred Mpc. This assumption is largely based upon the observed homogeneity in the large scale distribution of galaxies, radio galaxies and QSO’s. In addition, the extremely small degree of anisotropy of the Cosmic Microwave Background Radiation (CMBR) (which travels to us virtually unhindered from the surface of last scattering located at a cosmological redshift of ∼ 1100) indicates that the Universe was extremely isotropic (to one part in ∼ 105 ) at the time when matter and radiation decoupled. This suggests that our basic starting point 1 for the study of the origin of inhomogeneity should be an isotropic and homogeneous background model.
2.1.1. FRW Models The Friedmann–Robertson–Walker line element describes a homogeneous and isotropic Universe 2 dr 2 ds = dt − a (t) + r 2 dθ2 + r 2 sin2 θdφ2 1 − κr 2 2
2
2
!
κ = 0, ± 1
(1)
where a(t) is the cosmic scale factor. The dynamics of a FRW Universe is determined by the Einstein field equations: Gνµ = 8πGTµν where Tµν is the energy–momentum tensor describing the contents of the Universe. For a perfect fluid ρ = T00 , P = −Tαα and the Einstein equations simplify considerably to 3
� �2
a˙ a
= 8πGρ −
3κ +Λ a2
4πG Λ a ¨ =− (ρ + 3P ) + a 3 3 a˙ ρ˙ = −3 (ρ + P ). a
(2)
The cosmological constant Λ increases the acceleration of the Universe compared to models containing only matter and/or radiation. It has been introduced on several occasions into the theory in attempts to make cosmological models more compatible with observations. A central issue, presently unresolved in cosmology, is the current value of the Hubble parameter and the matter density. Although the density of the Cosmic Microwave Background 1
We should mention that, although considerable effort has been directed towards the study of perturbations, rather less effort has been expended on the subject of how to fit a background model to an observed lumpy Universe in an optimal way [184]. 2 We set the velocity of light c = 1 for simplicity.
4
radiation is known to a high degree of accuracy to be ρr = 4.7 × 10⁻³⁴ g cm−3 , the density of matter is known only to within an order of magnitude, the uncertainty in ρ being usually expressed in terms of the dimensionless density parameter ρ 8πGρ Ω≡ = . (3) ρcr 3H 2 Present observations limit Ω to lie within the range 0.02 ≤ Ω ≤ few. The value of the Hubble parameter is known to within about a a factor of two to be 0.4 ≤ h ≤ 1 where h is the dimensionless Hubble parameter expressed in units of 100 km s−1 Mpc−1 . The uncertainties in H0 and Ω are of course related, because of the definition of Ω (3). The value of the cosmological constant is equally uncertain, being loosely constrained by the inequality |ΩΛ | = |Λ|/3H 2 < 0.6 with 90% confidence [541,364,363]. From (1) & (2) we can obtain analytical forms for the scale factor for some physically interesting cases.
2.1.2. Spatially Flat Universe with One Matter Component In this case we have Ω = 1 and the scale factor evolves according to t a(t) = t0 �
�p
≡
η η0
! 1 −ν 2
(4)
for a perfect fluid with 2 3(1 + w) P w= ρ 3p − 1 ν= 2(p − 1) p=
(5)
and η is the conformal time coordinate η=
Z
dt . a(t)
Some special instances of eq. (4) are: (i) pressureless matter or dust √ (w = 0): a(t) ∝ t2/3 , a(η) ∝ η 2 (ii) radiation (w = 31 ) : a(t) ∝ t, a(η) ∝ η.
5
(6)
2.1.3. Spatially Flat Models with Two Non–interacting Fluids Here the interesting solutions are: (i) dust + radiation: a(η) ∝ η (η + η0 ), q (ii) radiation + stiff matter (w = 1): a(η) ∝ η (η + η0 ), �
(iii) dust + cosmological constant: a(t) ∝ sinh 32
q
�2/3
Λ ct 3
2.1.4. Spatially Curved Models In this case we divide into open models (Ω < 1), where we have (i) Dust: a(η) = A(cosh η − 1), ct = A(sinh η − η) (ii) Radiation: a(η) = A′ sinh η, ct = A′ (cosh η − 1), while for closed modes (Ω > 1) we have (i) Dust: a(η) = A(1 − cos η), ct = A(η − sin η) (ii) Radiation: a(η) = A′ sin η, ct = A′ (1 − cos η). 2.1.5. Other Useful Relations It is sometimes convenient to express the Hubble parameter and the FRW equations in terms of the cosmological redshift parameter 1+z =
a0 . a(t)
(7)
In terms of this new parametrisation, the Hubble parameter in a multicomponent Universe consisting of several non-interacting matter species characterised by equations of state Pα = wα ρα is given in a very simple form: "
H(z) = H0 (1 + z) 1 − For a spatially flat Universe 1 −
P
X
Ωα +
α
α
H(z) = H0 (1 + z)
X
Ωα (1 + z)
1+3wα
α
#1 2
.
(8)
Ωα = 0 and equation (8) reduces to "
X
Ωα (1 + z)1+3wα
α
#1 2
(9)
In a Universe consisting only of dust, 1
H(z) = H0 (1 + z)(1 + Ω0 z) 2 6
(10)
In this case the expression for the density parameter turns out to be particularly simple: Ω0 (1 + z) Ω(z) = (11) 1 + Ω0 z for large values of Ωz >> 1, Ω(z) → 1, indicating that the density always approaches the critical value at early times. A useful relationship between the cosmological time parameter t and the cosmological redshift z can be obtained by differentiating 1 + z = a0 /a(t) with respect to time so that dz/dt = −H(z)(1 + z). For a Universe consisting only of dust this leads to H0 t(z) =
Z∞ z
dz ′ 1
.
(12)
(1 + z ′ )2 (1 + Ω0 z ′ ) 2
Evaluating the integral in eq. (12) we get [579]: t(z) =
t(z) = t(z) =
H0−1
(1 + Ω
1 0 z) 2
1 − Ω0 H0−1
Ω0 − 1
π 2
2H0−1
1+z
2(1 −
Ω0 (Ω0 −
Ω0
+
1 1) 2
−
1 Ω0 ) 2
Ω0 (Ω0 −
1 1) 2
(1 +
log
(1 + �
arctan (
1 Ω0 z) 2 1 Ω0 z) 2
1+ Ω0 − 1
− (1 −
+ (1 − Ω0
Ω0 z 1 )2
�
−
1 )2
1 Ω0 ) 2
1 Ω0 z) 2
(1 + 1+z
(13)
3
3(1 + z) 2
for the cases Ω0 < 1, Ω0 > 1 and Ω0 = 1, respectively. For a spatially flat Universe with a cosmological constant (ΩΛ = 1 − Ω) the present age of the Universe is given by [318]: −1
t0 = 6.5h
�
√ � 1 1+ 1−Ω √ √ log × 109 yr. 2 1−Ω 1− 1−Ω
(14)
In the limit Ω → 1 we recover t0 = 6.5 h−1 Gyr. 2.2. Gravitational Instability: Linear Theory Having briefly described some properties of the evolution equations governing the expansion of a homogeneous and isotropic Universe, let us now consider small departures from homogeneity and isotropy which eventually grow to become galaxies and other cosmic structures. The line element which appropriately describes the perturbed FRW Universe in the synchronous gauge, the 7
most convenient gauge choice for many purposes, has the form ds2 = ds2F RW + hαβ dxα dxβ ,
(15)
where α, β = 1, 2, 3, and ds2F RW is the FRW line element given by eq. (1). In the linearised approximation which we shall follow, perturbations of the metric are assumed to be small hαβ hαβ 1 on scales < 1 Mpc, while δ < 1 on scales greater than 10 − 30 Mpc. For spatially open and closed FRW models it is convenient to find general solutions of eq. (27) by noting that the decreasing mode is simply proportional to the Hubble parameter [254,579]. To see this, differentiate the Einstein equation H˙ +H 2 = −4πG(ρ−2Λ)/3, and use the continuity condition ρ˙0 = −3Hρ0 , ¨ + 2H H˙ − 4πGρH = 0. This shows that D− (t) ∝ H is indeed a leading to H solution to eq. (26). The second solution of eq. (26) can be constructed from D− (t) and the Wronskian of eq. (26): W (t) = D˙+ D− − D˙− D+ ∝ a−2 . This 10
gives D+ (t) = D− (t)
Zt
′
W (t
Substituting a(z) = a0 (1 + z)−1
Zt
dt′ = H(a) a2 (t′ )H2 (t′ )
Za
da . (Ha)3 (33) with H(z) defined in (10) we obtain
−2 ′ )D− (t ) dt′
−2
= H(t)
D+ (z) = (a0 H0 ) (1 + z)(1 +
1 Ω0 z) 2
Z∞ z
dz′ . (1 + z′ )2 (1 + Ω0 z′ )3/2
(34)
Equation (34) can be integrated to give 1
(1 + z)(1 + Ω0 z) 2 1 + 2Ω0 + 3Ω0 z + 3Ω D+ (z) = f (Ω0 , z), 0 5 |1 − Ω0 |2 |1 − Ω0 | 2
(35)
where
(1 +
f (Ω0 , z) = − 21 log
(1 +
1 Ω0 z) 2 1 Ω0 z) 2
1 + Ω0 z f (Ω0 , z) = arctan Ω0 − 1 �
�1 2
+ (1 − − (1 −
1 Ω0 ) 2 1 Ω0 ) 2
,
(36)
for the cases Ω0 < 1 and Ω0 > 1, respectively. In the simpler case where Ω0 = 1, we have D+ (z) ∝ (1 + z)−1 (37) A good approximation to D+ (z) for Ω0 < 1 can be provided by the fitting formula [579] 3 D+ (z) ≃ 1 + Ω0 2 �
3 5 1 + Ω0 + Ω0 z 2 2
��
�−1
.
(38)
−1 From equations (35) & (38), we find that, for z >> Ω−1 – a 0 , D+ ∝ z consequence of the fact that the Universe at early times expands at the critical rate a ∝ t2/3 regardless of the value of Ω0 . For open models we find that, at late times (corresponding to z λJ remain unaffected by pressure forces and continue to grow in accordance with the relations discussed in §2.3. On the other hand, small scale perturbations feel the effects of pressure gradients and oscillate as acoustic waves with a steadily decreasing amplitude. Prior to recombination, Thomson scattering couples photons and electrons together, as a result of which the two components matter and radiation behave effectively as a single fluid in which the adiabatic speed of sound is [169] !−1/2
c vs = √ 3
3ρm +1 . (49) 4ργ √ Substituting√ ρr = 3/(32πGt2 ) and vs ≃ c/ 3 in eq. (48), we obtain λJ = αct where α = 4 2π/3. As a result we find that the Jeans length scales with the cosmological horizon during the radiation dominated epoch. The associated Jeans mass at recombination has the value MJ ≃ 9 × 10¹⁶ (Ωh2 )−2 M⊙
(50)
which is similar to the estimated masses of superclusters of galaxies. After recombination is complete photons cease coupling to electrons (which are no longer free) so that the pressure support is now provided by neutral hydrogen atoms instead of by radiation. As a result the speed of sound drops abruptly to vs ≃ (5kB T /3mp )1/2 (mp being the proton mass and kB is Boltzmann’s constant), the corresponding value of the Jeans mass falls by over ten orders of magnitude to [169] 1
MJ ≃ 1.3 × 10⁵ (Ωh2 )− 2 M⊙ 14
(51)
which is similar to the mass of a globular cluster. On scales smaller than the Jeans scale dissipative processes define yet another length scale below which the amplitude of density perturbations is exponentially damped. This scale (set by the so-called Silk length λs ) arises because although Thomson scattering couples photons and baryons together before recombination, this coupling weakens as recombination is approached (due to the increasing mean free path of the photon) leading photons to leak out from overdense regions and into underdense regions carrying the still tightly coupled electrons with them. This leads to an exponential damping of inhomogeneities in the photon-baryonic plasma on scales λ < λs , where λs is the Silk length at recombination, the associated Silk mass is [169] Ms ≃ 1.3 × 10¹² (Ωh2 )−3/2 M⊙
(52)
2.4. Statistics of Primordial Density Fluctuations So far we have talked only about the evolution of a single Fourier mode of the density field δ(~x, t) = D+ (t)δ(~x). In the general case, however, the density field will consist of a stochastic superposition of such modes with different amplitudes. Writing the Fourier transform of δ(~x) as ˆ ~k) = δ(
1 (2π)3
which has inverse δ(~x) =
Z
Z
~
d3~xe−ik·~x δ(~x),
~
ˆ ~k), d3 keik·~x δ(
(53)
(54)
ˆ Recall the Dirac delta– it is useful to specify the properties of δ in terms of δ. function: Z 1 ~ d3~xe±ik·~x . (55) δ D (~k) = (2π)3 In terms of this function, we can define the power–spectrum of the field to be ˆ ~k): the autocovariance of δ( ˆ ~k1 )δ( ˆ ~k2 )i = P (k1)δ D (~k1 + ~k2 ). hδ(
(56)
The presence of the delta–function in this definition takes account of the symmetry and reality requirements for P (k) [43]. The analogous quantity in real space is called the two–point correlation function or, more correctly, the autocovariance function: hδ(~x1 )δ(~x2 )i = ξ(|~x1 − ~x2 |) = ξ(r),
(57)
which is related to the power spectrum by the Wiener–Khintchin relations which are discussed in §8.4. Both the power spectrum and the covariance 15
function of the present–day density field can be estimated by calculating analogous quantities for discrete galaxy counts, as described in §8.5. The power spectrum or, equivalently, the autocovariance function, of the density field is a particularly important statistic because it provides a complete statistical characterisation of the density field for a particular kind of stochastic field: a Gaussian Random Field. This class of field is the generic prediction of inflationary models where the density fluctuations are generated by quantum fluctuations in a scalar field during the inflationary phase 3 . We shall assume for virtually all of this paper that the primordial δ(~x) is a Gaussian random field. Formally, this means that the Fourier modes have a Rayleigh distribution of amplitudes and the phases are independent and uniformly random on [0, 2π]. Writing ˆ ~k) = |δk | exp(iφk ) δ( (58) gives
1 |δk |2 dP (|δk |) = 2 exp − 2 |δk | d|δk |, σ 2σ !
(59)
where σ 2 ∝ P (k). All the joint probability distributions of δ(~x1 ) . . . δ(~xn ) are n–variate Gaussian distributions for this type of field and this property makes many properties of the spatial distribution of density fluctuations calculable analytically [161,6,286,432,23]. Many other physically–interesting properties can be related to the power spectrum. For example, consider the mean square density fluctuation 4 δρ h ρ
!2
i = hδ(~x)δ(~x)i = 4π
Z∞
P (k)k 2 dk.
(60)
0
This definition of the mean–square fluctuation takes into account contributions on all scales and may, depending on the form of P (k), actually diverge. A more physically realistic quantity to use is the mean square fluctuation smoothed on a given scale R, which can be shown to be σ 2 (R) =
Z
d3~kW2 (kR)P(k),
(61)
where W (x) is the Fourier transform of the filter function used to smooth the density field in real space. for example, a spherical top–hat function in real space gives 3 W (x) = 3 (sin x − x cos x); (62) x 3
Gaussian random processes also occur generically in linear physics due to the central limit theorem. 4 Both the spatial average and the ensamble average are equivalent for a Gaussian random field, which is said to be ergodic.
16
whereas a Gaussian real–space filter function leads to a Gaussian Fourier domain function (which is a useful property). 5 In the linear regime, the density field retains its initial Gaussian character, so that 1 δ2 √ exp − 2R P (δR ) = . 2σR (t) σR (t) 2π "
#
(63)
For a Gaussian distribution all moments of order n > 2 are either zero (odd) or can be expressed in terms of σ 2 (even). The cumulants, or connected moments are zero for n > 2 for such a distribution, §8.3. Furthermore, assuming the linearised continuity equation and Poisson equations are valid, one can calculate such quantities as the mean square velocity smoothed on a scale R and the mean square gravitational potential fluctuation. It is useful to express these, and the mass fluctuation, in terms of the contribution from a logarithmic interval in k-space: dσ 2 = 4πk 3 P (k); d log k dσv2 = 4π(aHf )2 kP (k); d log k �2 � dσφ2 P (k) 3 = 4π Ω0 H 2 a2 . d log k 2 k
(64)
We discuss the use of velocity statistics in §8.10. The general picture that emerges is that, while the amplitude of each Fourier mode remains small, i.e. δ(~k) ≪ 1, linear theory applies. In this regime, each Fourier mode evolves independently and the power–spectrum therefore just 2 2 scales as P (k, t) = P (k, t1 )D+ (k, t)/D+ (k, t1 ). Even if δ > 1 for large k, one can still apply linear theory on large scales by applying a filter as discussed above to remove the non–linear scales. Generally, it is assumed that a scale evolves linearly as long as σ 2 (R) < 1, though as we shall see this is not always correct. For scales larger than the Jeans length, this means that the shape of the power spectrum is preserved during linear evolution. Only when scales go non–linear does the shape of the spectrum begin to change. Of course, scales below the Jeans length do not grow relative to those above and so the shape of the spectrum is distorted even in the linear phase. In the popular models with non–baryonic dark matter, and models which have significant Silk damping there are other effects suppressing the growth of fluctuations in the linear regime. To complete the picture we need to specify the shape of some initial fluctuation spectrum which exists at some arbitrary time before it can be distorted by 5
Useful mathematical properties of the top–hat window function are discussed in [36].
17
damping processes. The inflationary scenario often produces a power–law form P (k) = Ak n ,
(65)
with many models having the Harrison–Zel’dovich form n = 1. Even if inflation is not the origin of density fluctuations, the form (65) is a useful phenomenological model for the fluctuation spectrum. Given the current plethora of Inflationary Universe models, the value of the primordial amplitude A is usually determined empirically [324]. First attempts to normalise P (k) used counts of galaxies. Because one wants to use linear theory to normalise the spectrum – and thus avoid any physical process which distorts the spectrum’s shape, rather than its amplitude – it is necessary to measure fluctuations on rather large scales. A useful way to do this is using J3 , which is defined by J3 (R) ≡
ZR 0
ξ(r)r 2dr =
R3 Z 3~ 2 d kW (kR)P(k) 3
(66)
where W (x) is defined by eq. (62). Alternatively, one can measure the variance of galaxy counts–in–cells on a scale R, using eq. (61). These methods are discussed in §8.5. The problem with such attempts to normalise the spectrum are two–fold. First, there is the problem that redshift surveys probe only a comparatively small volume of space and we need large scales for linear theory to be reliable. Secondly, and more fundamental, is the problem that we do not know how to relate galaxy counts and mass fluctuations in an unambiguous way. This ignorance is usually parametrised by the phenomenological relationship ! ! δN δρ =b , (67) N ρ but the bias factor 6 b may well be scale–dependent[286,157,290,122,83]. The fact that the velocity flow induced by density perturbations is sensitive to the total mass fluctuation, not just the part that is in galaxies, suggests that one should use statistics of the velocity field to normalise the spectrum. This idea is discussed in §8.1.5 & §8.10. The problem with this is that our knowledge of the detailed statistics of the velocity field is rather poor. 6
Although we shall deal extensively with the origin of structure in this paper, we shall not deal with the even harder problem of how individual galaxies form. Quite apart from the need to accumulate enough mass to form a galactic halo, one also needs to understand star formation, hydrodynamical processes during the protogalactic collapse and the possible role of environmental feedback processes on the forming object. All this physics is encapsulated in the bias parameter b. That an attempt should be made to embody such complicated effects in a single parameter is ample evidence that we are not close to a theory of galaxy formation.
18
As we shall see in §2.7, the COBE satellite’s detection of CMBR anisotropy has allowed us to circumvent these difficulties and obtain a relatively model– independent normalisation of the power spectrum appropriate for models of structure formation. Before we discuss this, however, we need to look in more detail at models of structure formation involving non–baryonic dark matter.
2.5. Non–Baryonic Dark Matter We would now like to describe currently popular cosmological models in which the matter content of the Universe is usually considered to be in the form of two non-interacting fluids. The first is presumed to be dissipationless and nonbaryonic whereas the second is made up of baryons (WIMPs such as massive neutrinos and SUSY particles, or axions, are possible candidates for nonbaryonic matter 7 , whereas the baryonic material is presumed to be composed predominantly of neutral hydrogen and helium at early times). The need to incorporate non–baryonic forms of matter into the standard big bang model arises because of the necessity to generate large enough perturbations to account for the presence of galaxies, from sufficiently small initial values of the density contrast δρ/ρ, without violating the CMBR constraints on small, i.e. arc minute angular scales. This is a difficult task in baryonic models in which perturbation growth takes place only after the cosmological recombination of hydrogen, which occurs at redshifts ∼ 1100. Before recombination, radiation pressure caused by Thomson scattering effectively prevents the growth of all perturbations having wavelenths smaller than ∼ 180h−1 Mpc, the horizon size at recombination. After recombination, density perturbations grow linearly with the scale factor of the Universe, a(t), until the Universe becomes dominated by curvature or by a cosmological constant, after which time perturbation growth is strongly suppressed (if Ω0 < 1). The maximum permitted growth factor for perturbations is therefore δ/δrec ≤ a0 /arec ≃ 1100 (for Ω ≤ 1 ). Consequently, the requirement that δ > 1 today – which is a necessary (but not sufficient) condition for the formation of gravitationally bound systems such as galaxies – leads to the primordial amplitude: δ ≈ 10−3 at recombination. If the primordial perturbations are adiabatic (i.e. fluctuations for which the entropy per baryon is spatially constant), then at recombination 3 δT δB = δγ = 3 (68) 4 T so that a fluctuation amplitude ∼ 10−3 in the baryon component would invariably result in an anisotropy ∼ 10−4 in the CMBR temparature on arc minute scales which has not been observed. On the other hand, perturbations in a nonbaryonic component, can begin growing soon after matter–radiation 7
WIMP means Weakly Interacting Massive Particle.
19
equality has been achieved (i.e. by z ∼ 104 in the case of an Ω = 1 Universe) with the result that large final perturbations can develop from small initial values without violating the CMBR constraints on small scales [443,507,516]. The existence of non–baryonic matter is also strongly suggested by the observed density of matter in the Universe parametrised by Ω0 . Although the value of Ω0 is not precisely known, most observations place it in the range bounded by 0.1 ≤ Ω ≤ 1 with some indications that Ω could be as large as unity, in agreement with predictions made by the Inflationary Universe scenario [290,414,155,125,153]. A value of Ω greater than ∼ 0.1 would require the presence of some form of non–baryonic matter since primordial nucleosynthesis imposes rather stringent constraints on the contribution to Ω0 from baryons: Ωb ≃ 0.016h−2 [417]. Gravitational instability in a two component medium with Ω = 1 consisting of baryons and dark matter is governed by the following coupled system of equations (again to linear order): a˙ ˙ kv1 δ¨1 + 2 δ1 + a a � �
!2
δ1 = 4πG(ρ1 δ1 + ρ2 δ2 )
!2
kv2 a˙ ˙ δ2 + δ2 = 4πG(ρ1 δ1 + ρ2 δ2 ) δ¨2 + 2 a a � �2 8πG a˙ (ρ1 + ρ2 ). = a 3 � �
(69)
If either k = 2πa/λ = 0, or v1 = v2 = 0 then equations (69) have the solutions [554] 2
δ1 = B1 t 3 + B2 t−1 + B3 + B4 t−1/3 2 δ2 = B1 t 3 + B2 t−1 + B5 + B6 t−1/3 0 = Ω1 B3 + Ω2 B5 = Ω1 B4 + Ω2 B6 .
(70)
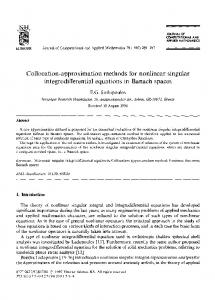
It is interesting that, of the four linearly independent components in equation (70), only one corresponds to a growing mode. An important subclass of equations (69) & (70) arises if ρ1 δ1 >> ρ2 δ2 . This condition is satisfied in most cosmological models since the perturbation in the dark matter component immediately after recombination is much larger than the corresponding baryonic perturbation (ρ1 δ1 ≃ 10ρ2 δ2 ), consequently we can ignore the presence of ρ2 δ2 terms in the right hand side of eqs. (69) which leads to: δ1 ∝ a(t), δ2 ∝ δ1 (1 − const/a), indicating that perturbations in baryons rapidly fall into potential wells created by dark matter, with the result that the growth rate of both types of perturbations converges at late times. The behavior of perturbations in both baryonic and nonbaryonic matter after matter– radiation equality is illustrated in Figure (1). 20
Fig. 1. The growth of perturbations in baryons (solid line) and non-baryonic dark matter (dashed line – ‘x’) is plotted against the cosmological redshift parameter z for different values of Ωb and Ωx . Adapted, with permission, from [507].
For other physically interesting solutions to the system of equations (69), see [228,188,201,263,485,521,522]. For a general equation of state, solutions to these equations can be expressed in terms of the Meijer G–function and can therefore be studied by analysing the well documented properties of this function [29]. A relativistic generalisation of equations (69) can also be obtained[522,525,473]. Non–baryonic matter does not, in general, couple to photons, so that perturbations in it are not subject to collisional (Silk) damping. However depending upon the momentum of the non–baryonic particle, collisionless phase mixing caused primarily by the free streaming of relativistic particles as these travel from regions of high density into regions of low density (and vice versa) leads to a very effective mechanism whereby fluctuations on scales smaller than the free-streaming distance λf s are wiped out; λf s is the mean distance traversed by a relativistic particle species until its momentum becomes non-relativistic. The cosmological properties of non-baryonic matter depend mainly upon whether λf s is large or small. Particles for which the free-streaming distance λf s is large are said to constitute Hot Dark Matter (HDM) (to underscore the relativistic nature of the particle species). In the opposite case when λf s is too small to be cosmologically interesting, the particles are said to constitute Cold Dark Matter (CDM) [63]. 21
For both HDM and CDM the shape of the processed final spectrum of fluctuations differs from its primordial shape. In the case of HDM this arises because fluctuations on scales smaller than λf s are wiped out due to free streaming so that the processed final spectrum has a well–defined cutoff on scales smaller than λ ∼ λf s . For HDM models based on a light massive neutrino λf s ≃ 41(30 eV/mν ) Mpc, the associated mass scale for neutrinos of mass mν ≃ 30 eV is Mf s ∼ 1015 (Ωh2 )−2 M⊙ which is similar to the observed mass of a rich cluster of galaxies [63,507]. Consequently, the first objects to collapse in such a model have the mass of a cluster, smaller objects forming later by the fragmentation of primordial cluster-scale “pancakes”. This scenario is commonly called the “top-down” scenario for galaxy formation and was originally suggested by Zeldovich and co-workers in the 1970s in connection with baryonic models of galaxy formation [507]. If either the mass of the nonbaryonic particle is very large (as in the case of SUSY particles such as the photino and the gravitino), or if its momentum is very small due to it being formed out of thermal equilibrium (e.g. the axion), then the free streaming distance λf s is too small to be relevant and the processed spectrum has no cutoff on any cosmological scale. However, even in such cases, the final spectrum does show an appreciable departure from its primordial form P0 (k) on scales smaller than λeq (= 13/Ωh2 Mpc) (λeq is related to the comoving horizon scale at matter–radiation equality) approaching the asymptotic form P (k) ∝ P0 (k) × k −4 log2 k for k >> keq [525,462]. This bending of the CDM spectrum occurs on scales ∼ λeq and arises because small scale density fluctuations (having wavelength λ < λH < λeq ) which enter the horizon prior to matter–radiation equality have nothing to gravitate towards (the free-streaming of photons having effectively wiped out all fluctuations in the photon component on scales < λeq ). As a result their growth rate slows down considerably and approaches the asymptotic form δ ∝ 1 + 3a(t)/2aeq until matter dominance (a = aeq ) [393,462]. Perturbations on scales greater than the cosmological horizon (λH < λ < λeq ), however, continue to grow at the usual rate δ ∝ a2 , until they enter the horizon, resulting in a larger amplitude for longer wavelength perturbations and, consequently, a bend in the shape of P (k). Very large wavelength perturbations (λ > λeq ) are left virtually unscathed by the radiation dominated epoch, since they enter the horizon after matter–radiation equality. As a result the fluctuation spectrum preserves its primordial form on scales > λeq . The combined effect of the various processes involved in changing the shape of the original power spectrum can be summarised in a single quantity – the transfer function T (k) which relates the processed power spectrum P (k) to its primordial form P0 (k) via the transformation: P (k) = P0 (k) × T 2 (k). Inflationary models of the Universe generically predict P0 (k) ∝ k n , n = 1 being the scale invariant Harrison - Zeldovich spectrum [249,575]. The results of full numerical calculations of all the physical processes we have discussed can be
22
encoded in the transfer function of a particular model. The main examples are listed here. For Cold Dark Matter (Ak)2 T (k) = 1 + log(1 + Bk) "
#−1
,
(71)
√ √ where A = 3.08 κh−2 Mpc, B = 1.83 κh−2 Mpc, and κ = Ωrel /Ωγ is the ratio of the energy density in relativistic particles to that in photons. The value of κ = 1.68 corresponds to three neutrino flavours plus photons contributing to the total density in relativistic particles [473,525]. An alternative fitting– formula is: T (k) =
i− 1 log(1 + 2.34q) h 1 + 3.89q + (16.1q)2 + 5.46q)3 + (6.71q)4 4 , (2.34q)
(72)
1
where q = kθ 2 /(Ωh2 ) and θ = κ/1.68 [23]. In addition the following transfer function was given by Bond and Efstathiou [62] 1
3
T (k) = [1 + (ak + (bk) 2 + (ck)2 )ν ]− ν ,
(73)
where a = 6.4(Ωh2 )−1 Mpc, b = 3.0(Ωh2 )−1 Mpc, c = 1.7(Ωh2 )−1 Mpc, ν = 1.13. Approximations (71,72) correctly reproduce the small wavelength behaviour of the transfer function T (k) ∝ k −2 log k for k >> keq . A comparison of different transfer functions is given in [337]; see also [442,55,313,314,264]. For Hot Dark Matter we have 1.5
THDM ≃ 10−(k/kν ) ,
(74)
by solving the Boltzmann equation for the collisionless neutrinos. In eq. (74), λν = 2π/kν = 13(Ων h2 )−1 Mpc = 41 (mν /30 eV) Mpc is the damping length in neutrino fluctuations caused by free streaming. For a single flavour neutrino having mass mν and temperature Tν = 1.9◦ K, Ων h2 = 0.31(mν /30 eV.). Several alternative fits to the HDM transfer function are given in Appendix G of [23], including: THDM ≃ exp[−(3.9q + 2.1q 2 )], (75) where q = k/(Ων h2 Mpc−1 ).
An alternative scenario is furnished if the primordial density fluctuations are in the isocurvature mode, rather than adiabatic. Isocurvature initial conditions are perturbations to the equation of state, rather than true curvature perturbations: the total energy density is constant, but the relative contribution from each fluid component varies spatially; such perturbations do not arise generically (as do adiabatic initial conditions, which arise as fluctuations 23
in the inflaton field and are therefore predicted in most Inflationary Universe models) but can be generated via specific mechanisms such as by an axionic field in the early Universe and also in a certain category of Inflationary models [324]. The evolution of isocurvature perturbations before and after matter–radiation equality has been discussed in the framework of the two fluid CDM model. Starobinsky & Sahni [525,473] give the following form for the isocurvature transfer function: T (k) = (1 + Ak)−2 , (76) √ −2 where A = 4.36 κh Mpc. An alternative transfer function is given by Efstathiou & Bond [170] 3
1
T (k) = [1 + (ak + (bk) 2 + (ck)2 )ν ]− ν ,
(77)
where a = 15.6(Ωh2 )−1 Mpc, b = 0.9(Ωh2 )−1 Mpc, c = 5.8(Ωh2 )−1 Mpc, ν = 1.24. An essential feature of the isocurvature transfer function is the absence of the logarithmic growth factor that characterises the small scale behaviour of the adiabatic CDM spectrum, indicating that density perturbations on a range of scales (k >> keq ) grow to become non-linear virtually instantaneously. Somewhat surprisingly, however, isocurvature fluctuations generate larger anisotropies in the CMBR than adiabatic fluctuations, for two reasons. Firstly, initially isocurvature fluctuations generate significant fluctuations in the gravitational potential when they enter the horizon; this is due to the influence of pressure gradients. In addition, isocurvature fluctuations generate significant fluctuations in the radiation density after matter–domination, because the initial perturbation in the equation of state, which can be thought of as a perturbation in the entropy, is then transferred into the perturbation of the radiation. The upshot of all this is that the net anisotropy seen is a factor six larger for isocurvature fluctuations than for adiabatic ones, making such fluctuations uninteresting from a cosmological viewpoint [525,170], though they have been discussed in the literature [337,314,169].
2.6. Normalising the Power–Spectrum We have already mentioned that the power spectrum could in principle be normalised using the observed clustering properties of galaxies. In practice, such a normalisation runs into trouble because of the absence of a strict relationship between the clustering properties of dark and luminous matter. Recent observations of the large scale anisotropy of the CMBR by the COBE satellite remove this ambiguity by relating temperature fluctuations δT /T directly to the amplitude and shape of the underlying power spectrum on scales that are still evolving according to linear theory [518]. Furthermore, having normalised 24
the power spectrum in such a manner, we can proceed to determine such quantities as δM/M(r) which measure the clustering of dark matter and can therefore help predict the value of the biasing factor b = (δN/N)/(δM/M) for a given cosmological model. In our discussion of the CMBR anisotropy we shall focus mainly on scales greater than a few degrees, since the primordial anisotropy on such scales has been unambiguously measured. Observations on smaller scales have been used to constrain the shape of the power spectrum on these scales and also to provide limits on the gravity wave contribution [138,65,58,563]. The CMBR travels to us from the surface of last scattering whose comoving distance from us practically coincides with the horizon scale dH = 2H0−1 ≃ 6000h−1 Mpc. The 1/2 horizon at last scattering subtends an angle θ ≃ 1.8◦ Ω0 (1000/zrec )1/2 ≃ 1.8◦ for Ω0 ≃ 1 and zrec ≃ 1000. As a result the CMBR anisotropy on angular scales greater than a few degrees probes length scales that were causally unconnected at the time of recombination, thereby providing us with the cleanest possible probe of the primordial spectrum prior to its distortion by astrophysical processes. The dominant contribution to the CMBR anisotropy on large angular scales (> 1◦ ) arises because of the Sachs-Wolfe effect which relates temperature fluctuations in the CMBR to the integral over the variation of the metric evaluated along the line of sight [471] η0
δT 1 Z ∂hαβ α β =− e e dη, T 2η ∂η
(78)
rec
where eα is the tangent vector of the photon trajectory, η = dt/a is the conformal time coordinate (η0 corresponds to the present epoch) and ηrec to recombination; an analysis with three massless neutrino species and zrec = 1100 gives [404] η0 /ηrec = 49.6. In a flat, matter–dominated Universe, the gravitational potential does not evolve with time and the above expression simplifies to δT 1 δφ ≃ . (79) T 3 c2 In other words, the CMBR anisotropy is directly related to fluctuations in the gravitational potential on the surface of last scattering. R
Perturbations in the primordial gravitational potential (usually accompanied by gravitational waves) arise naturally in models of the Universe based on the inflationary scenario which usually predict a primordial fluctuation spectrum P0 (k) = Ak n . The scale invariant spectrum n = 1 is predicted by inflationary models with exponential expansion, models with power law inflation (PLI) in which the scale factor grows as a power law a(t) ∝ tp , p > 1 predict a lower spectral index: n = (p − 3)/(p − 1) < 1. 25
It is convenient to express the cosmic microwave temperature distribution as T (θ, φ) = T0
"
#
δT 1+ (θ, φ) , T
(80)
where T0 is the blackbody temperature T0 = 2.736 ± 0.010◦K [375,376]. We can rewrite δT /T as a multipole expansion on the celestial sphere: ∞ X δT (θ, φ) = T l=2
l X
alm Ylm (θ, φ),
(81)
m=−l
where θ, φ are spherical angular cordinates associated with a direction n ˆ in the sky, Ylm (θ, φ) are spherical harmonics. We have ignored the dipole contribution to δT which cannot be distinguished from our local velocity 8 with respect to the CMBR. The Sachs-Wolfe effect allows us to relate the multipoles alm to the primordial spectrum (S) Cl
2
≡ h|alm | i = 4π
2
�
H0 c
�4 Z∞ 0
dk P (k)jl2 (kx), k2
(82)
where x = 2c/H0 is the present day Horizon size and jl (kx) are spherical Bessel functions. For power law spectra P (k) = Ak n the integral in eq. (82) can be evaluated analytically, with the result (S) Cl
A H0 = 16 c �
�n+3
f (n, l);
Γ(3 − n) Γ[(2l + n − 1)/2] f (n, l) = h . i2 Γ[(2l + 5 − n)/2] Γ( 4−n ) 2
(83)
Of considerable importance is the temperature auto-correlation function defined by δT δT C(θ) = h (ˆ n1 ) (ˆ n2 )i, (84) T T where n ˆ1 · n ˆ 2 = cos θ. Substituting δT /T from eq. (81) and using the addition theorem for spherical harmonics we get C(θ) =
1 X (2l + 1)Cl Pl (cos θ). 4π l≥2
8
(85)
The dipole anisotropy is usually interpreted as being due to the motion of our local group of galaxies relative to the CMBR. For v/c Ω will correspond to an overdensity and Ω′ < Ω to an underdensity). The subsequent fate of the spherical density perturbation will depend crucially upon the value of Ω′ . For Ω′ > 1 the perturbation will behave just like a part of a closed FRW Universe and will therefore expand to a maximum radius, turn around at a time tta , and thereafter collapse to a point at tcoll ≃ 2tta . A spherical density perturbation with Ω′ < 1 on the other hand, will mimic an open Universe and never recollapse (if Ω′ < Ω then such an underdensity will correspond to a void). In an idealised cosmological scenario spherical overdensities might be thought of as progenitors of clusters of galaxies [286], whereas underdensities would correspond to voids. In order to treat the collapse of a spherical overdensity quantitatively let us consider a spherical shell of radius R with an initial overdensity δi and a constant mass M = 4πR3 ρ¯(1 + δi )/3, where ρ¯ is the density of the backround Universe. Conservation of energy guarantees 1 ˙2 R 2
−
GM = E = const. R
(91)
At early times the expansion of the shell is virtually indistinguishable from that of the rest of the Universe so that R˙ i = Hi Ri , Ri being the radius 28
of the shell and Hi is the Hubble parameter at an initial time t = ti . The kinetic energy of the shell is therefore Ki = 12 Hi2 Ri2 and its potential energy is Ui = −GM/Ri = −Ki Ωi (1 + δi ) where Ωi is the density parameter at ti : 3Hi2 Ωi /2 = 4πG¯ ρi . As a result we obtain E = Ki + Ui = Ki Ωi [Ω−1 i − (1 + δi )].
(92)
The requirement for collapse E < 0 leads to the condition 1 + δi > Ω−1 i . Substituting Ωi ≡ Ω(z) = Ω0 (1 + z)/(1 + Ω0 z), δi ≡ δ(z) we get δ(z) >
1 − Ω0 Ω0 (1 + z)
(93)
as a precondition for collapse to occur. Equation (93) indicates that in flat or closed cosmological models an infinitesimal initial density perturbation is sufficient to give rise to collapsed objects. In open models on the other hand δ(z) must exceed a critical positive value in order for collapse to occur. It is relatively straightforward to relate the maximum expansion radius reached by an overdensity at turnaround Rta to its “seed” values Ri , and δi (equivalently R(z) and δ(z)). Since the mass of a perturbation is conserved, and ˙ = 0 we get R| ta Ri GM =− Ki Ωi (1 + δi ). Rta Rta
(94)
1 + δ(z) 1 + δi Rta ≡ . = −1 0 Ri δi − (Ωi − 1) δ(z) − Ω1−Ω 0 (1+z)
(95)
E = Uta = − Equating (92) and (94) we get
The time evolution of a spherical mass shell is identical to that of a spatially open or closed FRW Universe. The resulting equations of motion may be obtained by integrating eq. (91) giving [440,579]: R = A(1 − cos θ) t = B(θ − sin θ)
(96)
R = A(cosh θ − 1) t = B(sinh θ − θ)
(97)
for the case E < 0, and
for the case E > 0. In eqs. (96) and (97) we have A3 = GMB 2 . The behaviour of the background Universe is described by similar equations. Setting θ = π in equation (96) we can express the constants A and B in terms of the turnaround radius Rta and the turnaround time tta : A = Rta /2, B = 29
tta /π. Next using eq. (95) and the relationships B 2 = A3 /GM, M = 4πR3 ρ/3 and 8πGρ = 3H 2 Ω, we can re-express A and B in terms of Ri and δi [440,422]: A= B=
�
Ri 2
�
1 + δi δi − (Ω−1 i − 1) 1 + δi
1/2
3/2 2HΩi [δi − (Ω−1 i − 1)]
.
(98)
In a spatially flat Universe, eq. (98) becomes A≃
Ri 3 −3/2 , B ≃ ti δi , 2δi 4
(99)
where we assume δi 3(Ω−1 i −1)/5 or, equivalently [579], 3 1 − Ω0 δ(z) > . (105) 5 Ω0 (1 + z) 30
Table 1 Linear theory and exact overdensities δ at various stages of the collapse in the spherical top–hat model. θ
δL
δ
θ→0
δL ∝ θ 2
δ ∝ θ2
0.341
0.466
2π 3
0.568
1.01
π
1.063
4.6
2π
1.686
∞
π 2
From eq. (102) we find δ(θ = π) ≃ 4.6 at the radius of maximum expansion (“turnaround”), and δ(2π) → ∞ at recollapse. The corresponding extrapolated linear density contrast can be found from equations (104), (96) & (99): � �2
3 3 δL (θ) ≃ 5 4
3
2
(θ − sin θ) 3 .
(106)
We thus obtain δL (π) ≃ 1.063 for the linear density contrast at turnaround, and δL (2π) ≃ 1.686 at recollapse. These, and other, values of δL are compared with the exact results δ in the Table. 9 Knowing the linear density contrast corresponding to a given perturbation, the redshift at which that perturbation “turned around” and “collapsed” can be found from δL 1.063 δL . ≃ 1.686
1 + zta ≃ 1 + zcoll
(107)
In reality δcoll → ∞ will never be achieved since exact spherical collapse is at best a rather crude approximation, which will break down as the overdensity begins to contract, dynamical relaxation and shocks both ensuring that the system reaches virial equilibrium at a finite density. The maximum density at recollapse can be estimated using the virial theorem and the fact that at R = Rta all the energy in the system is potential: U(R = Rvir ) = 2E = 2U(R = Rta ),
(108)
since U = −GM/R we get Rvir = Rta /2 and ρvir = 8ρta [437]. The mean density of an object at turnaround is ρta /¯ ρ = δta + 1 ≃ 5.6 so that ρta ≃ 5.6¯ ρta . We therefore get ρvir ≃ 8 × 5.6¯ ρta . Since ρ¯ = (6πGt2 )−1 and setting 9
It is interesting to note in this context that in a low Ω Universe a spherical density contrast can grow to fairly large values δ ≫ 1, without ever recollapsing [440].
31
tvir ≃ tcoll ≃ 2tta we finally get ρvir ≃ 8 × 5.6 × 4¯ ρvir or since ρ¯vir = (1 + z)3 ρ0 ρvir ≃ 179.2(1 + zvir )3 ρ0 ,
(109)
where zvir is the collapse redshift, and ρ0 the present matter density. Equation (109) permits us to relate the virialised density of a collapsed object to the epoch of its formation [579,440,422]: zvir ≃ 0.18(ρ/ρ0 )1/3 − 1. (Since the present overdensity in clusters is 102 ≤ ρ/ρ0 ≤ 104 , the above arguments might indicate that clusters formed relatively recently at redshifts z ≤ 3, provided they formed from spherical density enhancements.) Generalisations of these arguments show that the addition of a cosmological constant to the Einstein equations does not significantly affect the dynamics of a spherical overdensity [330,365]. The final (virial) radius of a spherical overdensity in this case turns out to be 1− Rvir ≃ Rta 2−
η 2 η 2
< 21 ,
(110)
where η = Λ/8πG¯ ρ(t = tta ) is the ratio of the cosmological constant to the background density at turnaround. Equation (110) indicates that the presence of a positive cosmological constant leads to a somewhat smaller final radius (and consequently higher density) of a collapsed object. This effect is clearly larger for objects that collapse later, when the turnaround density is lower. As a final remark in this context, we should mention that studies of the collapse of spherically–symmetric perturbations into the fully non–linear regime have been discussed in [218,234,192,41]. These investigations showed that spherical infall onto an initial overdensity was self-similar and resulted in a density profile ρ ∝ r −2.25 around the accreting object [192,41]. (Solutions with planar and cylindrical symmetry are discussed in [192].)
3.2. Anisotropic Collapse Although very convenient from the point of view of an approximate analysis, the spherical model is nevertheless an idealisation and does not describe the collapse of realistic astrophysical objects such as protogalaxies and protoclusters very accurately. The reason for this is that one does not expect a density perturbation to have started out being exactly spherical. It is well known that once an overdensity turns around all departures from spherical symmetry get amplified, a result sometimes called the Lin–Mestel–Shu instability [343]. As a result the generic shape of a collapsing obect at late times is likely to become spheroidal even though it might have been highly spher32
ical to begin with 10 . Studies of the motion of homogeneous spheroids have shown that collapse usually occus along a preferred direction which coincides with the smaller spheroidal axis, collapse to a point in this case occuring much faster than it would have for an equivalent spherical density enhancement [353,573,343,406,399]. An interesting new feature of anisotropic collapse is that the condition Ω′ > 1 essential for collapse in the spherical model is no longer necessary for spheroids, for which collapse along one axis can occur even if the ratio’s of the kinetic and potential energies marginally exceeds unity, implying Ω′ < 1 for the fluctuation [440]. These results have recently been both confirmed and extended in [261,262,572,543,47] where it is shown that (a) the presence of shear leads perturbations to collapse faster than they would have in the spherical model, and (b) shear can lead to the collapse of regions which are initially underdense. Some aspects of anisotropic collapse are also incorporated in the Zel’dovich approximation which will be discussed in the next chapter.
3.3. Peaks Theory A simple way to seek to extend linear theory into the non–linear regime is to imagine that the density field evolves linearly until high–density regions reach some critical ‘threshold’ value δ ∼ 1. Such regions then collapse in some manner assumed to be similar to the top–hat collapse of an isolated spherical inhomogeneity. This amounts to the assumption that the transition from linear to non–linear evolution is ‘fast’ and that peaks of the linear density field are the sites for non–linear structure formation. If this is true then we should be able to understand the clustering of non–linear objects by looking at the clustering of appropriate sites in the linear density field. An immediate problem in implementing this prescription is posed by the need to smooth the density field to select appropriate peaks. For power–spectra of the kind discussed in §2.4, the density field has structure on all scales. This means that δ actually has an infinite number of small scale peaks. When we are looking at the properties of what we assume to be protogalaxies, we do not want to take account of very high frequency modes which correspond to structure on scales much smaller than galaxies. The way to achieve this is to smooth the density field with some kind of low–pass filter in the manner described in §2.4. Implicit in this procedure is the assumption that high frequency modes of the system do not affect the evolution of low frequency modes, which therefore continue to evolve linearly; some attempt to justify this is made in [440]. As we shall see in §4, even with smoothing, this turns out not to be a particularly good way of looking at the formation of large–scale structure in most of the 10
The reverse is true for underdense regions which become progressively more spherical as they expand [267,268]; see §5.
33
favoured models, because non–linear structure formation does not in general occur near peaks of the linear density field. Dynamical effects are important even on large scales, and it appears that peaks in the final density field are displaced significantly with respect to peaks in the initial conditions[297]. Nevertheless, this general approach has led to useful results and has spawned a huge literature on the statistics of primordial density maxima, so it is worth reviewing in some detail here. To proceed with this approach we need to construct a formalism to describe the statistical properties of the linear density field. In the usual models, primordial density fluctuations are a Gaussian random field (see §2.4). Recall that for such a field, all the statistical information required to specify its properties is contained in the autocovariance function ξ(r) = hδ(~x)δ(~x + ~r)i~x , where ξ(0) = σ 2 , the variance of δ, and the subscript means that the average is taken over all spatial configurations, assuming that δ(~x) is spatially ergodic, which is actually true under very weak conditions for Gaussian fields [6]. The first attempt to investigate the properties of linear density peaks was made by Doroshkevich in 1970 [161], who presented his results mainly in the framework of the baryonic pancake model of galaxy formation 11 . More recently, this formalism was extended to hierarchical models of structure formation, following the lead of Kaiser [286]. Kaiser considered peaks to be defined as regions where the density field δ(~x) exceeds some threshold value δc ; such regions are often called excursion regions and the set comprising all excursion regions is called the excursion set. We shall later discuss the possibility that local maxima might be used rather than excursion regions to indicate the positions of proto–objects. With the spherical top-hat model in mind, it perhaps makes sense to take δc = 1.68, which is the (extrapolated) linear density field at recollapse in the spherical collapse model. 12 It is straightforward to calculate the correlation function of points exceeding δc using the Gaussian prescription because the probability of finding two regions separated by a distance r both above the threshold will be just
Q2 =
Z∞ Z∞
P2 (δ1 , δ2 ) dδ1 dδ2 .
(111)
δc δc
Now the N–variate joint distribution of a set of δi can be written as a multi-
11
Doroshkevich calculated a number of statistical quantities of great importance including: the number density of peaks of a Gaussian random field in the high peak limit; the shape of contours surrounding maxima; the average value of the Euler characteristic defining the topology of contour surfaces of a given density. 12 Numerical simulations indicate a somewhat smaller value of δc : δc ∼ 1.33 − 1.44 [99,178].
34
variate Gaussian distribution: PN (δ1 , ..δN ) =
� � ||M||1/2 1~T ~ , exp − V M V 2 (2π)N/2
(112)
~ is a column where M is the inverse of the correlation matrix C = hδi δj i and V vector made from the δi . The ability to construct, not only the n–dimensional joint distribution of values of δ, but also joint distributions of derivatives of arbitrary order which are all of the form (112), is what makes Gaussian random fields so useful from an analytical point of view; see [6]. The expression (112) is considerably simplified by the fact that hδi i = 0 for all i. Using the substitution δi = νi σ and w(r) = ξ(r)/σ 2 yields ν 2 + ν22 − 2w(r)ν1ν2 1 1 q . exp − 1 P2 (ν1 , ν2 ) = 2π 1 − w 2 (r) 2[1 − w 2 (r)] (
)
(113)
The two–point correlation function for points exceeding νc = δc /σ is then 1 + ξνc =
Q2 , Q21
(114)
where Q1 = Pr(ν > νc ). The exact calculation of the integrals in this equation is difficult but various approximate relations have been obtained. For large νc and small w we have [286] (115) ξνc ≃ νc2 w(r), while another expression which is valid when w is not necessarily small is [459] ξνc ≃ exp[νc2 w(r)] − 1.
(116)
More accurate expansions are given in [276]; higher–order correlations in this model can be expressed in the Kirkwood scaling form, see §8.3. Kaiser [286] initially introduced this model to explain the enhanced correlations of Abell clusters compared to those of galaxies. Here the field δ is initially smoothed with a filter of radius several Mpc to pick out structure on the appropriate scale. If galaxies trace the mass, and so have ξgg (r) ≃ ξ(r) then the simple relation (115) explains qualitatively why cluster correlations might have the same slope, but a higher amplitude than the galaxy correlations. This enhancement is natural because rich clusters are defined as structures within which the density of matter exceeds the average density by some fairly well–defined factor in very much the way assumed in this calculation. This simple argument spawned more detailed analyses of the statistics of Gaussian random fields [23,109,119,134,135,124,350,432]. The interest in most of these studies was the idea that galaxies themselves might form only at peaks of the linear density field (this time smoothed with a smaller filtering radius). If galaxies only form from large upward fluctuations in the linear density field 35
then they too should display enhanced correlations with respect to the matter. This seemed to be the kind of bias required to reconcile the standard CDM model with observations of galaxy peculiar motions [148]. One should say, however, that there is no reason a priori to believe that galaxy formation should be restricted to peaks of particularly high initial density. It is true that peaks collapsing later might produce objects with a lower final density than peaks collapsing earlier, but these could (and perhaps should) still correspond to galaxies. Some astrophysical mechanism must be introduced which will inhibit galaxy formation in the lower peaks. Many mechanisms have been suggested, but none of these are particularly compelling. Indeed, the COBE CMB fluctuations have recently given cause to doubt the validity of this kind of biasing as a means for reconciling CDM with observations. Notwithstanding these reservations about the validity of peaks theory, the idea has led to some interesting analyses of the properties of Gaussian random fields and the possible effects of biasing. One particular line of enquiry has been to look at local maxima of the density field, rather than just points where δ exceeds some particular value δc . The trouble with the original calculation by Kaiser [286] is that it applies no constraint that the two field values δ1 and δ2 are in different proto–objects. The smoothing required to select objects of the correct characteristic scale introduces fairly large scale coherence into the density field. This means that regions where δ exceeds some value may be quite large compared with the mean spacing of clusters. Since each disjoint region above the threshold is implicitly assumed to form one cluster, the simple calculation given above will lead to an overcounting of pairs of objects separated by distances less than the typical size of excursion regions [117]. This suggests that a more accurate representation of reality might be obtained by looking at local maxima of the field. If the criterion for proto–object sites is that δ be a local maximum, it is impossible that two distinct spatial positions satisfying this criterion can both belong to the same proto–object. Dealing with local maxima complicates the calculations considerably, but some progress is possible. For illustrative purposes, we discuss here the argument for fluctuation fields defined in one spatial dimension. The difficulties with three dimensions will quickly become obvious! To handle local maxima, we need to consider not just the value of δ at a given spatial location, but also the first and second derivatives of δ. Smoothing is also required here, otherwise the field δ would not be differentiable (in the mean– square sense: [6]) and local maxima would be consequently undefined. We need first need to consider P (δ, δ ′ , δ ′′ ), where the primes denote derivatives with respect to the spatial coordinate (which we denote x). This joint probability is also a multivariate normal distribution (112), but the column vector is
36
written V~ = (δ, δ ′ , δ ′′ ) and the covariance matrix C has the form
2 σ
C = 0 σ12
0 −σ12 0
−σ12 0 σ22
.
(117)
The σi2 are moments of the power–spectrum of the density fluctuations in one dimension: Z σj2 = P1 (k)k 2j dk, (118)
where P1 (k) is the one–dimensional Fourier transform of ξ(r) [119,350]. In this notation the variance of δ is just σ 2 = σ02 . To select stationary points we need to specify δ ′ = 0. Since such points form a set of measure zero, the appropriate probability would seem to be identically zero. This problem ~ = dδ dδ ′ dδ ′′ by dδ dδ ′′ |δ ′′ | dx: can be avoided by replacing the ‘volume’ dV assuming that δ is spatially ergodic then means that the integral over x can be taken to be an integral over the probability distribution and one avoids the measure problem. It helps to define, in addition to ν (which is as above), the parameters γ = σ12 /σσ2 (which is a measure of the bandwidth of the spectrum P1 ), and R∗ = σ1 /σ2 , a measure of the characteristic coherence length of the field. Defining θ = −δ ′′ /σ2 gives the number–density of stationary points as: "
|θ| dθ dν 1 dN0 = exp − (2π)3/2 (1 − γ 2 )1/2 R∗ 2
(ν − γθ)2 + θ2 1 − γ2
!#
.
(119)
To further specify local maxima, we require θ > 0: Npk = 0∞ dN0 is then the number of local maxima per unit length. By integrating over ν first, and then over θ we find that Npk = 1/2πR∗. To find the number–density of local maxima as a function of their (dimensionless) height ν we need to integrate over θ. The result was found analytically in a classic paper by Cartwright and Longuet–Higgins [100] who give the probability: R
1 ν γν 2 + γe−ν /2 1 + erf q . Pmax (> ν) = erfc q 2 2(1 − γ 2 ) 2(1 − γ 2 )
(120) Notice that in the limit γ → 0 the distribution of heights at maxima is just a Gaussian. This is the limit of infinitely broad spectrum (i.e. no filtering) and it simply tells us that, without the low–pass filter, every point is a local maximum! The limit for a δ–function spectrum γ → 1 is a Rayleigh distribution. The fact that a narrow spectrum produces peaks which have ν > 0 is not surprising: a monochromatic plane wave has all its local maxima at ν > 0. It is conceptually straightforward to extend these results to three spatial dimensions, but it is technically difficult. The reason for the complexity is 37
that, in three dimensions, the local maximum constraint requires the three spatial derivatives of δ(~x) to be zero, and that the matrix of second derivatives ∂ 2 δ/∂xi ∂xj be negative definite (having three negative eigenvalues). One therefore needs a 10–dimensional probability density function for δ, its three first derivatives, and the six independent second derivatives. One then has to integrate over the region where the second derivative matrix is negative definite [6]. We shall not go into details here; the differential number–density of local maxima has been obtained by [23] as the function dNpk 1 2 e−ν /2 G(γ, γν), = 2 3 dν (2π) R∗ where R∗ =
√
(121)
3σ1 /σ2 ,
G(γ, y) =
Z∞ 0
(x − y)2 f (x) exp − [2π(1 − γ 2 )]1/2 2(1 − γ 2 )
!
dx.
(122)
The function f (x) is given by [23] 3
f (x) =
x
! − 3x
2
s
2 + 5π
"
s 5 x 5 + erf 2 2 2
s
erf x
31x2 8 −5x2 /8 x2 8 −5x2 /2 . e + e + − 4 5 2 5 !
!
#
(123)
In one dimension, the corresponding result has the same form as eq. (122), 2 but with f (x) = x; in two dimensions the result has f (x) = x2 + e−x −1 [430]. The number of local maxima per unit volume turns out to be Npk ≃ 0.016R∗−3 . For high peaks � � γ 3 2 −ν 2 /2 1 ν e . (124) Npk (> ν) = 2 4π R∗ As shown in [23] the number density of high peaks in the limit γν ≫ 1 is related to the density Nχ of the Euler characteristic of the surfaces bounding the peaks by Npk (> ν) = 21 Nχ (> ν). 13 To calculate the two–point correlation function of local maxima is more complicated still. In three dimensions one needs to construct the 20–dimensional distribution of δ and its first two spatial derivatives at two distinct spatial locations, and then integrate imposing the peak constraint at each spatial location. No exact analytic results are known for this calculation. In one dimension (which we hope will give a good qualitative guide to the behaviour of three–dimensional peaks), the problem boils down to the construction and integration over a six–dimensional probability distribution [119,350]. Even here, 13
The relationship between the Euler characteristic χ and the genus used in §8.8 is genus = 1 − χ/2.
38
analytical results are difficult to obtain and one must resort to some numerical integration. At very large separations, however, the peak–peak correlation function has a similar form to (116), but with ν defined in a different way [350]. It is not possible, even in one spatial dimension, to express the peak– peak correlation function as a simple function of the underlying correlation function of the density fluctuations. This is because the peak–peak correlation function depends, not just on ξ(r) but also upon its derivatives with respect to r. For example, notice that the Politzer–Wise formula, equation (116), gives a biased correlation function which is zero whenever the underlying w(r) is zero which is not necessarily the case when one considers local maxima [119,350]. Higher–order correlations of peaks in one–dimensional fields are discussed in [124]. The problem with this entire approach is that it assumes that non–linear evolution does not move proto–objects away from the positions of local density maxima in the linear field. This is unlikely to be the case, except for very large separations (where the displacement of matter from its linear position might be small compared to the peak separation), or if the primordial spectrum has very little large–scale power. A comparison between the ‘peaks’ of the density field evolved using a full numerical simulation, with the peaks in the linear density field shows very little correspondence between the two [128,297]. It seems therefore that linear density maxima are probably not, in themselves, very good candidates for the positions of galaxy formation; the situation may be more favourable for cluster–scale peaks. A closely related issue concerning the peaks picture of galaxy formation is the influence of shear (both internal – due to asphericity, and external – due to the surrounding matter distribution) on the evolution of density peaks. Recent studies conducted on galaxy scale peaks in a Gaussian random field show that shear can occasionally break up a single density peak into two or more halos [543,572,66,67,68,69]. It can also, by boosting the accretion of matter, occasionally promote the growth of smaller scale peaks into larger ones. Such studies demonstrate that the conventional peaks scenario in which halo’s of a characteristic scale and peaks in a Gaussian random field (filtered on the same scale) are held in one-to-one correspondence, is somewhat simplistic and needs to be considerably modified before it is taken seriously. 14 Some attempts have been made to include dynamics in this kind of analysis, although it is very difficult to do so convincingly [23]. An impressive attempt at this was made by Bond & Couchman [60], who used the Zel’dovich approximation (see later) to move linear density peaks away from their initial positions; see also [362]. The correlation function of the evolved peaks can then be expressed in terms of the initial correlations of the linear density peaks, modified by corrections for 14
Tidal effects are less important for high peaks which can be treated as rare events. As demonstrated in [35] the non–linear evolution of a high density peak follows spherical collapse if the spectral index n < −1.
39
the displacement caused by non–linear evolution. Although this calculation leads to an exact solution for ξ, it is not entirely satisfactory because linear density peaks are not necesarily in one–to–one correspondence with peaks in the evolved field (some may disrupt, others may merge). Because clustering evolves dynamically, the final density peaks are formed by the action of particle displacements generated by the gravitational potential, which is not a simple local function of the density field. A better procedure would therefore be to look for peaks in the final density field, as is done in [297,75]. In a bold extension of the peak formalism, Bond and Myers [66,67,68,69] have developed the so–called “peak–patch” picture for identifying and tracing the dynamical evolution of protostructure. In this picture, an entire hierarchy of peaks on different scales is identified using different values of the filter radius. An ellipsoidal collapse model is then used to follow the evolution within each patch, including the influence on its evolution of the external tidal field around it. By following peak patches on different scales simultaneously, one can allow for patches that overlap in the evolved system. The Zel’dovich approximation (§4.2) is then used to move the peak patches thus identified to their final Eulerian position. Both the statistical and dynamic contributions to the final correlation function are therefore included in this treatment. The use of a “catalogue” of peaks as a function of smoothing radius allows one to counteract the obvious limitation of the standard peaks theory we have concentrated on so far, namely that it assumes all peaks result from the application of a single smoothing radius. The procedure is, however, technically complex and it is not yet clear how useful will be the results it generates. We shall also make some comments on the peak–patch picture at the end of §3.4.
3.4. The Press–Schechter Approach One of the problems involved in trying to identify structure in density fields is that the power spectrum of the density field may not possess a physical cutoff on small scales. In other words, the filtered variance σ(R) (61) diverges as the filtering scale is reduced. Such fields always contain structure on a small enough scales which is non–linear. One expects structure thus to develop hierarchically, with large structures forming by the merger of small–scale lumps. This seems far too complicated a process to be dealt with in any variant of linear theory, but there is a method, developed by Press & Schechter [461] which attempts to explain some aspects of hierarchical clustering in terms of properties of the linear density field. We shall discuss this method in some detail here, because of its widespread use, and surprising effectiveness! We shall henceforward refer to this method as the PS method. The PS formalism rests on one critical assumption: that, even if the density 40
field is non–linear on some scale, the amplitude of long–wave modes in the density field is close to that predicted by linear theory. This effectively means that there must be enough large–scale power in the density field that it is not swamped by power generated by non–linear interaction of small–scale modes. Consider a massive clump. As described in §3.1, the clump will undergo collapse (assuming it is roughly spherical), if its overdensity exceeds some critical value δc which is of order unity. This suggests that one can identify the positions of clumps which will be bound by smoothing the linear density field on some scale Rf . On average, a mass M ∼ ρ0 Rf3 will be contained within a filtering radius, so it is reasonable to assume that points where δ smoothed on this scale exceeds δc will be bound objects with a mass M. Nothing in this approach determines the form of the filter function: it is conventional to use a Gaussian for no other reason than analytical convenience. Now, assuming a Gaussian distribution for δ, the probability that a randomly– selected point exceeds the threshold δc when smoothed on a scale Rf is just "
1 δc √ Pr(δ > δc |Rf ) = Pδ = 1 − erf 2 σf 2
!#
,
(125)
where σf2 is the variance of the smoothed field (61). We now follow the PS argument. This probability, (125), is assumed to be proportional to the probability that a given point has ever been contained in a collapsed object on a scale > Rf . It is not obvious that this assertion is correct: it amounts to assuming that the only objects that exist at a given epoch are those which have just collapsed. If an object has δ > δc when smoothed on some scale R, it will have δ = δc after R is increased, and will therefore be counted as part of a higher level in the hierarchy [430]. One problem with this assumption is immediately obvious, however: matter in underdense regions is not correctly dealt with. As a result, half the mass remains unaccounted for. PS ‘solved’ this problem by simply multiplying the probability by a factor of two and attributing the additional mass to accretion. This has, however, long been recognised as a fiddle. For the moment, we shall leave this problem to one side and continue with the PS analysis. Let us define the mass function of bound objects, f (M), such that f (M) dM is the comoving number density of objects with masses in the range (M, M + dM). This function is related to the probability Pδ in equation (125) by Mf (M) = ρ0 | dPδ / dM|,
(126)
where ρ0 is the usual mean density of cosmic material. Hence, δc ρ0 M 2 f (M) = σf
s
� � 2 exp −δc2 /2σ 2 | d log σf / d log M|. π
41
(127)
It is useful to define a multiplicity function, q(m), to be the fraction of mass contained in objects with mass in unit range of log M: this is just q(M) = M 2 f (M)/ρ0 . This function has a simple form if the power–spectrum of the linear field has a power–law shape (P (k) ∝ k n ): (n + 3) q(M) = 6
s
2 ν2 , ν exp − π 2 !
(128)
where ν = δc /σf . This calculation of the mass and multiplicity functions of objects forming hierchically, using only the properties of the linear density field, contains a number of assumptions which are difficult to justify. Even if one accepts the basic assumption, that there is a reasonable correspondence between the sites where virialised structures form and regions of high density in the linear density field, there is still the problem of the factor of 2 ‘fudge’ in the PS analysis. One would be inclined to consign the entire theory to the dustbin were it not for the remarkable fact that the final result, equation (128) is in remarkably good accord with the results from N–body simulations [176,178]. This method has consequently been used in a wide variety of different contexts to estimate f (M) for cosmological objects [498,99,113,114,176,178,499,82]. The unreasonable effectiveness of the PS formalism has spurred others to look at the problem from different points of view to see why it works so well. Although the issue is not fully resolved as yet, substantial progress has been made using some of the techniques outlined in §3.3. Since one might reasonably identify proto–objects with peaks of the linear density field, adaptation of the peaks formalism to the calculation of the mass function would seem to be a fruitful line of enquiry [8,23,64,12,59,433]. The most important outcome of these analyses has been a clarification of the ‘cloud–in–cloud’ problem. This is simply that the PS analysis does not check that objects which are considered to be ‘bound’ on a scale M are not subsumed into objects on a larger scale as the hierarchy evolves. In fact, the Press–Schechter formalism does not really deal with localised objects at all: it is simply a scheme for labelling points in the linear density field. It turns out that the failure to deal correctly with substructure is at the root of the infamous factor two. Recall the one–dimensional analysis of local maxima we referred to in the previous section. Here one looks to find locations where the trajectory of δ(x) as a function of x exceeds some value νσ, or is a local maximum at some point x. For the mass function analysis, it helps to consider the field δ, not as a function of spatial position but as a function of smoothing radius R (dropping the suffix f for brevity) at some fixed spatial location. Clearly δ(R) → 0 as R → ∞. As R decreases, δ(R) will develop fluctuations whose amplitude continues to increase as R gets smaller. If δ(R) < δc for some value R1 , it may well exceed δc again for some smaller value of R. (Indeed, if the small–scale 42
power spectrum diverges, this will happen with probability one.) Clearly as one proceeds to filter the density field on a range of decreasing scales R1 , ..., Rn the corresponding density contrast at a given location δ(x) executes a random walk through the points (δ1 , ..., δn ). The first upcrossing of the level δc will occur for the largest value of Ri for which δi ≥ δc . Here the analysis depends on the form of spatial filter one uses. Consider the illustrative example of a sharp filter in k–space, and consider what happens in the Fourier domain as R is decreased from infinity. Decreasing R corresponds to adding k–space shells which, for Gaussian fluctuations, are independent of each other. As a result the steps in the random walk of δ(R) become independent for a sharp k-space filter and the solution follows very easily 15 [433,59,430]. Consider a point on the trajectory which is just sitting at the threshold. The subsequent motion will be symmetric so that it is equally likely to be above or below δc at any smaller value of R. The probability that the trajectory does not cross the threshold – the survival probability, Ps – is then given by dPs δ2 1 exp − 2 = √ dδ 2σ σ 2π "
!
(δ − 2δc )2 − exp − 2σ 2
!#
.
(129)
One can integrate this expression to give the probability of having crossed the threshold at least once to be P≥1 = 1 − Ps = 1 − erf
δc √
σ 2
!
,
(130)
which is simply twice the unconditional probability of lying above the threshold, given by eq. (125). This therefore supplies exactly the missing factor of 2. Unfortunately, however, this does not provide a full solution of the problem because different filter functions behave differently to this simple example. What happens generically, is that the PS form, equation (127) is recovered for large M but the shape of the function is changed at low M to account for the factor two in the total probability. Our problem to figure out why the PS analysis works is, therefore, reduced to the problem of knowing why to use a particular form for the filter function. At present, we cannot say why the sharp k–space filter best represents the process of hierarchical clustering other than that that it is the choice that produces the PS result which is obeyed empirically. It may also be that the agreement between PS and numerical simulations is essentially fortuitous. One reason for believing that this may be the case is that, although the mass function of objects may agree with the PS result, the spatial locations of bound structures in simulations are very poorly correlated with peaks in the linear density field [128,297]. Although this does 15
In the continuum limit the random walk is described by a diffusion equation which can be solved analytically [59].
43
not in itself rule out the PS analysis – the mass function does not specify the locations of the final, virialised structures – it certainly suggests that one should not take the derivation too literally. It also suggests that attempts to calculate the spatial correlations of virialised objects of different masses by mixing the PS formalism with the correlations of peaks in the linear density field, e.g. [293], are likely to be of little relevance to the real world. On the other hand, in §4.5 we show how to estimate the mass function of collapsed objects using adhesion theory, which at least attempts to treat dynamical evolution in a reasonable way, and the results do agree with the PS formalism reasonably well, so a method may well be available for this kind of analysis. Various alternative approaches have been explored [326,302,303,300,111], but probably the most promising is the peak–patch picture [66,67,68,69] which appears to have the most detailed treatment of the dynamics of collapse and implicitly takes into account the hierarchical nature of the evolution. 16
3.5. The Lognormal Model In §3.3 and §3.4, we dealt with attempts to identify non–linear structures with structures in the initial linear density field. As long as matter does not move too far away from its primordial location as a result of non–linear evolution, these methods might be fairly accurate. In the next sections, we shall discuss ways of approximating the full dynamical evolution of structure and thus improving upon simple extrapolations of linear theory. Before we move onto dynamical approximations, however, it is worth discussing another way of extrapolating linear theory which, although simple, seems to describe some aspects of the clustering phenomenon reasonably well. If the initial density fluctuations are Gaussian (§2.4), then the form of the statistical distribution function for δ keeps the same form – eq. (63) – as the fluctuations evolve in the linear regime. To apply peaks theory and the Press– Schechter approach one implicitly assumes that this distribution function is still appropriate for the fluctuations when they are about to collapse. But collapse occurs, in the simplest picture at any rate, when δ is at least of order unity. At the onset of structure formation at a given scale, we must have an rms density contrast on that scale of order unity. But the Gaussian distribution with σ 2 ∼ 1 assigns a sizeable probability to regions with δ < −1 which are clearly unphysical (ρ < 0). The assumption of Gaussian statistics in the linear regime is therefore physically unreasonable. These thoughts suggest that one might achieve some measure of improvement over linear theory by adopting a distribution function for δ which does not 16
An interesting formal connection between the Press-Schechter formalism and that of Cayley trees has been explored in [105].
44
allow δ < −1. In the spirit of the other approximations in this section, it is reasonable to achieve this by a simple mapping of the initial linear field δLIN 7→ δN L such that the mapping is one–to–one but enforces the physical requirement that there should not be regions with negative total density. Of course, this ansatz does not include dynamics in a physically reasonable way, but one might expect it be some kind of improvement on linear theory. There are various ways to impose the mapping [123], but the simplest and probably most useful is with an exponential function: ρ ≡ 1 + δN L ∝ exp(δLIN ). ρ¯
(131)
We have implicitly assumed that the linear field is smoothed on some scale, say R, which we have not specified. Obviously, the mapping (131) does not commute with smoothing of δ so the actual mass distribution would not have the same statistical form when smoothed on different scales. The resulting distribution function is called a lognormal distribution and its properties are discussed extensively in [127]. The constant of proportionality in eq. (131) must be fixed by requiring that the mean value of δN L be zero; it will therefore depend upon the statistics of δLIN , i.e. upon the linear theory variance σL2 . Of course, the variance of the non-linear δN L will not be the same as the linearly–extrapolated field δLIN . In fact, �
�
2 − 1, σ 2 = exp σLIN
(132)
where σ 2 is now the variance of the non–linear field. The probability distribution function of δ (dropping the suffix NL) becomes −1
(1 + δ) P (δ) = q exp − 2 2π log(1 + σ )
i h √ log2 (1 + δ) 1 + σ 2
2 log(1 + σ 2 )
.
(133)
[127,102]. The great advantage of this distribution is that one can calculate analytically any property which can be calculated for the Gaussian distribution, using the simple local mapping, eq. (131). The two–point correlation function is given by ξ(r) = exp [ξL (r)] − 1, (134) where ξL is the linear theory correlation function. Notice the similarity between this equation and eq. (116). This similarity extends further: the higher–order correlation functions for this model obey the Kirkwood [307] scaling relationship, equation (299), exactly for all orders n. The lognormal field therefore has correlation functions which are exactly like those of the biased Gaussian density field computed by Politzer & Wise [459]. Other statistical properties of the P (ρ) described by equation (133) are discussed in [7,123,118,119,127,102]. It is worth mentioning just one of these properties here: the lognormal is an example of a probability distribution that is not completely specified by its 45
moments. In other words, knowledge of all the moments of the distribution of all orders n is not sufficient to specify the P (ρ) completely. This is related to the fact that the series expansion of the moment generating function for this distribution does not converge [140,127,536]. This apparently bizarre property is basically due to the extremely long tail at large positive values in the lognormal distribution. It serves as a warning that many of the statistical tools one uses in the study of galaxy clustering rely on assumptions that may not actually be realised in practice. We should point out here that the lognormal distribution, equation (133), is a model for the continuous density field and cannot be directly compared with galaxy counts, or even particle counts in an N–body simulation. There is no unique way to obtain a discrete distribution from a continuous one; the standard procedure in cosmology is to assume that objects are a random (Poisson) sample of the underlying density field with a mean rate proportional to the local matter density. In other words the probability of a small volume dV containing a galaxy is just dP ∝ ρ dV. One can then construct the probability that a volume V contains N galaxies as P (N) =
Z∞
P (¯ ρ)P (N|¯ ρ) d¯ ρ,
(135)
0
R
where V ρ¯ = V ρ dV, so that ρ¯ is the density smoothed over the cell volume. If the distribution is lognormal when smoothed on the scale V , then P (ρ) is given by eq. (133), and P (Nρ) is just a Poisson distribution. The resulting compound distribution is called the Poisson–lognormal distribution. Unfortunately, there is no simple closed–form expression for P (N) [127,140]. This distribution function seems to match the observed distribution function of galaxies reasonably well [515]. An alternative, less transparent, route to the ‘discretised’ form of the pdf for a Poisson–sampled field starts from the moment generating function [200,127]. Although the lognormal model density field must be thought of as mainly phenomenological, and was introduced into the cosmological literature for this reason, it is remarkable that numerical N–body experiments and other analytical considerations (§4) show that the distribution function of fluctuations in the non–linear regime is well–described by the form (133). The reason why this is the case has been the cause of much debate; various explanations are discussed in [37,317]. There is some qualitative motivation for the lognormal distribution in general terms because of the properties of non–linear processes. The central limit theorem states that the distribution of the sum of n independent random variables tends towards a Gaussian distribution for large n regardless of the form of the distribution function of the individual random variables. If instead we consider the product of n independent random variables, then it is clear that the logarithm of this product should have a normal 46
distribution by virtue of the central limit theorem. Lognormal distributions occur widely in non–linear physics, just as normal distributions do in linear physics. This argument does not give us any motivation for having taken a simple local extrapolation of the density field like equation (131); a more specific argument is needed. Coles & Jones (1991) took the continuity equation (18) as the starting point for a simple argument. If we change variables, using a dτ = dt and ̺ = ρa3 , this equation can be written in the form ∂̺ ~ + ̺(∇ ~ · ~v ) = 0. + (~v · ∇)̺ ∂τ
(136)
Introducing the total time derivative with respect to conformal time τ , we can then write 1 d̺ ~ · ~v ). = −(∇ (137) ̺ dτ ~ · ~v will be Gaussian, too. By inspecIf the velocity field ~v is Gaussian, then ∇ tion, the solution of eq. (137) will therefore be a lognormal distribution for ̺. This does not, however, prove that the real space distribution of ̺ should be accurately lognormal in the non–linear regime because (a) the velocity field will not evolve exactly linearly in this regime and (b) the total time derivative d/ dτ follows the fluid elements. At best, this argument can apply only in the very weakly non–linear regime. Further confirmation that this is not the correct explanation for the effectiveness of the lognormal distribution in the strongly non–linear regime is afforded by the comparison between full N–body evolution and the lognormal extrapolation via equation (131) of the same initial conditions. This exercise was part of an extended study by [128], which also looked at other approximations. The result shows that, although the distribution function of fluctuations in the final N–body simulations is fairly accurately described by a lognormal distribution, the variance of this distribution is not that obtained by the simple transformation of the linear variance via equation (132). This means that we need to look more deeply into the problem before coming up with any real justification for this model. We discuss more detailed dynamical justification for the lognormal approximation in §4.2; see also [37,317,133]. Some other non-Gaussian distributions are discussed in [400,557].
4. Non–linear Approximations based on Dynamics Although local extensions of linear theory do provide a qualitative first step in comparing theory with observations, a deeper insight into gravitational clustering is provided by the dynamical approximations we consider now. Depending upon the degree of nonlinear clustering (characterised by the rms density fluctuation σ), a particular dynamical approximation may be best suited for 47
describing gravitational clustering at that epoch. In the weakly non-linear regime when σ ≪ 1 (also known as the quasi-linear regime), Eulerian perturbation theory (§4.1) provides us with an excellent description of gravitational clustering and of the accompanying departures from Gaussianity which result if the initial density field was Gaussian. At later epochs (σ ≤ 1) the Zel’dovich approximation and its perturbative extensions (§4.2, §4.4) provide us with a quantitative understanding of gravitational dynamics until the formation of pancakes (σ ≃ 1). Several approximations have been suggested to model gravitational instability during the strongly non-linear regime when σ > 1 (§4.3, §4.5 – §4.7). Perhaps the most promising of these is the adhesion model (§4.5) which provides us with a deep understanding of gravitational clustering and describes the growth of cellular structure in the form of pancakes, filaments and clumps, as well as the dynamics of voids. A comparison of these different approximations is outlined in §4.7. We conclude this section with a brief discussion of approximations inspired by a relativistic approach to perturbations.
4.1. Higher–Order Eulerian Theory The linear regime of gravitational instability breaks down when δ becomes comparable to unity marking the commencement of the quasi-linear (or weakly non-linear) regime. During this regime the density contrast remains small (δ < 1), but the phases of the fourier components δk become substantially different from their initial values resulting in the gradual development of a non– Gaussian distribution function if the primordial density field was Gaussian [469,534,501,520]. The most obvious way to attempt to extend linear theory into the fully non–linear regime is via a higher–order perturbative expansion. In this approach [440,198,227,78,92,34,403,103] we write the density contrast as a superposition of terms: δ(~x, t) =
∞ X
δ (n) (~x, t)
n=1
=
∞ X
n D+ (t)∆(n) (~x).
(138)
i=1
For simplicity we shall assume the case of a flat universe which is matter– dominated. Perturbative methods for open universe models are discussed in [366,78]. The first term in the above series expansion corresponds to the linear growth law: δ (1) = D+ (t)∆(1) (~x). The second–order contribution can be written: X 10 ~ (1) · ∇φ ~ (1) + 4 δ (2) = (δ (1) )2 + ∇δ (∇i ∇j φ(1) )2 , (139) 14 14 i,j where ∇ denotes the derivative with respect to the Eulerian (comoving) co48
ordinate ~x and φ(1) is the linear gravitational potential. Higher–order terms become rapidly more complicated as n increases. For distributions which are initially Gaussian, the weakly non–linear regime witnesses the gradual emergence of non–Gaussian properties which can be described by the following hierarchical relationship for the connected moments of the density field, as explained in §8.3: hδ n ic ≃ Sn hδ 2 in−1 . (140) The subscript c refers to the connected part of the moment, i.e. that part which cannot be expressed in terms of lower–order moments of δ; see §8. The coefficent S3 describes the skewness and S4 the kurtosis, as mentioned in §8.5. For a Gaussian distribution, Sn = 0 for all n ≥ 3. The values of n can be calculated exactly by means of an elegant formalism introduced by Bernardeau [34]. In this approach one constructs vertex weights for the various tree diagrams, according to νn = hδ
(n)
ic =
R
hδ (n) (~x, a)δ (1) (~x1 , a) . . . δ (1) (~xn , a)ic d3~x d3~x1 . . . d3~xn R . (141) n ( hδ (1) (~x, a) δ (1) (~x′ , a)ic d3~x d3~x′ )
It is helpful to obtain the weights from the generating function: Gδ =
∞ X
νn n τ . i=1 n!
(142)
The Sn can then be straightforwardly obtained from the νn : S3 S4 S5 S6
= = = =
3ν2 4ν3 + 12ν22 5ν4 + 60ν3 ν2 + 60ν23 6ν5 + 120ν4 ν2 + 90ν32 + 720ν3 ν22 + 360ν24 .
(143)
Remarkably, the generating function G can be shown to evolve according the same equation as a spherical top-hat solution: Gδ =
ρ 9 (θ − sin θ)2 −1 = − 1, ρ¯ 2 (1 − cos θ)3 !
(144)
where the time–coordinate is reparameterised according to: 3 3 a (θ − sin θ) τ = δ0 = a0 5 4 �
�2/3
.
(145)
Expanding G as a power–series in τ leads to Gδ = τ + 0.810τ 2 + 0.601τ 3 + 0.426τ 4 + 0.293τ 5 + . . . ,
(146)
which leads to a straightforward determination of the νn and thence the Sn . The results for S3 are the same as those obtained by a more straightforward 49
analysis by [440]: we get S3 = 34/7 = 4.857, in this case. However, this result is only valid only if the density field is not smoothed. For smoothed final density fields the value of Sn depends both on the form of the window function and upon the slope of the power spectrum at values of k corresponding to the smoothing length. For scale invariant spectra P (k) ∝ k n with spherical top-hat smoothing S3 = 34/7 − (n + 3) [283,36]. For Gaussian smoothing the expression for S3 is more complicated [346]. (Redshift-space distortions to S3 and other moments are discussed in [258], see also [104].) We shall discuss these results later, in §4.7, where we compare the full perturbative solution for the hiearchical coefficients with the corresponding results obtained for various approximation schemes. (The function Gδ always obeys the equation for spherical collapse so all we need to do is to solve that problem in a given approximation and then calculate the Sn as above.) Skewness and kurtosis of velocity fields are discussed in [283,36,403], and also in §8.10. For small values of σ ≪ 1, the moments Sn can be used to reconstruct the probability density function (PDF) 17 in the quasi-linear regime using the Edgeworth expansion [304,37,284] S3 S32 2 S4 P (δ)dδ = H3 (ν) + σ H4 (ν) + H6 (ν) 1 exp (−ν /2) 1 + σ 6 24 72 (2πσ 2 ) 2 � � � 3 S5 S3 S4 S + σ3 H5 (ν) + H7 (ν) + 3 H9 (ν) + ... dδ, (147) 120 144 1296 1
2
�
�
�
where ν = δ/σ and Hn (ν) are the Hermite polynomials Hn (ν) ≡ (−1)n exp (ν 2 /2)
dn exp (−ν 2 /2). n dν
(148)
In general, the σ–dependence of Sn must be taken into account when applying equation (147) 18 The quantity in square brackets provides a correction to the initial Gaussian distribution. Since the Edgeworth form of the Gram–Charlier series is an asymptotic expansion in Sn , one needs to know all the moments in order to reconstruct the PDF. In practice however, the first two moments S3 and S4 , suffice to determine the maximum of the PDF to within a reasonable accuracy when σ ≤ 0.5 [37]. As a result, measurements of the shape of the PDF near its peak (which is a statistically robust quantity), may allow us to determine the 17
The PDF can be thought as the volume fraction occupied by a given value of the density. In the one dimensional case, until shell crossing [37] S3 (σ) = 6 + 24σ 2 + O(σ 4 ); S4 (σ) = 72 + 810σ 2 + O(σ 4 ); which converge to S3 = 6, S4 = 72 for infinitesimal values of σ. In three dimensions the functional forms for S3 (σ), S4 (σ) etc. are not known; results obtained using the Zel’dovich approximation are discussed in [37]. For nominal values of σ, good agreement with the PDF obtained from N-body simulations of the CDM model is provided by the lognormal model (see §3.5) for which [37] S3 (σ) = 3+σ 2 , S4 (σ) = 16+15σ 2 +6σ 4 +σ 6 . 18
50
lowest moments S3 and S4 in the weakly non-linear regime when σ ≪ 1. One should be aware, however, that there are restrictions on the possible behaviour of the moments in order that the Edgeworth expansion converges. Another useful way to employ perturbative techniques is by moving into the Fourier domain. One can then obtain higher–order corrections to such quantities as the power–spectrum. The approach we follow here is that of [274]; see also [198,213,359,203]. We begin by taking the Fourier transform of δ(~x, η) as in §2; η is the conformal time coordinate dη = dt/a(t): ˆ ~k, η) = δ(
1 (2π)3
Z
d3~x exp(−i~k · ~x)δ(~x, η).
(149)
In linear theory, the velocity field is curl–free and is therefore completely ~ · ~v . With this definition, equations (18) and specified by knowledge of θ = ∇ (16) can be Fourier transformed to yield: dδˆ ˆ +θ =− dη
Z
d3~k1
dθˆ a˙ ˆ 6 ˆ + θ + 2δ = − dη a η
Z
~k · ~k1 ˆ ~k1 , η)δ( ˆ ~k2 , η) d3~k2 δD (~k1 + ~k2 − ~k) 2 θ( k1
(150)
k2~k1 · ~k2 ˆ ~ ˆ ~k2 , η), θ(k1 , η)θ( 2k21 k22 (151) where δD is the Dirac delta function. Recall that the correct definition of the power–spectrum is then: Z
d3~k1
Z
d3~k2 δD (~k1 + ~k2 − ~k)
ˆ ~k1 , η)δ( ˆ ~k2 , η)i = P (k1 , η)δD (~k1 + ~k2 ). hδ(
(152)
We now proceed as we did in real space by expanding δˆ and θˆ as perturbation series: ∞ X ˆ ~k, η) = an (η)δˆn (~k), (153) δ( ˆ ~k, η) = θ(
n=1 ∞ X
n−1 a(η)a ˙ θn (~k).
(154)
n=1
The general solution to eqs. (150) and (151) can be written: δˆn (~k) = θˆn (~k) =
Z
d3~q1 . . .
Z
d3~q1 . . .
Z
d3~qn δD (~q1 + . . .~qn − ~k)Fn (~q1 . . .~qn )
Z
d3~qn δD (~q1 + . . .~qn − ~k)Gn (~q1 . . .~qn )
Y
δˆi (~qi )
i
Y
δˆi (~qi ). (155)
i
The functions Fn and Gn must be obtained from the recursion relations:
~k · ~k1 Gm (~q1 . . . ~qn ) (1 + 2n) 2 Fn−m (~qm+1 . . . ~qn ) Fn (~q1 . . . ~qn ) = k1 m=1 (2n + 3)(n − 1) n−1 X
51
k 2~k1 · ~k2 + 2 2 Gn−m (~qm+1 . . . ~qn ) k1 k2
Gm (~q1 . . . ~qm ) ~k · ~k1 Gn (~q1 . . . ~qn ) = 3 2 Fn−m (~qm+1 . . . ~qn ) k1 m=1 (2n + 3)(n − 1) n−1 X
k 2~k1 · ~k2 +n 2 2 Gn−m (~qm+1 . . . ~qn ) . k1 k2
(156)
where ~k1 ≡ ~q1 + . . . ~qm , ~k2 ≡ ~qm+1 + . . . ~qn , ~k = ~k1 + ~k2 and F1 = G1 = 1. An expansion of this type is also given by [213]. These expressions can be used to construct the higher–order power spectrum by calculating the required number of terms in the perturbation expansion for δˆ and calculating the required expectation values. For example, define hδˆm (~k)δˆn−m (~k ′ )i = Pm,n−m (k)δD (~k + ~k ′ )
(157)
and the power–spectrum to second order can be shown to be P (k, η) = a2 (η)P1,1 (k) + a4 (η)[P2,2 (k) + 2P1,3 (k)] + O(a6).
(158)
Notice that the power–spectrum to second order requires calculation of the ˆ ~k). The required integrals need to be performed nufourth–order terms in δ( merically: for specific examples see [281,547,285,120,359,274,203]. For an application of perturbative methods to non–Gaussian linear density fields, see [206]. Perturbation series for a spherical harmonic expansion are discussed by [572]. Some aspects of the perturbation expansion for open Universe models are covered by [366,103]. These methods are clearly useful (but a bit laborious) and can extend calculations of statistical quantities such as the power–spectrum and higher–order moments onto large scales where they still show a non–linear signal but cannot be reliably probed by computational methods. Nevertheless, there are a number of problems which mean that one should look for alternative methods to complement such perturbative techniques. First, there is the problem of convergence. There is no proof that the perturbation series (138), (153) and (154) actually converge, nor do we know what the domain of convergence is if they do. As soon as the second–order contributions to the power–spectrum become important, so do the third– and higher–order contributions so one is never sure exactly how much to trust a calculation to a given order. Having said that, this method does seem to give results compatible with the N–body simulations for a useful part of the parameter space [274]. Moreover, although useful for statistical information, the method does not provide an insight into the geometrical properties of the evolving distribution. For these reasons it is 52
useful to explore other dynamical approximations which might complement the perturbative method. 4.2. The Zel’dovich Approximation In 1970, Yakov B. Zel’dovich proposed an ingenious extrapolation of linear gravitational instability into the nonlinear regime [574], by following perturbations in the particle trajectories, rather than in the density field. In the following, we will use “particle” and “fluid element” interchangeably, because we are applying this technique to the case of a continuous medium rather than a discrete set of particles. The Zel’dovich approximation has the remarkably simple form: ~r = a~x(~q, t) = a(t) [~q + D+ (t)~u(~q)] , (159) where ~x is the final (i.e. Eulerian) comoving coordinate of a particle initially located at a Lagrangian co-ordinate ~q. In eq. (159), a(t) is the cosmic scale factor, and D+ (t) is the growing mode of the linear density contrast, defined in §2. We note that an extension of the Zel’dovich approximation which incorporates the decaying mode has been discussed in [42]. The vector field ~u(~q) is the initial velocity field of the particle (~u(~q) = ~v /aD˙ + ≡ d~x/dD+ ). We confine our ~ 0 (~q), where Φ0 (~q) is attention to initially irrotational flows so that ~u(~q) = −∇Φ the linear velocity potential, which is related to the Newtonian gravitational potential φ by φ = A−1 Φ0 where A = 2/(3H 2a3 ); for a spatially flat matter dominated Universe A is a constant (see §2.2 and [315,316]). The Kelvin circulation theorem then ensures that the velocity flow remains irrotational at least until orbit crossing. After this, there are regions of multistream flow and, although each stream remains curl–free the net velocity field is no longer potential. Any initial rotation present in the velocity field is strongly damped during expansion in the period before orbit-crossing. Vorticity can however be generated in multistream flows within pancakes, as shown in [162]. Attempts to incorporate vorticity directly into the Zel’dovich approximation have been discussed by [92,28]. A generalisation of the Zel’dovich approximation based on the principle of least action is given in [211]; see also [530]. An application of the Zel’dovich approximation to cosmic string wakes has been discussed in [450]. Relativistic generalisations of these approximations are discussed in §4.8. By reparametrising the time coordinate τ = D+ (t), equation (159) can be made to look just like the inertial motion of a particle moving with constant velocity ~u: ~x = ~q + τ~u(~q). (160) An essential feature of inertial motion given random initial conditions, is the intersection of particle trajectories leading to the formation of singularities in the density field. A similar effect is predicted also by the Zel’dovich ap53
proximation, and can be estimated quite simply by applying the continuity condition (mass conservation) dM = ρ0 d3~q = ρ(~x, t) d3~x.
(161)
As a result we get the following expression for the density in terms of the Jacobian of the transformation from ~q to ~x: "
dVe ∂~x =J dVl ∂~q
#
∂ 2 Φ0 | ∂qi ∂qj = [1 − D+ (t)λ1 (~q)] [1 − D+ (t)λ2 (~q)] [1 − D+ (t)λ3 (~q)] , = |δij − D+ (t)
(162)
where dVe ≡ d3~x and dVl ≡ d3~q, are the Eulerian and Lagrangian volume elements, respectively, and λ1 , λ2 and λ3 are the eigenvalues of the deformation tensor ∂ 2 Φ0 . (163) dij ≡ ∂qi ∂qj The expression for the density distribution is therefore ρ0 [1 − D+ (t)λ1 (~q)]−1 [1 − D+ (t)λ2 (~q)]−1 [1 − D+ (t)λ3 (~q)]−1 a3 ρ0 2 3 = 3 (1 − D+ I1 + D+ I2 − D+ I3 )−1 , (164) a
ρ(~r, t) =
where I1 = λ1 + λ2 + λ3 , I2 = λ1 λ2 + λ2 λ3 + λ1 λ3 and I3 = λ1 λ2 λ3 are the invariants of dij . The eigenvalues of the deformation tensor define a unique coordinate system in which a parallelipiped preserves its original form upon deformation. In general, the eigenvalues λi can be either positive or negative. A very useful analytical formula giving the joint probability distribution of an ordered set of eigenvalues λ1 > λ2 > λ3 , corresponding to a Gaussian potential field, was obtained by Doroshkevich [161], who showed that 53 .27 −3I12 + 15I2 /2 √ P (λ1 , λ2 , λ3 ) = exp (λ1 − λ2 )(λ2 − λ3 )(λ1 − λ3 ), σ02 8πσ06 5 (165) 2 where σ0 is the initial dispersion of the overdensity field; σ(t) = a(t)σ0 is the corresponding rms linear density at time t in an Ω0 = 1 Universe. !
A consequence of this result for a gaussian random field Φ0 is that the probability for one eigenvalue to be positive and the remaining two to be negative is 42% (the same as that for two positive and one negative eigenvalue). A volume element satisfying this criterion will collapse along one direction, resulting in the formation of two dimensional pancake-type singularities in the density field, which arise when 1 − D+ (t)λ1 = 0; see Fig. (2). 54
Fig. 2. Caustics arising in the Zel’dovich approximation are shown for a two dimensional realisation of eq. (159) with random (Gaussian) initial conditions.
We take this opportunity to remark that in this respect the Zel’dovich approximation is very similar to the equations describing the propagation of light rays in geometric optics. The formation of caustics – alternating bright and dark regions in the intensity of light – is a well–known phenomenon in the latter context; see [578,509,316]. Furthermore, the relationship between the singularities occuring in the Zel’dovich approximation and Catastrophe Theory has been explored in [9,88,10,11,509]. The situation in which two of the eigenvalues are positive and one negative leads to the formation of one dimensional filaments, which typically form at the intersection of pancakes. Collapse along all three directions (λ1 , λ2 , λ3 > 0) has a much smaller probability of occuring (8%), and leads to the formation 55
of zero dimensional singularities – clumps, which arise when two nearby filaments intersect. The reverse situation when all three eigenvalues are negative, corresponds to expansion along all three directions and leads to the formation of voids. Properties of voids in the framework of the Zel’dovich approximation and in the adhesion model are discussed in §5. An interesting feature of the pancake model is the percolation of high density regions which occurs generically in the Zel’dovich approximation. For Gaussian initial conditions such a situation is rather unlikely to occur since, in order for regions to form a percolating network it is essential that their volume (area) exceed 16% (50%) in 3D (2D) [509]. On the other hand, in the Zel’dovich approximation, we find that pancakes percolate despite the fact that they occupy a negligible fraction of the total volume. The reason for this is quite simple [509]: pancakes, filaments and clumps correspond to regions in Lagrangian space (L-space) where λ1 > 0. For a Gaussian distribution such regions occupy roughly 92% of the total volume in 3D (79% of the area in 2D). As a result such regions percolate in L-space. Since the Zel’dovich approximation (159) is a topology–preserving homomorphism, the requirements of continuity guarantee that any such mapping ~q → ~x which percolates in L-space will do so in Eulerian space (E-space) as well. The internal consistency of the Zel’dovich approximation can be assessed by means of the following argument [164]. Differentiating equation (159) twice with respect to time allows us to determine the acceleration of the fluid element. A dynamical estimate of the density ρdyn is then provided by the ~ r~¨r = −∇2 φ˜ = −4πGρdyn . If the Zel’dovich approxiPoisson equation (20): ∇ r mation were exact, the values of ρdyn determined dynamically from the Poisson equation and ρ calculated using the continuity conditions (161–164) would coincide. The fractional difference (ρdyn − ρ)/ρ ≡ δ˜ therefore provides us with a measure of the accuracy of the Zel’dovich approximation. Performing this calculation we find that 2 3 δ˜ = − D+ I2 + 2D+ I3 ,
(166)
where I2 and I3 are the invariants of the deformation tensor introduced earlier. From the above form for the fractional error δ˜ it is clear that δ˜ = 0 if λ2 = λ3 = 0, i.e. the Zel’dovich approximation is exact in one dimension, and in higher dimensional situations when the collapse is planar. The generic nature of pancake formation has been strikingly demonstrated for a wide variety of initial conditions by N-body simulations, e.g. [387]. It is worth noting that the error term δ˜ remains finite even during pancake formation, when D+ (t) ≃ λ−1 1 , and ρ → ∞. It is useful to call ρdyn the dynamical density and ρ the continuity density. Momentum conservation leads to ρdyn , mass conservation to ρ. For laminar flows the Zel’dovich approximation can be suitably inverted and expressed in Eulerian space as ~q(~x) = ~x − D+~u[~q(~x)], the continuity 56
equation then yields [415] : δ=|
∂~q 2 ˜ 3 ˜ | − 1 = −D+ I˜1 + D+ I2 − D+ I3 , ∂~x
(167)
where I˜1 , I˜2 , I˜3 are the invariants of the deformation tensor ∂~u(~x)/∂~x evaluated in Eulerian space. The POTENT procedure was used in [415] to determine ~u(~x); then eq. (167) was used to reconstruct the form of the density field in the weakly non-linear regime. Evaluating the acceleration according to the Zel’dovich approximation (159) and substituting its value in the Euler equation (16), we obtain δdyn = ρdyn /¯ ρ− ~ ˙ 1 = −∇~v/Hf a (~v = aD+~u) which, surprisingly, is also just the linear velocity density relation (21). It can be shown [415] that in general, δdyn overestimates the real value of the density, whereas δ tends to underestimate it, so that (δ + δdyn )/2 often provides a better estimate of the actual density contrast than either δ or δdyn . At relatively early times when the density contrast is still linear D+ (t) < 1, the higher order terms in eq. (164) – b2 I2 and b3 I3 – can be ignored relative to bI1 , with the result that eq. (164) reduces to ρ(~x, t) ≃
ρ0 (1 + D+ I1 ) a3
(168)
or, more usefully, δρ ≃ D+ (t)I1 = D+ (t)(λ1 + λ2 + λ3 ) = D+ (t)∇2 Φ0 . ρ
(169)
Since Φ0 ∝ φ, we recover the linearised Poisson equation. Comparing eq. (169) with eq. (164), we find that the predictions of linear theory and the Zel’dovich approximation (ZA) as to the formation sites of the first nonlinear objects are somewhat different. Whereas the Zel’dovich approximation predicts that the first pancakes will collapse near high peaks of the largest eigenvalue λ1 , linear theory predicts that the first nonlinear objects will form near the maxima of δρ/ρ ∝ (λ1 + λ2 + λ3 ). For very asymmetric configurations of the primordial density field (λ1 >> λ2 , λ3 ), the results of ZA and linear theory are expected to correlate, however important differences can also arise especially in regions where some of the eigenvalues are negative. For instance regions in which P λ1 > 0 and λ2 , λ3 ≪ 0 so that i λi < 0, will remain forever underdense according to linear theory, yet would correspond to sites for pancake formation according to ZA. An interesting feature of one dimensional pancake collapse is that the surface density of pancake matter remains finite even as the density within pancakes approaches infinity. (For planar collapse the density profile in the vicinity of 57
1
a pancake located at ~x1 is ρ ∝ |~x − x~1 |− 2 .) This leads to finite, well defined values for both the gravitational potential and the gravitational force field outside pancakes. A discussion of the physics at the sites of caustic formation can be found in [165,61,513,579]. Using eq. (165) in conjunction with eq. (164) it is possible to derive an expression for P (ρ, a) – the probability distribution function for the density (PDF) in the Zel’dovich approximation [316,317,37]: 9 × 53/2 P (˜ ρ, t) = 4π ρ˜3 Ns σ 4
Z∞
dse−
(s−3)2 2σ 2
3˜ ρ−1/3
6s
2 β1
2 β2
2 β3
(1 + e− σ2 )(e− 2σ2 + e− 2σ2 − e− 2σ2 ), (170)
where σ is the variance, defined by 2 σ 2 (R, t) = 4πD+ (t)
Z
P (k)W 2 (kR)k 2 dk,
(171)
and βn (s) =
√
5s
�
1 2
1 2 ρs3 − 1) + cos (n − 1)π + arccos(54/˜ 3 3 �
��
,
(172)
in which ρ˜ = ρ/¯ ρ and Ns is the mean number of streams in the flow; Ns = 1 in the single stream regime indicating the absence of shell crossing. For small values of the variance σ ≪ 1 we recover the linear result 1 (ρ − ρ¯)2 P0 (ρ) = √ . exp − 2σ 2 2πσ "
#
(173)
The Gaussian density distribution described by equation (173) is valid only at early times when departures from the mean density are small. At late times δρ/ρ can become as large as we like in regions where λ1 > 0. In regions where λ1 < 0 (i.e. voids) on the other hand, the density is always bounded from below by ρ > 0, so that δρ/ρ ≥ −1. As a result, the initially symmetric distribution (173) gradually develops an asymmetry and the probability distribution function, equation (170) grows progressively more non–Gaussian with time; see Figure (3). It is interesting to note that for large densities ρ >> ρ¯ eq. (170) has the asymptotic form P (ρ, t) ∝ ρ−3 . Since the density distribution near a pancake will depend upon the distance ‘x’ to the pancake we get P (ρ)dρ ∝ dx which gives ρ ∝ x−1/2 , which correctly reproduces the density profile in the vicinity of pancakes. A discussion of the density PDF in ZA after final smoothing can be found in [37]; also see [421]. For small |ρ − ρ¯|, it can be shown that [317] the probability density function resembles the log-normal distribution [127]. This is demonstrated in Fig. (3), where the probability distribution function for the density is shown both for 58
Fig. 3. The probability density function for the lognormal (solid line) and ZA (dashed line) for three different smoothing lengths: Rs = 18, 12, 6h−1 Mpc., corresponding to σ = 0.11, 0.26, 0.55. Filled regions correspond to the results of N –body simulations of a standard CDM model. Reproduced, with permission, from [317].
the lognormal distribution and the Zel’dovich approximation. When we compare these two approximations with N–body dynamical simulations, we find that for small values of the smoothing length corresponding to σ ≤ 0.26 ZA models the N–body results somewhat better than the lognormal distribution, whereas for larger values of σ the reverse is true [317]. In contrast to the density distribution, the one–point velocity distribution function retains its original Gaussian form to a large extent, even in the nonlinear regime, until orbit crossing. From the observational viewpoint, the probability distribution functions for the density and the velocity could be used to 59
statistically discriminate between initially non-Gaussian distributions (such as those predicted by string/texture models of galaxy formation), and distributions that evolved from Gaussian initial conditions. Preliminary results based on the POTENT reconstruction (§8.10) and the IRAS survey (§8.1) have been obtained in [316,317]; they indicated that models with Gaussian initial conditions are compatible with present observations. The Zel’dovich approximation also leads to interesting evolution equations for the gravitational and velocity potentials in the non-linear regime. To demonstrate this, we assume that the only operative mode of gravitational instability is the growing mode. In linear theory this guarantees that the velocity field is irrotational. Requiring this to be the case in the non-linear regime as well (this is in fact guaranteed by Kelvin’s circulation theorem until shell crossing) and rewriting the Euler equation and the Bernoulli equations (16) and (17) in terms of the comoving velocity ~u = (~v /aa) ˙ = d~x/ da and the comoving 2 ~ velocity potential ~u = −∇Φ, Φ = φv /(a a), ˙ we obtain (for a pressureless medium) h i ∂~u ~ x φ + ~u ~ x )~u = − 3 A∇ (174) + (~u∇ ∂a 2a 3 ∂Φ 1 − 2 (∇x Φ)2 = (Aφ − Φ), (175) ∂a 2a where A = (3H 2 a3 /2)−1 . The quantity A does not depend upon time if the Universe is flat and matter dominated. Similarly the continuity and Poisson equations become ∂η ~ + ∇x (~uη) = 0 (176) ∂a Ωδ ∇2 φ = , (177) Aa where η = a3 ρ is the comoving density. As mentioned earlier, the expression for the dynamical density in the Zel’dovich approximation reduces to the lin~ v /(Hf a) [415], when combined with the Poisson ear expression: δdyn = −∇~ equation (177) this leads to the following relationship between the velocity and gravitational potentials (in a spatially flat matter dominated Universe): Φ = Aφ which is equivalent to saying that the peculiar fields for the velocity and the acceleration are parallel to one another. (In the one dimensional case, Φ = Aφ is exactly true even in the nonlinear regime. As a result the Zel’dovich ansatz ceases to be an “approximation” and provides an exact treatment of nonlinear gravitational instability in one dimension, until particle trajectories cross). Substituting this result into the Euler and Bernoulli equations (16) and (17), we obtain: ∂~u ~ u = 0; + (~u∇)~ (178) ∂a ∂Φ 1 − 2 (∇x Φ)2 = 0; (179) ∂a ∂φ 1 (180) − (∇x φ)2 = 0. ∂a 2 60
~ x ), implying that the Equation (178) gives du/ da = 0, ( d/da = ∂/∂a + ~u∇ particle motion is inertial. The equation for the velocity potential Φ has the following interesting analytical solution: Φ(~x, a) = Φ0 (~q) −
(~x − ~q)2 2a
(181)
The gravitational potential evolves according to an identical equation. Differentiating eq. (181) alternately with respect to ~x and ~q, we finally get ~ qΦ ~x = ~q − a(t)∇ ~ x Φ(~x, a) = −∇ ~ q Φ0 (~q), ~u = −∇
(182)
recovering the Zel’dovich approximation. The fact that the velocity is always parallel to the acceleration vector makes particles move along straight lines in the Zel’dovich approximation. It is interesting that the evolution equation for the potential (179) and its solution (181) allow one to reconstruct the primordial form of the velocity potential Φ0 from its present value Φ. (The same applies also to the gravitational potential φ.) Attempts to do this using the POTENT procedure have been discussed by [413]. This involves an integration of the Zel’dovich–Bernoulli equation (179). As demonstrated recently by Gramann [225] a somewhat different evolution equation for the gravitational and velocity potentials would result if we were to substitute the expression for the continuity density in the Zel’dovich approximation (167) into the Eulerian continuity equation (176). The relationship between the gravitational and velocity potentials would then become Φ = φ − a(t)Cg
(183)
(we put A = 1 for simplicity), where the function Cg is determined from 2
∇ Cg =
2 3 X X
i=1 j=i+1
"
∂2φ ∂2φ ∂2φ 2 ) −( ∂x2i ∂x2j ∂xi ∂xj
#
(184)
the corresponding evolution equation for the gravitational potential would then be modified to ∂φ 1 − (∇x φ)2 = Cg . (185) ∂a 2 The Zel’dovich-Continuity equation (185) appears to be an improvement over the Zel’dovich-Bernoulli equation (179) when tested against N-body simulations [225]. (One can replace a(t) by D+ (t) for greater generality in the above equations.) We would like to conclude this discussion of the Zel’dovich approximation by mentioning that, from the point of view of an observer, the peculiar velocity 61
flow associated with overdense regions can give rise to redshift space caustics. Such caustics arise when overdense regions cease expanding along our line of sight and begin to contract. Investigating this effect in the linear regime, Kaiser [287] showed that for a spherical density enhancement, redshift caustics occur just inside the turnaround radius. Some insight into this effect can also be obtained using the Zel’dovich approximation. Differentiating eq. (159) with respect to time we get ~ = d~r = H~r − aD˙ + ∇Φ. ~ V dt
(186)
The second term in the right hand side of eq. (186) indicates the departure from the pure Hubble flow: V~H = H~r. Aligning our coordinate system so that the radial direction ~r is along the z-axis, we obtain the following expression for the redshift distance to the particle (or galaxy) ~z =
~ V ~ 3 = a~q3 − (1 + f ) a(t) D+ (t) (∇Φ) ~ 3 , (187) = ~r3 − f a(t) D+ (t) (∇Φ) H
where f is the usual growth factor, f ≃ Ω0.6 0 (see §2.2 eq. (22)). Following the deformation of a unit volume element from the Lagrangian coordinate system ~ /H), and (q1 , q2 , q3 ), to the modified Eulerian coordinate system (r1 , r2 , z = V using the continuity equation, we get [535]
ρ0 ρ(~r, t) = 3 det a
1 − D+ d11
−D+ d12
−D+ d13
−D+ d12
1 − D+ d22
−D+ d23
−(1 + f )D+ d13 −(1 + f )D+ d23 1 − (1 + f )D+ d33
,
(188) where dij denotes the deformation tensor, defined by eq. (163). In the distinctive case when the eigenvectors corresponding to the eigenvalues λ1 , λ2 , λ3 are aligned along the line of sight, equation (188) simplifies to give ρ(~r, t) =
ρ0 (1 − D+ λ1 )−1 (1 − D+ λ2 )−1 (1 − D+ (1 + f )λ3 )−1 . 3 a
(189)
From eq. (189) it follows that a redshift singularity along the line of sight −1 will arise when D ≡ Dz = [(1 + f )λ3 ]−1 ≃ [(1 + Ω0.6 0 )λ3 ] , since Dz < D∗ = 1/λ3 , a line of sight singularity will always precede the formation of a real density singularity. This is a simple consequence of the fact that collapse must be preceded by “turnaround”, i.e. the expansion must stop before the contraction can begin. The overdensity of matter at the time of formation of the redshift singularity can be obtained from eq. (164), in particular for Ω0 = 1, Dz = 1/2λ3 and ρz ≃ ρ0 /a3 (1 − Dz λ3 ) = 2ρ0 /a3 , giving δ ≃ 1, which corresponds to the extrapolated linear overdensity of a spherical mass fluctuation at turnaround. 62
Although the Zel’dovich approximation is extremely accurate in predicting the density field until the formation of pancakes and other caustics, its validity breaks down soon after shell crossing. Improvements and extensions of the Zel’dovich approximation can be broadly divided into two main categories: – those that like ZA are formulated within the Lagrangian formalism; – those which have been conceived within the Eulerian framework. To the former belong the truncated Zel’dovich approximation and the adhesion model [237,238] as well as approximations based on Lagrangian perturbation theory [401,91,92,78]. To the latter – the so-called frozen flow and linear potential approximations [371,84,15].
4.3. The Truncated Zel’dovich Approximation (TZA) An important feature of hierarchical clustering is that not all scales are in the non-linear regime at any given epoch. The simplest extension of the Zel’dovich approximation – the truncated Zel’dovich approximation (TZA) – is based upon this fact, and the observation that modes contributing to the breakdown of ZA are those that have gone nonlinear at a given epoch. By selectively filtering all modes with k ≥ kN L (where kN L is epoch–dependent), we can prevent shell crossing and the consequent “smearing out” of caustics that occurs in the straightforward ZA [128,321,386]. If one chooses the criterion δρ/ρ ≃ 1 to mark the onset of non-linearity then −1 the non-linear length scale kN L can be determined from the equality 2
1 2
σ(R, t) ≡ h(δρ/ρ) i =
D+ (t) 4π
kZNL
kH
1 2
P (k)k
2
dk
= 1,
(190)
where kH = 2πa(t)/λH is the comoving horizon scale, P (k) is the power spectrum. For power law spectra P (k) ∝ k n 2/(n+3)
−1 kN L ∝ D+
(t).
(191)
−1 Clearly an increase in D+ (t) will be accompanied by an increase in kN L , indicating that, as the Universe evolves, successively longer wavelength modes go nonlinear.
TZA has been compared with ZA and N-body simulations [128,386,493]. The result of these studies is that TZA performs considerably better than ZA, particularly at late times and for primordial spectra with more large scale power, when the evolved matter distribution is compared point–by–point with 63
a full N–body simulation with the same initial conditions. The form of filter 2 which optimises TZA seems to be a Gaussian window: exp[−k 2 /2kG ] (kN L ≤ kG ≤ 1.5kN L ) applied to the initial power spectrum P (k) [386]. The success of TZA may at least partially, be attributed to the fact that the evolved gravitational potential resembles the smoothed initial potential much more so than it does the unsmoothed initial potential. As a result although small scale features are wiped out in TZA, large scale features are accurately described by it, since particles are made to move in a smoothed potential which closely resembles the true evolved potential at any given time [428,385]. An application of TZA to the theory of the clustering of Abell clusters is described in [75]. An interesting application of TZA for determining the typical mass displacement of objects drms was suggested by Shandarin [506]. From ZA (159) one finds 1
drms ≡ h(~x − ~q)2 i 2 = D+ (t)~urms 1
~urms = h~u(~q)2 i 2 .
(192)
Smoothening the original velocity field on non-linear length scales k > kN L we get ~u2rms (kN L )
= 4π
kZNL
P (k)dk.
(193)
kH
Combining eqns. (190), (192) and (193) gives d2rms (kN L )
R kNL
H = R kkNL
kH
P (k)dk
P (k)k 2 dk
.
(194)
It is interesting that drms can sometimes be greater than the non-linear length −1 scale kN L . This can be clearly seen for power-law spectra with sufficient large scale power for which (194) reduces to n+3 drms (kN L ) = − n+1 �
�1
2
kH kN L
! n+1 2
−1 kN L
− 1 > n > −3.
(195)
Thus clumps (with a mass given by (219)) can move coherently travelling a −1 distance ∼ drms >> kN L for n < −1. As pointed out by Shandarin [506] this might provide an explanation for the presence of large coherent structures on scales which are still evolving according to linear theory in cosmological scenario’s such as CDM. It is interesting to note in this context that the scale at which the phases of δk can depart significantly from their original values is close to drms [469,506]. Comparatively little is known about the precise behaviour of the phases of the Fourier components, however, and this is one of the big gaps in our knowledge of the clustering process [440,534,501,520]. 64
4.4. Lagrangian Perturbation Theory The great success of ZA is at least partly due to its being formulated in Lagrangian space rather than in Eulerian space. This allows one to follow particle trajectories and the accompanying evolution of overdensities for a much longer period of time in ZA – effectively until shell crossing when δ → ∞ – than was possible in an Eulerian framework which usually breaks down when δ ∼ 1. Pursuing this logic further, a general Lagrangian perturbation approach in which, as in ZA, the fundamental perturbed quantity is taken to be the displacement field rather than the overdensity might be expected to be more accurate [401,78,91,92,93,94,95,329,283,224,403,81,101]. To demonstrate some aspects of this approach let us consider the dynamical behaviour of particle trajectories in Lagrangian space. We assume for simplicity that the Universe is spatially flat and matter dominated. Extensions of our argument to a curvature dominated Universe may be found in [78]. As in ZA, we assume that the comoving Eulerian coordinate of a particle ~x and its ~ comoving Lagrangian coordinate ~q are related by a displacement field Ψ: ~ ~q). ~x = ~q + Ψ(t,
(196)
Introducing the displacement matrix Mik (t, ~q) =
∂xi ∂Ψi = δik + ∂qk ∂qk
(197)
we find that Mik satisfies the equations ∂ 2a2 −1 2 ∂Mik −1 a Mki + 2 (J − 1) = 0, ∂t ∂t 3t !
(198)
−1 ǫikl M˙ km Mml = 0, (199) where J = | detMik | is the Jacobian of the transformation eq. (196), and ǫikl is the Levi-Civita tensor. Equation (199) is the condition for potential motion in Eulerian space [579]. The resulting density and velocity fields can be determined from
ρ ≡ δ + 1 = J −1 , ρ0
∂~x ~u = a ∂t
!
~˙ = aΨ.
(200)
q~
In the weakly nonlinear regime, equations (198) & (199) can be solved by ~ in a series Ψ ~ =Ψ ~ (1) + Ψ ~ (2) +..; higher orders in Ψ ~ (n) (n > 1) being expanding Ψ related to lower orders via an iterative procedure [401,92,329]. In a spatially ~ (n) are separable at every perturbative order flat matter dominated Universe Ψ (n)
Ψi
(n)
n = D+ (t)ψi (~q),
65
D+ (t) ∝ a(t),
(201)
the lowest order solution being the Zel’dovich approximation (1)
(1)
xi = qi + D+ (t)ψi (~q),
ψi
=−
∂Φ(~q) . ∂qi
(202)
~ =Ψ ~ (1) + Ψ ~ (2) give rise to what we might call the The second order terms Ψ post-Zel’dovich approximation (hereafter PZA) where (2)
ψi,i = −
i 3 h (1) 2 (1) (1) (ψi,i ) − ψi,j ψj,i , 14 (2)
(203)
(2)
ψi,j = ψj,i , (204) Derivatives are defined the with respect to the Lagrangian coordinate ~q; summation over repeated indices is assumed. As a result, (1)
(2)
2 xi = qi + D+ (t)ψi (~q) + D+ (t)ψi (~q).
(205)
The third–order Lagrangian approximation (or the post-post-Zel’dovich ap~ = P3n=1 Ψ ~ (n) where proximation, hereafter PPZA) results in Ψ i h 1 5 (2) (1) (2) (1) (1) (3) ψi,i = − (ψi,i ψj,j − ψi,j ψj,i ) − det ψi,j , 9 3
(206)
� 1 � (2) (1) (2) (1) (207) ψi,k ψk,j − ψj,k ψk,i 3 [283,94]. It should be mentioned that, beginning with the third order approximation, the particle displacement field is no longer potential in higher order Lagrangian approximations. (In one dimension ψ (3) = ψ (2) = 0, a consequence of the fact that the Zel’dovich approximation is an exact solution to the equations of motion (until shell crossing) in this case.) (3)
(3)
ψi,j − ψj,i =
Many of the results originally derived for the Zel’dovich approximation have recently been extended to higher order Lagrangian theories and especially to the post-Zel’dovich approximation (PZA) [93,95,283,329,224,403]. Spherical collapse in Lagrangian theories has been investigated in [403]; see §4.7. A treatment suitable for non–flat Universes is presented in [101]. The moments of the density distribution have been calculated in [78,403,258]; see §4.7. One can also incorporate the PZA into the POTENT reconstruction ansatz by deriving an analytical form for the density-velocity relation in PZA [224]. Higher–order Lagrangian theories have been compared with other approximations, including the frozen flow (FF) and linear potential (LP) approximations [403]; the conclusion is that such Lagrangian methods invariably perform better than either FF or LP in the weakly non–linear regime (see §4.7). The great strength of the ZA when compared with these other methods is that its simplicity allows many properties to be calculated analytically. As was the case with the Zel’dovich approximation, higher order Lagrangian approximations break down soon after shell crossing and the formation of 66
the first pancakes. This problem can be partially remedied if (as in ZA) we introduce a cutoff scale in the original power spectrum which filters all scales that are going non-linear at a given epoch, the resulting approximations are then the truncated versions of PZA, PPZA etc. [96].
4.5. The Adhesion Approximation As discussed in §4.2 the Zel’dovich approximation works very well until the formation of the first nonlinear structures – pancakes. Since particle motion is essentially inertial in ZA, particles passing through one and the same pancake do not feel each others gravitational influence. As a result, the stabilising effect which high density regions (caustics) have on particle trajectories is absent in ZA, and particles are allowed to sail through caustics and are even pushed away from them after passing through. This leads to an artificial broadening of pancakes, and results in their ultimate disappearence. This limitation is shared by extensions of ZA such as the post Zel’dovich approximation etc., which break down order by order, soon after shell crossing. This tendency is countered in the adhesion model (hereafter AM) – a nonperturbative extension of the Zel’dovich approximation – in which particles are made to stick together once they enter into caustics, mimicking the viscous effects of gravity on small scales. As a result pancake thickness is stabilised in the adhesion model, just as it is in N-body simulations. In order to see how this is accomplished we note that the combined effect of the terms in the right hand side of the Euler equation (174) is like a force whose presence helps to keep the thickness of pancakes finite. In the ZA the right hand side in eq. (174) is set equal to zero so that the resulting motion of a particle is inertial: d~u/ da = 0. Solving the coupled set of nonlinear equations (174–176) is not mathematically feasible. However, by replacing the right hand terms in equation (174) by a mock viscosity term introduced to mimic the adhesive effects of nonlinear gravity on small scales, we obtain ∂~u ~ u = ν∇2~u. + (~u∇)~ ∂a
(208)
Equation (208)is well known from studies in turbulence as the three dimensional generalisation of Burgers’ equation [97,566]. For potential motion ~u = ~ which we shall be considering, eq. (208) can be solved analytically by −∇Φ performing the Hopf-Cole substitution Φ(~x, a) = −2ν log U(~x, a). As a result eq. (208) translates into the familiar diffusion equation ∂U = ν∇2 U. ∂a 67
(209)
Solving eq. (209) (omitting some intermediate steps) we obtain [237,238]: Φ(~x, a) = −2ν log
"
~u(~x, a) =
1 3
(4πνa) 2 R
�
3
�
�
~x−~q exp[−S(~x, a;~q)/2ν] a , d3 q exp[−S(~x, a;~q)/2ν]
d3~q R
where the “action”
�#
1 d ~q exp − S(~x, a; ~q 2ν
Z
S(~x, a; ~q) = −Φ0 (~q) +
,
(210)
(211)
(~x − ~q)2 , 2a(t)
(212)
satisfies equation (179). The trajectory of a particle can now be determined from equation (211) by solving the integral equation [412,559] ~x(~q, a) = ~q +
Za
da′~u[~x(~q, a′), a′ ],
(213)
0
and the resulting density can be determined from the continuity equation ρ(~x, a) = ρ0 (~q)|∂~x/∂~q|−1 ,
(214)
For small (but finite) values of the viscosity parameter ν → 0, the integrals in equations (210) and (211) can be evaluated using the method of steepest descents. (Note that a small ν implies a large Reynolds number R0 = u0 l0 /ν, u0 and l0 being respectively, the characteristic amplitude and coherence length of the primordial velocity field [239].) The resulting solutions acquire a simplified form [237,238,320,321]: Φ(~x, a) = −2ν log and ~u(~x, a) =
X α
�
jα exp −
P � ~x−~qα � α
a
1 S(~x, a; ~qα ) 2ν
�
(215)
jα exp[− 2ν1 S(~x, a; ~qα )]
, (216) exp[− 2ν1 S(~x, a; ~qα )] where ~qα are the Lagrangian coordinates that minimise the action (212), i.e. α jα
P
(~x − ~qα )2 = min, 2a(t) h ∂ 2 Φ0 i− 21 jα = det(δij − ) . ∂qi ∂qj q=qα
Sα ≡ S(~x, a; ~qα ) = −Φ0 (~qα ) +
(217)
The points ~qα that minimise the action satisfy the Zel’dovich equation ~x(~qα , a) = ~ q Φ0 (~qα ); S(~x, a; ~q) ≥ S(~x, a; ~qα ) for any ~q 6= ~qα . ~qα − a∇ Equations (215) and (216) have an interesting geometrical interpretation according to which the formation of caustics in E-space can be related to the 68
degree of the mapping from {~qα } to {~x} – the apex of the paraboloid (Fig. (4)). At early times this mapping is one–to–one, since the curvature of the paraboloid P (~x, a; ~q) is greater than that of the primordial potential φ0 (or equivalently Φ0 ). At such times the Zel’dovich approximation is universally valid. With passing time, as the curvature of the paraboloid decreases it begins to touch the potential in more than one point, resulting in a mapping from {~qα } to {~x} which is many-to-one. This indicates the onset of the epoch of pancake formation. A pancake forms at ~x when the paraboloid (with apex at ~x) touches the potential in exactly two points (so that the mapping from {~qα } to {~x} is two-to-one). Filaments form at the intersections of pancakes; for them the mapping is three-to-one, and knots at the intersections of filaments, the mapping being four-to-one. The density of matter in these structures is directly related to the degree of the mapping, so that knots are denser than filaments, which in turn are denser than pancakes [476]. The masses and velocities of knots can be obtained in this ansatz as follows. In two dimensions the mass of a knot at ~x is given by M(~x) ≃ ρ¯∆(~q1 , ~q2 , ~q3 ), where ∆(~q1 , ~q2 , ~q3 ) is the area of a triangle with vertices at ~q1 , ~q2 , ~q3 , and ρ¯(t) is the mean density of matter in the Universe. In three dimensions, M(~x) ≃ ρ¯ D(~q1 , ~q2 , ~q3 , ~q4 ), where D(~q1 , ~q2 , ~q3 , ~q4 ) is the volume of a pyramid with vertices at ~q1 , ~q2 , ~q3 , ~q4 . Similarly, the velocity of the knot U in two dimensions can be determined by solving the following system [321] of algebraic equations: ~ · (~q1 − ~q2 ) = Φ0 (~q2 ) − Φ0 (~q1 ) U ~ · (~q1 − ~q3 ) = Φ0 (~q3 ) − Φ0 (~q1 ) U
(218)
~ in terms of a (and similarly in 3D). Equation (218) describes the velocity U ~ is vector defined in a three dimensional space (Φ0 , ~q). The magnitude of U proportional to the area of the triangle constructed by joining the osculating points of the potential Φ0 (~qα ). Its direction is given by the projection of the normal to the plane of this triangle onto the Lagrangian plane defined by the vectors (~q1 , ~q2 ). In one dimension a knot is formed at the apex of a paraboloid touching the potential in exactly two points. As a result its mass is given exactly by m = (|~q1 − ~q2 |) × ρ¯, and its velocity by ~u = d~x/ da = ~n(|φq1 − φq2 |)/(|q1 − q2 |), the direction vector ~n pointing from higher to lower values of the gravitational potential. The mass function of knots evaluated using the adhesion approximation, shows good agreement with the Press-Schechter mass function for a wide range of spectra, in both one and two dimensions [569,321]. The formation and evolution of large scale structure is described by the adhesion model as a two stage process. During the first stage matter falls into pancakes and then moves along them towards filaments and then along filaments to collect finally in knots. At the end of the first stage the formation of the skeleton of the large scale structure is complete and virtually all of the 69
matter in the Universe is located in one of three structural units: √ pancakes, −1 filaments or knots. This happens at the epoch when kN L ∼ R∗ = Dσ1 /σ2 , R∗ characterising the average separation between peaks of the gravitational potential. (The quantities σ0 , σ1 , σ2 are the standard deviations in the potential and its first and second derivatives respectively; D is the dimensionality of space.) The second stage sees the deformation of the large scale structure skeleton due to the dynamical motion of pancakes, filaments and especially knots towards each other, caused by their mutual gravitational attraction. This stage witnesses the merger of knots and the disappearance of small voids. illustrated in Fig. (11) for the one dimensional case. During this stage the paraboloid is extremely broad and can therefore feel very large features in the primordial gravitational potential. As a result, the corresponding picture of large scale structure often shows the presence of large “secondary pancakes” whose size √ is related to the characteristic correlation scale of the initial potential Rφ = Dσ0 /σ1 [321]. Secondary pancakes should be distinguished from primary pancakes which form at the onset of gravitational instability. In addition to providing a simple geometrical means to determine the masses and momenta of clumps, the adhesion model can also be used to determine the sizes of voids and the associated void spectrum for a given cosmological model. Some properties of voids obtained using the adhesion ansatz are summarised in §5.3 (see also [476]). Statistical properties of solutions to Burgers equation have been studied, both in and out of the cosmological context [306,236,237,238,163,546]. Numerical studies aimed at determining, among other things, the velocity distribution and mass function of knots have been performed in one dimension [569] and in two dimensions [321]. In addition, the evolution of voids [476] and filamentary structures [412,321] have been discussed at length. An interesting result that emerges from these studies is that for power law spectra P (k) ∝ k n the typical mass in knots grows as [237,238,306,509]: M ∝ a(t)6/(n+3)
−1≤n≤1
(219)
For steeper spectra n > 1 the adhesion model predicts M ∝ a3/2 [569,509]. It is interesting to compare the predictions of the adhesion model with those arising from semi-analytic models of hierarchical clustering such as the PressSchechter approximation [461], discussed in §3.4. PS suggests that equation (219) is valid over a somewhat broader range −3 ≤ n ≤ 4. For very steep spectra n > 4 PS predicts the limiting rate M ∝ a(t)6/7 which is slower than the limiting growth rate predicted by the adhesion model. 19 19
As in §4.2 the preceeding discussion can be made more general by replacing a(t) with D+ (t), the growing linear density contrast.
70
Fig. 4. The geometrical representation of a paraboloid descending onto the (two-dimensional) gravitational potential in order to demarcate sites of structure formation. The paraboloid is tangent to the potential in Lagrangian space, its apex shows the location of caustics (filaments and clumps) in Eulerian space. Adapted, with permission, from [320].
The adhesion model has been found to work very well in explaining the large scale features of the structure of the Universe. Comparison with N-body simulations has shown remarkable agreement till very late nonlinear times [559,560,474,317,476]. The main drawback of the adhesion model is probably the fact that one cannot follow particle trajectories within pancakes and filaments, which remain arbitrarily thin in models where the coefficient of viscosity ν is taken to be very small. Note that ν has√dimensions of (length)2 , so that the thickness of pancakes is proportional to ν.
71
4.6. The Frozen Flow and Linear Potential Approximations In addition to the adhesion approximation, other recent attempts to prevent the artificial thickening of pancakes present in ZA, have led to the development of the Frozen Flow (henceforth FF) and Linear Potential (LP) approximations. Unlike the Lagrangian space based approximations considered earlier, both FF and LP are formulated in Eulerian language. For FF see [371]; LP is discussed in [84,15]. In FF a particle moving along a fixed trajectory constantly upgrades its velocity to the local value of the linear velocity field. The equations of motion in FF can be derived very simply from equation (174) by neglecting the non-linear term (~u∇)~u and setting ~u = −A∇φ0 so that ∂~u = 0. ∂a
(220)
As a result the comoving velocity field of a particle remains frozen to its initial value ~u(~x, t) = ~u(~q = ~x). Since particles loose memory of previous motion they behave as inertialess tracers of the primordial velocity field which is a fundamental reversal of the assumptions made in the Zel’dovich approximation. Continuity demands that the component of the force field perpendicular to the plane of the pancake – ∇(φ0 )⊥ vanish at sites of pancake formation. As a result particle velocities directed towards the pancake get progressively smaller as the site of pancake formation is approached. The velocity component parallel to the pancake however remains unaffected with the result that, as a particle approaches a pancake site it slows down and modifies its velocity, in such a manner so as to move along the pancake towards lower values of the gravitational potential, converging ultimately in a clump at a local minimum of φ0 . This asymptotic convergence guarantees that particle trajectories will never intersect in FF and that the resulting pancake will always remain thin. A drawback of FF is that, with the passage of time most particles collect in minima of the potential where ~u = 0, as a result no further evolution of large scale structure is possible within the framework of this model. The density contrast in FF can be estimated from the continuity equation (18) or (176) which gives
η(~x, a) = η0 (~q) exp
Za
a0
~ u [~x(~q, a), a′ ] . da′ ∇~
(221)
~ u = −∇2 φ0 (~x) = −δ(~x)/a = constant, we finally get Substituting ∇~ x η(~x, a) = η0 (~q) exp
Za
da′ δ+ [~x(~q, a′ )] ,
(222)
a0
where δ+ is the unevolved value of δ(~x)/a in the linear regime, i.e. the value 72
of the linear density field integrated over the trajectory of the particle equals the logarithm of the density. Equation (222) presents a generalisation of the log-normal distribution [127] according to which the linear and nonlinear density contrasts are related through η(~x, t) = η0 exp[δ(~x, t)], δ(~x, t) being the linear density contrast at a fixed coordinate value ~x. In fact [403] the probability distribution function in FF in the weakly nonlinear regime reproduces the log-normal result (133) for σ ≪ 1. Both FF and the log-normal distribution give similar results when applied to particles located at local maxima or minima of the initial gravitational potential when there is little change in the particle distribution. Since at early times voids can be associated with peaks in the gravitational potential, FF predicts δF F ≃ exp[−|δ+ (~x)| a(t)]−1 → −1, indicating that voids are evacuated fairly rapidly. Comparison with the spherical top hat model shows that FF leads to a somewhat faster evacuation of voids than predicted (see §4.7 and §5.1). The linear potential approximation (LP) is based on the observation that the gravitational potential usually evolves much more slowly than the density field. This is clearly indicated by the linearised Poisson equation ∇2 ϕ ∝ δ/a, (δ ≪ 1) , which demonstrates that φ = φ0 = constant, if the Universe is spatially flat and matter dominated so that δ ∝ a. The Euler equation in this case simplifies to d~u 3 3 ~ (223) + ~u = − ∇φ 0. da 2a 2a indicating that particle trajectories follow the gradient of the primordial potential – effectively moving along its lines of force. Unlike FF, particle trajectories in LP can and do intersect at sites of pancake formation, which correspond to the directional minima of the primordial gravitational potential. Particle motion is oscillatory in such regions, which prevents the resulting pancake from becoming too thick. As in FF, the subsequent motion of particles within pancakes follows the primordial potential, with virtually all the particles collecting in clumps, corresponding to local minima of the initial potential, at late times. (Note that in both FF and LP particle trajectories can be curved, which sets them apart from the straight line trajectories of the Zel’dovich aproximation.) An essential limitation of both FF and LP is that, since in both approximations particles move according to the dictat of the primordial velocity/gravitational potential, neither is equipped to describe the merger of clumps, which is the predominant feature of gravitational instability at late times, especially in hierarchical models such as CDM. This limitation is not shared by the adhesion model as demonstrated in [321,476,493]; see also §4.7. A common feature shared by all the approximations discussed in this chapter (i.e. ZA, P(n) ZA, AM, FF and LP), is that they allow a fully parallel treatment, making them ideally suited for efficient implementation on highly parallel 73
computers.
4.7. A Comparison of Non–linear Approximation Methods The relative accuracy of nonlinear approximation methods can be established by testing them both against each other as well as against exact theoretical predictions (where these are available) or alternately, against the results of N-body simulations. In the weakly nonlinear regime, the predictions made by higher–order Eulerian perturbation theory can be used to test the accuracy of different approximation methods [227,405,403,38]. In the strongly nonlinear regime on the other hand, comparison with N-body simulations can serve to discriminate between the different approximations [128,493,389,392,96,386,31,390]. In the weakly nonlinear regime (δ < 1) the density field can be described by means of a perturbative expansion discussed in §4.1. To compare our approximations with the full perturbative expansion, we simply need to solve the equation describing spherical top-hat collapse for the different approximations and compare the resulting generating functions term–by–term with the full perturbative result given by Eqn. (144) and Eqn. (146). One can also then proceed to determine the Sn in the quasi–linear hierachy using Eqn’s. (142) & (143), which we shall do later. Let us now sumarise the results of this procedure [403]. For the straightforward Zel’dovich approximation we find τ Gδ = 1 − 3 �
�−3
− 1;
(224)
for the post–Zel’dovich approximation (PZA, see §4.4) this becomes τ2 τ Gδ = 1 − − 3 21
!−3
− 1;
(225)
and for PPZA, !−3
τ τ2 23τ 3 Gδ = 1 − − − − 1. (226) 3 21 1701 (Everywhere Gδ ≡ δsph the density contrast in the spherical top-hat model.) For the approximations formulated in Eulerian space we get: Gδ =
√ !3 2τ √ −1 sin 2τ 74
(227)
Table 2 Comparison of the hierarchical coefficients Sn for the various approximations discussed in the text. Exact ZA PZA PPZA LP FF S3
4.857
4
4.857
4.857
3.4
3
S4
45.89
30.22
44.92
45.89
21.22
16
S5
656.3
342.2
624.4
654.6
196.4
125
S6
12653
5200
11666
12568
2429
1296
for the linear potential approximation and Gδ = exp(τ ) − 1
(228)
for the frozen flow approximation. Equations (224)–(228) can be used in conjunction with equation (142) and (143) to determine νn and Sn by expanding Gδ in the vicinity of τ = 0. The values of S1 , ..S6 obtained for the five approximations we consider are listed in Table 1. One can see that taking higher and higher order terms in the Lagrangian theory leads to successively more accurate approximations. As far as the Sn are concerned, the PPZA is the most accurate of the approximations we have looked at, followed in decreasing order of accuracy by PZA, ZA, LP and FF [403]. This conclusion is further borne out by a study of the moments Tn = ~ v [403]. hθn ic /hθ2 in−1 of the scalar velocity variable θ ≡ H −1 ∇~ Notice again that the values of Sn depend also on smoothing: filtering the final density field using a top-hat filter leads to the following expressions for scale invariant spectra (P (k) ∝ k n ): for the “exact” perturbative case [283,36]: S3 = 34 −(n+3), S4 = 45.89− 62 (n+3)+ 73 (n+3)2 ; for the Zel’dovich approximation 7 3 [37], S3 = 4 − (n + 3), S4 = 30.22 − 50 (n + 3) + 37 (n + 3)2 ; (also see §4.1, §4.10). 3 For the quantity θ we get, after top-hat smoothing: for the exact perturbative (ZA) case, T3 = −Ω−0.6 [26/7 − (n + 3)]; for the Zel’dovich aproximation, T3 = −0.6 −Ω [2 − (n + 3)]. We see that the Zel’dovich approximation consistently (ZA) underestimates the skewness: for −1 < n < 0.7 T3 and T3 even have differing signs [36]. A further study of spherical top-hat collapse in the different approximations shows that ZA and its extensions are much closer to the exact solution than either FF or LP right until the time of recollapse; see Fig. (5). Evidently nonlinear approximations formulated in Lagrangian space (such as ZA, PZA etc.) are considerably more accurate in the weakly non–linear regime than those which are formulated in Eulerian space (LP, FF); see [227,78,405,38]. 75
Fig. 5. The evolution of a spherical density contrast in the different approximations is plotted against the exact analytical result. The exact solution is labelled by 1; the post-post-Zel’dovich approximation by 2; the post-Zel’dovich approximation by 3; the Zel’dovich approximation by 4; the linear potential approximation by 5; the frozen flow approximation by 6; and the linear theory solution by 7. Reproduced, with permission, from [403].
An interesting difference between the Lagrangian and Eulerian approximations discussed above is that the former are essentially single step mappings whereas the latter involve following the trajectory of a particle or fluid-element through several timesteps. This makes the former more amenable to reconstruction methods such as POTENT [413]. In the strongly non–linear regime (after shell crossing) the ZA breaks down and has to be abandoned in favour of its logical successor, the adhesion model. 76
In this regime δ >> 1 and one can no longer rely on a perturbative analysis to discriminate between the different approximation methods. The logical course to take then appears to be to test the different non–linear approximations against the results of N-body simulations assuming identical initial conditions [128,493,390,96,392]. (For a discussion of N–body methods, see §7.) The problem is that one has to be careful in choosing the correct statistical comparison between the N–body and test density fields. It is possible for an approximation scheme to produce a pattern of filaments and knots which has a very similar visual appearance to the full dynamical simulation, but has the main structures slighly displaced from their corresponding positions in the full simulation. On the other hand, one could argue that a true dynamical approximation should be able to move matter to the right place and that this statistic is therefore a reasonable test. Finding the right statistic to perform a comparison which is more specific to pattern than location is a difficult task which has not yet been fully solved. A recent comparison of non-linear approximations against the results of Nbody simulations addresses this question in some detail by choosing different statistical measures (filamentary statistics, void probability function etc. see §8) to discriminate between different approximation methods [493]. Some of the results of [493] are shown in Fig. (6). The analysis of [493] seems to indicate that local Eulerian approximations to gravitational instability such as FF and −1 LP begin to gradually√breakdown as the non-linear length scale kN L becomes comparable to R∗ = Dσ1 /σ2 – characterising the mean separation between peaks (or troughs) of the gravitational potential. The reason for this is clear, particles in FF and LP follow the gradients of the initial gravitational potential asymptotically approaching the minima of the potential in FF, and oscillating about them in LP. Neither FF nor LP takes into account the possible presence of long range modes in the gravitational potential, a fact that is used to great advantage in both AM and TZ to move particles coherently over large scales. As a result the adhesion approximation fares considerably better than FF or LP, giving results that are reasonably accurate until the non-linear length −1 scale becomes comparable to the coherence length of the potential, kN L ∼ Rφ √ (Rφ = Dσ0 /σ1 ). For models with a considerable spread of power such as CDM Rφ ≫ R∗ , and we expect the adhesion model to perform better than FF or LP at late times [493].
4.8. Relativistic Approaches Throughout this discussion we have concentrated upon Newtonian approaches to the growth of inhomogeneities. This is generally justified by the fact that one is dealing always with peculiar motions which are much smaller than the velocity light and that, in the matter–dominated regime, the relativistic effects 77
Fig. 6. A comparison of four non-linear approximations: the adhesion model (AM), the frozen flow approximation (FF), the linear potential approximation (LP), and the truncated Zel’dovich approximation (TZ), is made against the results of N-body simulations. (The simulations have been performed using 5122 particles in two dimensions. The initial conditions are scale invariant, with P (k) ∝ kn and n = 0: this corresponds to n = −1 in three dimensions.) The results of the adhesion model are shown superimposed on the results of N-body simulations. The comparison is −1 made for two distinct epochs: the panels on the left correspond to kN L ∼ R∗ and −1 the panels on the right to kN L ∼ Rφ . Reproduced, with permission, from [493].
of pressure are presumably negligible. 20 Nevertheless, there are some reasons 20
It should be pointed out that it is essential to treat petrurbations relativistically if one wishes to follow their evolution on scales larger than the Hubble radius λH ≃ ct. A gaugeinvariant treatment of density perturbations was developed in [22], subsequent discussions can be found in [169,402,337,525].
78
for considering a relativistic approach. Firstly, Newtonian theory implicitly possesses the physically disturbing property that gravitational influence is transmitted instantaneously (“action at a distance”) and thus violates causality requirements. Secondly, the biggest problem in a Newtonian treatment is posed by the need to solve the Poisson equation; this can be avoided in a relativistic treatment because, if the constraint equations of General Relativity are satisfied at early times, the evolution equations guarantee that they will be satisfied at all later times. Finally, the relativistic approach is conceptually extremely different from the Newtonian approach and the consequent difference in formal construction may lead to approximation schemes that are different from those developed from the Newtonian approach. We shall confine ourselves to brief remarks on some of the latest developments in this area. This final point is especially pertinent at the present time because of recent studies of the dynamics of self–gravitating fluid flows. Following a much earlier suggestion of Ellis [181], Matarrese et al. [372] suggested that the Einstein equations be approximated by neglecting the magnetic part of the Weyl tensor. The truncated equations thus obtained are strongly local in that they do not require any information about neighbouring spatial points to solve for the motion of any point. This approach, which has become known as the “silent universe” approach led to an exact solution of the Einstein equations and also allows various properties to be calculated numerically. It was subsequently shown that the exact solution obtained in [372] corresponds to the well–known Szekeres solution of Einstein’s equations [139], which is in fact unstable. The properties of this instability led the authors of [47] to argue that the outcome of a generic collapse would be a cigar or spindle rather than the pancake predicted by Newtonian theory. This analysis was criticised on the grounds of the validity of the approximation scheme used [319]. Further discussions and developments of this approach can be found in [373,374,90,183,48]. Although the final word has not been said, it appears that the approximation of neglecting the magnetic part of the Weyl tensor is not valid in general, but it may be a useful approach in situations admitting specific symmetries. An alternative relativistic approach to structure uses the powerful and elegant approach of Hamilton–Jacobi theory [139,483,484]. Using powerful Hamilton– Jacobi methods, they refined the analysis of Lifshitz and Khalatnikov [340] who considered a Taylor series expansion of Einstein’s equations. In fact, they consider an ’improved Taylor series’ which ensures that the 3-metric of general relativity remains positive definite. In this way, they recover the Zel’dovich approximation and its higher order generalisations. A comparison between the relativistic and Newtonian theory is now being made at higher orders. 21 Where these approaches will eventually lead is uncertain at the present time 21
The authors wish to thank Dave Salopek for a discussion on these issues.
79
but there is certainly active interest in ideas emerging from relativistic considerations and there is sure to be a substantial investment of effort in this area in the near future.
5. Non–linear Approximations based on Geometry Up to now, we have concentrated upon the evolution of denser–than–average structures as clustering develops. However, the dominant contribution to the perceived visual geometry of galaxy clustering is the nature of the underdense regions, called voids. We shall discuss the statistical characterisation of voids in more detail in §8.6. In this section we discuss various ways of trying to understand the evolution of underdensities in the gravitational instability scenario.
5.1. Void Expansion Ever since the discovery of the spectacular Bo¨otes void in 1981, successively larger redshift surveys have confirmed that most of the volume of the Universe is contained in voids – underdense regions, virtually devoid of galaxies. Voids are separated from each other by a network of galaxies, sometimes said to constitute a cellular or honeycomb structure [179,308,159,550]. Although estimates of typical void diameters vary, sizes ranging from 10 to 50h−1 Mpc have been quoted as being typical of voids in our neighbourhood [299,550,143]. The conventional picture of voids has often been to associate them with underdense regions in the primordial density field, which expand faster than their surroundings causing matter to be evacuated from within them and swept up into a shell at their periphery. The crucial role played by voids in the development of large scale structure was emphasized more than a decade ago by Zel’dovich and co–workers [577,580]. Most of the early work on voids was, however, carried out under the simplifying assumption that voids are spherically symmetric, or else belong to a regular symmetric honeycomb structure [442,250,260,193,464]. Icke’s “Bubble Theorem” [268] lends support to the idea that isolated voids can be treated as being spherical, by showing that aspherical underdense regions tend to become spherical in time – the time reversal of the well–known Lin, Mestel & Shu instability [343]. The bubble theorem [107,188,271,40,54] has since been verified using numerical simulations 22 . 22
It should be pointed out that voids in an ensemble compete with each other for space as they expand, and therefore need not remain spherical. Consequently, the bubble theorem, which is true for individual isolated voids, does not necessarily hold for a more realistic set of initial conditions [476,14].
80
Although most treatments of void evolution have been within a Newtonian framework, attempts to model voids within a fully general–relativistic framework have also been undertaken [358,495,357,496,332,453,454,416,71,108]; the study of voids has been extended to include models with a cosmological constant [367]. Theoretical modelling of individual voids has largely dealt with voids that are either compensated by an overdensity at the void boundary, leading to a vanishing overall density contrast, or without any such compensation. In the latter case, the overall density contrast is negative. Such uncompensated voids are often modelled by a spherical top-hat in which the density is constant within a spherical region. A common feature of both compensated and uncompensated void models is the gradual appearance of narrow overdense ridges surrounding voids. Such ridges arise because matter lying close to a void center tends to expand faster than that near the edges and thus overtakes denser matter lying ahead of it, resulting in shell crossing and the piling up of material at the periphery of voids. The initial density distribution in compensated and uncompensated voids is shown in Figure (7). The void has initial radius Ri and underdensity δi (at a time ti ), and is surrounded in the case of a compensated void by an overdense shell of radius αRi (α > 1). Examining the dynamical behaviour of both compensated and uncompensated voids, Bertschinger [40] found several families of self–similar solutions in which the expansion of the void at late times could be described solely in terms of dimensionless quantities: α, δi , r/Ri and t/ti . These solutions are similar in form to the Sedov similarity solutions describing a point explosion in a uniform medium [503,502,270]. In the case of a collisionless fluid, such as non–baryonic dark matter, the expansion of the void is accompanied by a transfer of energy from the interior of the void onto the peripheral shell. This leads to shell– crossing and collisionless phase–mixing which leads to the development of a self–similar solution which has no memory of the initial conditions. On the other hand, if the material is collisional (e.g. baryons), shell–crossing is prevented by the formation of shock waves. The subsequent dissipation of kinetic energy into heat leads to the eventual wiping out of memory of the initial conditions, and the development of a (different) self–similar solution describing the propagation of the shock front. In both collisional and collisionless cases the void boundary expands as λ ∝ t4/5 . In the collisional case the swept–up mass of the compensated shell increases as t2/5 . Bertschinger also found similarity solutions for uncompensated voids embedded in (a) collisionless, (b) collisional and (c) a mixture of collisional and collisionless media [40]. In all cases a dense shell forms around the void whose swept–up mass grows as t2/3 and whose expansion rate is λ ∝ t8/9 . This is 81
Fig. 7. The initial density profile of a void. The solid line corresponds to the radial density distribution of an uncompensated void, and the dashed line to the boundary shell of a compensated void. Adapted, with permission, from [40].
somewhat faster than the case of a compensated void; see also [496,39]. It is often argued that, since the density of matter within a void is always bounded by |δ| ≤ 1, one can therefore expect linear theory to be valid for a much longer duration within voids than is the case for overdense regions. This is not strictly the case, however. According to linear theory the density contrast within an underdense region scales as δ ∝ −a(t) (in a flat Universe), whereas in reality the void underdensity must be constrained to have a magnitude less than unity. The result of this is that linear theory greatly overestimates the expansion rate of voids; see Figure (8). We have also taken the opportunity to show, in Figure (8), the behaviour of the underdensity in different non– 82
Fig. 8. The underdensity in the spherical top-hat model estimated from different approximations, plotted against the exact solution. The exact solution is the solid line; the Zel’dovich approximation is ZA; the linear or frozen–potential approximation is FP; the frozen–flow approximation is FF; linear theory is LIN.
linear approximations which we discussed in the previous section. All these approximations tend to underestimate the density contrast. Studies of individual voids, although they clearly provide important clues about the dynamical behaviour of underdense regions, do suffer from the fact that they tend to ignore the presence of neighbouring voids. Such studies need therefore to be supplemented by other approaches which model voids as part of a larger ensemble of voids of different shapes and sizes. We shall discuss two such approaches here: the Voronoi model, which is based on geometric arguments, and the adhesion model, which we discussed in §4. The statistical 83
Fig. 9. Stereoscopic pair of three Voronoi cells sharing a common boundary. Stars indicate the Voronoi nuclei. Reproduced, with permission, from [542].
characterisation of voids using the void probability function is discussed in §8.6. 5.2. The Voronoi Foam In the Voronoi model, the large–scale structure of the Universe (voids, clusters and superclusters), is described by a geometrical skeleton of walls, filaments and nodes which together constitutes a Voronoi foam [552]. The Voronoi foam is constructed as a tesselation, a mathematical partioning of space into three–dimensional polyhedral units (polygons in two dimensions). 84
Adjoing polyhedra share common walls, edges and vertices; see Figure (9). The tesselation is contructed around and contains that part of the space which is nearer to its nucleus than any other nucleus. The resulting tesselation (which is unique) is called the Voronoi tesselation. The physical motivation for the Voronoi model is the observation that voids will tend to expand more quickly than surrounding material. As a result, matter tends to flow out of voids and will generally become trapped in wall–like regions between adjacent voids. An additional assumption that is usually made in the case of the Voronoi model is that all voids expand at the same rate, so that walls separating neighbouring voids will in general form the perpendicular bisectors of the line joining the centers of void expansion [269]. Intersections of walls define regions of higher density (filaments) and intersections of filaments define zero–dimensional subunits (nodes). Matter in the Voronoi model is taken to flow out of voids onto walls, then along walls into filaments and finally into the nodes which are the vertices of the Voronoi polyhedra. The mathematical prescription used for constructing a Voronoi foam – the Voronoi tesselation – has been applied in fields as diverse as metallurgy, geology, forestry, molecular physics and astronomy [394,305,395,526]. The first practical implementation of the idea in studies of large–scale structure was made by van de Weygaert & Icke [542], who used the Voronoi model to mimic cluster correlations by identifying each Voronoi node in their simulations with a cluster of galaxies; see also [269,377]. Their basic prescription to construct the Voronoi skeleton was as follows: a set of randomly (Poisson) distributed points were chosen to designate the Voronoi nuclei, the centers of void expansion. The number density of nuclei is the only free parameter in this model. Knowing the number–density of nuclei, one can construct the tesselation using either a kinemetical or geometrical approach. The geometrical approach is particularly simple to follow in two dimensions, since the basic structural units are then just filaments and nodes. A filament always bisects the line joing two neighbouring Voronoi nuclei. The end–points of a filament are nodes. Every node marks the termination of exactly three filaments. One can construct a Voronoi tesselation starting from any given Voronoi nucleus, and following one of the filaments that surround it in either a clockwise or an anti–clockwise direction until the filament terminates in a node. The next filament bordering the same cell is then chosen and followed until it also ends. This procedure is repeated until one ends up back at the original node. Repeating this procedure for all the Voronoi nuclei in a given sample, leads easily to the Voronoi tesselation [568,567]. The geometrical method described above is relatively easy to apply in two dimensions but acquires considerable complexity in higher–dimensional spaces. The kinematic approach, on the other hand, can easily be generalised to an
85
arbitrarily large number of spatial dimensions. The gist of the kinematic approach is that test particles are used to trace the Voronoi foam. The following procedure is adopted by van de Weygaert & Icke [542]: a test particle is chosen so that it is initially located close to a (randomly–chosen) nucleus, called the parent nucleus N1 . The particle is then given a velocity which is proportional to its distance from the nucleus and directed radially away from it, so that ~v = ~x1 − ~r1 .
(229)
The particle is assumed to be located at ~x1 and the nucleus at ~r1 . The motion of the particle is modified by means of an interative procedure: ~x1 → ~x1 +~v ∆t, until the particle becomes closer to another nucleus N2 (located at ~r2 ) than it is to its parent nucleus. At this point the test particle would have crossed a cell wall and would now be located just inside the cell defined by the nucleus N2 . When the particle is equidistant from the two nuclei, it is constrained to move only within the cell wall, thus staying equidistant from both nuclei, until it becomes closer to a third nucleus N3 than the previous two, indicating that it has entered a third cell by crossing a filament which (in three dimensions) forms at the intersections of three cells defined by the nuclei N1 , N2 , N3 . The particle is now constrained to move along the filament by modifying its motion: ~v → (~vfˆ)fˆ, fˆ = n ˆ 13 × n ˆ 12 ; ~r1 − ~r3 ~r1 − ~r2 n ˆ 13 = , n ˆ 12 = ; |~r1 − ~r3 | |~r1 − ~r2 |
(230)
fˆ is the unit vector along the filament. (The vectors n ˆ 13 and n ˆ 12 are normal to walls defined by the nuclei N1 N2 and N1 N3 respectively.) The particle moves along the filament until it is closer to a fourth nucleus N4 . The location of the particle at this juncture is close to a node, i.e. it is equidistant from four nuclei. After this, the particle does not move any further because it has traced out the locations of all the basic structural units in the vicinity of the parent nucleus N1 [542]. Repeating for all nuclei leads to a Voronoi tesselation. An excellent recent discussion of the construction of three dimensional Voronoi tesselation’s can be found in [545]. As mentioned earlier, the only free parameter in the Voronoi foam model is the mean number–density of Voronoi nuclei which can, in principle, be determined by normalising it to astronomical observations. Making the assumption that the nodes in the Voronoi simulation can be identified with Abell clusters of richness class R ≥ 1, van de Weygaert & Icke [542] were able to determine the inter–nuclear separation to be ≃ 104h−1 Mpc 23 Interestingly, one can then 23
The number–density of Abell clusters is assumed to be 6×10⁻⁶ h3 Mpc−3 ; when compared with the ratio of nodes to nuclei in a Voronoi tesselation (6.733:1), this gives the number– density of nuclei.
86
Fig. 10. A two–dimensional Voronoi foam constructed with clustered nuclei.
find the form of the two–point correlation function of the clusters (i.e. Voronoi vertices) to be � �−γ r ξ(r) = , (231) r0 with r0 = 32h−1 Mpc and γ = 1.97 which is quite close to the observational results for the cluster–cluster correlation function (§8.2) [17,16]. However, as we discuss in §8, more recent analyses of cluster correlations have indicated that the clustering scale could be much smaller than the original Bahcall– Soneira claim: r0 ≃ 14h−1 Mpc. This is a potentially serious problem for the Voronoi model with unclustered nuclei [531,532]. From a mathematical viewpoint the Voronoi tesselation around randomly– distributed nuclei is appealing because of its simplicity and because many 87
analytical results are known about the statistical properties of the tesselation in this case [396]. However, if the Voronoi model is to provide a useful approximation to physical processes that resulted in the formation of large– scale structure, the Voronoi nuclei must be associated with some physically– significant spatial locations. In models of structure formation based on explosions, Voronoi nuclei can be associated with detonation sites, provided all explosions have equal strength and all the explosions occur at the same time. The arrival of two shock fronts in the same place will result in the formation of a Voronoi wall. Three shocks will lead to filaments and four to nodes. Furthermore, since there is no a priori prescription exists for the explosion sites it is quite reasonable in this case to take them as being randomly distributed [558,562,567]. On the other hand, in more conventional models structure formation proceeds by gravitational instability, a process which generically leads to the formation of a cellular structure [388]; see §4. In order to apply the Voronoi idea to this case, one might associate Voronoi nuclei with centers of the primordial underdensities or peaks of the primordial gravitational potential which are the progenitors of voids [322,476]. However, in most scenarios of structure formation the gravitational potential is spatially distributed in the manner of a Gaussian random field. Since peaks of a Gaussian random field are clustered, it seems a proper application of the Voronoi technology in this case must involve a clustered distribution of nuclei. This inevitably introduces more freedom into the model through the introduction of parameters needed to describe the clustering; see Figure (10). Although we have assumed for simplicity that expansion rates in different underdensities are identical, this is also not going to be strictly correct. A study of voids performed using the adhesion model demonstrates that void expansion rates generally depend on the size of the gravitational potential fluctuation inside them [476]. One might therefore seek to modify the Voronoi idea by assigning different weights to Voronoi nuclei, in order to incorporate this variation of expansion speeds. The simplest tesselation which includes such an effect is called the Johnson–Mehl tesselation [278]. As we shall see, this closely resembles the geometrical structure obtained by evolving with the adhesion approximation. A Johnson–Mehl tesselation will also describe an explosion model in which the explosions have varying degrees of intensity. In the Johnson–Mehl tesselation, walls joining adjacent nuclei are not planes and do not bisect the line joining the nuclei. Although it is more difficult to construct using simple geometrical arguments, it can be easily generated using a variation on the kinematical approach discussed above. It can also be constructed using the adhesion approximation, as described in the next section.
88
5.3. The Adhesion Approximation Revisited We saw in §4.5 how the adhesion approximation provides a simple geometrical way to determine the masses and momenta of “knots”. It also furnishes an elegant prescription for finding the volumes of void regions. This prescription involves dividing Lagrange space into stuck and free regions by means of the following procedure. The status of a particle originally located at ~q0 can be determined by descending a paraboloid P (~x, a; ~q) = (~x − ~q)2 /2a(t) + h onto the linear gravitational potential φ0 , in such a manner as to be tangential to the potential at ~q0 ; see Figure (11). If the paraboloid touches or intersects the potential at a point other than ~q0 then the particle in questions has already entered a caustic, otherwise it has not. Using this procedure, we can divide Lagrangian space at any time into stuck and free regions. Stuck regions correspond to particles already in caustics, whereas free regions have not yet shell-crossed and are therefore still expanding via the Zel’dovich relations, equations (160) & (164), and correspond to voids [456,488,476]. The location of caustics in Eulerian space can be found very simply by moving the border between stuck and free Lagrangian regions by means of the Zel’dovich approximation [476]. In Figure (12) and Figure (13) the location of caustics (filaments and knots) is shown superimposed upon pictures of stuck and free regions. At early times, most particles have not yet fallen into pancakes, so that the resulting free regions percolate in Lagrangian space, whereas stuck regions do not; Figure (12). At late times the situation is reversed since most of the matter is now in caustics, so that stuck regions percolate whereas free regions exist as isolated regions; Figure (13). The percolation of stuck and free Lagrangian regions is closely related to the issue of the global topology of large–scale structure, i.e. whether it is bubble–like or sponge-like; a discussion of this issue can be found in §8.8 and in ref. [478]. This procedure so far has given us the volume of voids in Lagrangian space. In order to obtain their volume in Eulerian space (or real space) we apply the volume deformation formula obtained from the Zel’dovich approximation: dVe = dVl [1 − a(t)λ1 (~q)][1 − a(t)λ2 (~q)][1 − a(t)λ3 (~q)],
(232)
where dVe and dVl are the volume elements in Eulerian and Lagrangian space respectively. Summing over all elementary volume elements within a given Lagrangian space void now gives us the volume of the void in Eulerian space: Ve =
X
dVe =
N X i=1
dVl (i)[1 − a(t)λ1 (~q)][1 − a(t)λ2 (~q)][1 − a(t)λ3 (~q)], (233) 89
Fig. 11. The geometrical prescription of the adhesion approximation. A paraboloid is descended onto the gravitational potential in order to demarcate stuck and free Lagrangian regions. The peaks of the potential correspond to voids in the Zel’dovich approximation. The particle having Lagrangian co–ordinate ~q0 is free in the uppermost figure, and has just entered a caustic in the middle figure. The apex of the paraboloid, ~x, describes the location of the caustic (clump with mass m) in Eulerian space. Middle and lower panels illustrate the merger of clumps. Adapted, with permission, from [476].
where N denotes the number of elementary free volume elements in a given Lagrangian–space void. This quasi–analytic method is very simple and can be used to obtain the spatial distribution and sizes of individual voids, as well as the integrated void spectrum [476]. We would like to mention at this point that voids defined according to the 90
Fig. 12. The distribution of caustics (dots) is plotted superimposed upon stuck (unshaded) and free (shaded) Lagrangian regions for early times when cellular structure is just beginning to form. The distribution of caustics in this case was obtained by moving the border between stuck and free regions using the Zel’dovich approximation. Reproduced, with permission, from [476].
adhesion model constitute a subclass 24 of voids defined in the Zel’dovich approximation. This follows from the fact that in the Zel’dovich approximation, a necessary and sufficient condition for the existence of underdense regions is that all eigenvalues of the deformation tensor are negative. This is not the case 24
Similarly, voids in the Zel’dovich approximation constitute a subclass of voids defined according to linear P theory. This can be seen from the fact that linear theory voids satisfy the inequality i λi < 0 (which follows trivially from the Poisson equation (20)). Zel’dovich voids, on the other hand, satisfy a more restrictive class of initial conditions λ1 , λ2 , λ3 < 0, which follows from the requirement dVE > dVL in equation (232).
91
Fig. 13. The distribution of caustics (dots) is plotted superimposed upon stuck (unshaded) and free (shaded) Lagrangian regions for late times when most of matter is already in caustics and cellular structure is fully formed. Reproduced, with permission, from [476], where details of the simulations are provided.
in the adhesion approximation. The reason for this is that the adhesion approximation is inherently non–local. One can see in Figure (11) that a region which is declared a void at an earlier epoch is no longer one at a later epoch when it has merged with two neighbouring large voids. Thus not all peaks act as void progenitors at all times. This example also underlines an important feature of non–linear gravitational instability. This is that the evolution of small voids is prone to the tidal influence of surrounding larger voids, which can cause the void to shrink and even disappear. The disappearance of small voids in the course of cosmological evolution is accompanied by a flow of power from small scales to larger scales, as illustrated in Figure (14) [301,321,14,476]. 92
Fig. 14. The void spectrum (number fraction of voids as a function of diameter) is shown for the truncated power–law spectrum P (k) ∝ k for k < kc ; P (k) = 0 for k ≥ kc where kc = 16 × kf and kf is the fundamental mode of the box. The figures from top to bottom correspond to three different expansion epochs described by the scale factor a. (The scale factor a is also just the linear density contrast on the grid scale.) Reproduced, with permission, from [476].
For scale invariant spectra P (k) ∝ k n , −1 ≤ n < 1, this results in the following 2/(n+3) late time growth law for the mean void diameter: Dvoid ∝ D+ (t), where D+ (t) is the growing mode of the linear density contrast [238,476]; recall that D+ ∝ a(t) if the Universe is spatially flat and matter–dominated. An interesting feature to emerge from studies of voids performed using the adhesion approximation is that the sizes of voids tend to be strongly correlated with the height of the primordial gravitational potential at void centers 93
Fig. 15. The value of the normalised primordial gravitational potential φ/φrms evaluated at the centers of voids (in Lagrangian space) is shown plotted against the void diameter for the COBE normalised CDM spectrum. Reproduced, with permission, from [476].
(defined in Lagrangian space), with larger voids originating from those regions where the initial potential is higher; see Figure (15). However, voids will not in general have a one-to-one association with high peaks in the potential simply because complicated features in the primordial potential – ridges, saddle–points, etc. – can sometimes lead to the formation of voids in those regions where the potential does not have a well defined maximum [476]. At late times, voids in Lagrangian space occupy a negligible fraction of the total volume, and it is straightforward to implement the adhesion approximation by considering only the maximum value of the gravitational potential 94
Fig. 16. The adhesion approximation at late times – the “needle approximation”.
in separate localised regions (Lagrangian–space voids) as the progenitors of structure. We call this the “needle approximation” since the gravitational potential is effectively replaced by a set of discrete vertical needles on which the paraboloid is moved in order to map out the skeleton of the large–scale structure; see Figure (16). The location of the needle is similar in many respects to the location of the Voronoi nuclei, and indeed the needle approximation gives a spatial geometry which is in many respects equivalent to a Johnson–Mehl tesselation. An important characteristic of the adhesion model, which is not shared by most approximation schemes, is that it constructs a skeleton that evolves dynamically with time. This can be expressed in geometrical language by 95
saying that the paraboloid mapping the large–scale distribution surveys larger and larger regions of the gravitational potential as the Universe evolves. It can therefore describe such dynamical processes as the merger of knots and the disappearance of small voids, which is not possible in an approach which is manifestly local in construction such as the Zel’dovich approximation. It is also clear that if all peaks of the gravitational potential were taken to have equal heights, the skeleton of large–scale structure would freeze at late times in the adhesion framework. The adhesion approximation would in this case be entirely equivalent to a Voronoi tesselation, performed using the local maxima of the gravitational potential as sites for the Voronoi nuclei. Studies of voids have also shown that they can be populated by substructures, such as mini–Zel’dovich pancakes and filaments, which run through voids bounded by larger pancakes [476,544]. The likelihood of a void being populated by substructure increases with its size at a given time, and decreases with time because voids get emptier as they evolve. Interestingly, evidence for substructure within existing large voids has been reported for both the Bo¨otes void [561] and for voids in the CfA survey [425].
6. Statistical Solutions and Scaling Arguments In this section we discuss methods for obtaining statistical information about non–linear clustering in an analytical approach. In these approaches, one abandons the idea of covering the evolution of individual fluid elements and concentrates instead upon global statistical properties like the correlation functions. Even with this simplification, analytical progress is difficult and one normally has to resort to further approximations. This normally involves the assumption of some form of scale–invariance (for which there is some evidence from the observed properties of the galaxy distribution; Sec 8).
6.1. Scaling model for the Correlation Function We begin with a simple model for the evolution of the two–point covariance function of the matter fluctuations which was first suggested and studied in [247] for the case where Ω = 1. The simplest way of understanding this model is by reference to the spherical collapse model we discussed in §3.1. Recall that, in the case where Ω = 1, a spherical inhomogeneity virialises at an actual density contrast of order around 100 at a time when the density contrast predicted by linear theory would be of order unity. Now the two–point covariance function of the matter fluctuations is, roughly speaking, the ‘average’ profile of a spherical clump. Assuming that collapse occurs when the integrated overdensity reaches 96
some critical value, it seems that the relevant quantity to deal with should be the volume–averaged correlation function, defined by ¯ = 3 ξ(r) r2
Zx
ξ(x)x2 dx.
(234)
0
A density enhancement of a factor 1 + δ may be thought of as arising through a spherical collapse by a factor (1 + δ)1/3 in radius so one could further expect a given integrated non–linear correlation on a scale rN L to have arisen from linear fluctuations on a scale rL in the initial conditions: rL = 1 + ξ¯N L (rN L ) h
i1/3
rN L .
(235)
We must now conjecture that the non–linear integrated correlation function is a universal function of the linear one, after taking account the change of scale: ξ¯N L (rN L ) = f [ξ¯L(rL )]. (236) The success of this approach depends upon finding the appropriate function f which should be independent of the form of the initial power spectrum (or, equivalently, correlation function). We can see quite easily that, for small x, the function f (x) should be f (x) ≃ x to reproduce linear theory. The spherical collapse model further suggests that f (x = 1) ≃ 100. If we assume that at large x the fluctuations enter a period of stable clustering [440], we should get ξN L ∝ a3 . But the linear covariance function scales as a2 . Asymptotically, therefore, we have f (x) ∝ x3/2 for large x. In between these two extremes, one can calibrate the observed behaviour of ξ¯ against numerical simulations and find a fitting formula for the intermediate range of scale [247]. Remarkably, it does appear that a scaling formula of the form (236) does indeed exist that satisfies the two asymptotic limits: f (x) =
x + 0.358x3 + 0.0236x6 . 1 + 0.0134x3 + 0.00202x9/2
(237)
A generalisation of this formula to non–flat universes and models with a cosmological constant has been given in [431], who also showed how to apply similar techniques to the evolution of the power spectrum rather than the correlation function; it has also been discussed from a theoretical point of view in [411].
6.2. Statistical Mechanics: the BBGKY hierarchy To obtain a more detailed statistical description of a non–linear self–gravitating system requires a much more sophisticated approach than that above, and this 97
leads us into a treatment based on statistical mechanics. The pioneering investigation by Davis and Peebles [150] into the hierarchical closure of the BBGKY equations is of such historical importance in the understanding of non–linear gravitational clustering that we will discuss it here in some detail. We begin with some basic statistical mechanics. Consider a (classical) system of N particles, interacting with each other via two–body forces described by a potential φ(~xi , ~xj ), where ~xi is the position of the i-th particle (i = 1, . . . N). We take the particles to be identical, so the Hamiltonian for the system is symmetric under interchange of particle positions; the potential is taken to be a function only of the particle separations: φi,j = φ(~xi , ~xj ) = φ(|~xi − ~xj |). The phase–space for this system is 6N–dimensional, denoted by Γ = γ1 ⊕ γ2 . . . ⊕ γN where γi is a one–particle phase space. The system is described by a point in the phase–space Γ; let the probability density function (pdf) of this point be PN . The evolution of PN is governed by Liouville’s equation: ∂PN X ∂PN ∂PN X + = 0. + ~ai · ~vi · ∂t ∂~xi ∂~vi i 0.86. For discussion of this method, including sampling problems and more detailed percolation statistics, see [577,505,50,158,272,312,509]. There is some degree of consensus in the literature that the percolation method 135
is not very successful at discriminating between the kind of data and theoretical models involved in cosmology. For example, HDM and CDM models which both have b∗ ≃ 0.65. To some extent, however, this conclusion refers not so much to the percolation method itself, but to the attempt to encode all the properties of the percolation process in one single parameter b∗ . Since the critical percolation threshold is determined by the size of the largest structures in the simulation box, one might have expected this not to be a very sensitive discriminant. A more detailed analysis might well prove more successful. For example, consider what happens as the percolation radius is increased. In the beginning, one has a large number of isolated clusters. As the radius is increased, these tend to merge together producing a smaller number of larger clusters some of which may be highly elongated. Eventually, when percolation occurs, one cluster is the size of the simulation box, but there may be other clusters remaining which are smaller than this biggest one. In a refinement of the percolation method Klypin & Shandarin [312] have shown that two parameters are very sensitive diagnostics of the way percolation proceeds: the size of the largest cluster (as a function of b) and the mean cluster size (excluding the largest one). Instead of using one number to characterise the onset of percolation, one therefore uses two functions which describe different aspects of the process. It remains to be seen whether this can be a useful technique in practice. Various statistics have been suggested to search for specifically filamentary signatures in the galaxy distribution. Kuhn and Uson [325] suggested one should use the mean misalignment angle between consecutive steps of a self– avoiding random–walk through the distribution. It seems that the effect of Poisson noise and sample errors is to easily de-rail the walk from a filament so the method is of limited usefulness. A similar problem besets the ridge– finding algorithm [397]: just one spurious galaxy position can alter the results markedly, so the algorithm is insufficiently robust for realistic data sets. A more promising approach is to use the quadrupole moment of the galaxy distributions [200,548], or structure functions derived from the moment of inertia tensor of the distribution [13] which are described below. Consider a set of Nk particles located within a radius Rk of a randomly chosen k th particle. Let xαj (α = 1, 2, 3) denote the position vector of the j th particle relative to the k th particle in this ensemble. One can construct the first and second “moments” of the distribution of particles located within a distance R of the k th particle: Nk 1 X Mkα (R) = xα , (313) Nk j=1 j Mkαβ (R) =
Nk 1 X xα xβ . Nk j=1 j j
(314)
One can then define the local moment of inertia tensor about the centre of 136
mass of each particle by Ikαβ (R) = Mkαβ (R) − Mkα (R)Mkβ (R)
(315)
and its average N 1 X I αβ (R), (316) N k=1 k where N denotes the number of centers used in carrying out the average.
I αβ (R) =
Diagonalising I αβ (R) we determine its eigenvalues I1 , I2 , I3 (arranged in decreasing order of magnitude) and the ratio’s I2 ν= I1 �
� 21
I3 µ= I1 �
;
� 12
.
(317)
The structure functions S1 , S2 , S3 are then defined as follows [13] π S1 = sin (1 − ν)p 2 �
�
(318)
π S2 = sin a(µ, ν) 2� � πµ . S3 = sin 2 where p = log 3/ log 1.5, a(µ, ν) is given by solving the equation �
�
ν2 µ2 − = 1, a2 a2 (1 − αa1/3 + βa2/3 )
(319) (320)
(321)
the parameters α and β are α = 1.9; (322) 7 1/3 9 + α31/3 . (323) β=− 8 These somewhat involved definitions ensure that 0 ≤ Si ≤ 1 for all i. Thus (S1 , S2 , S3 ) = (0, 0, 1) for a sphere; (S1 , S2 , S3 ) = (0, 1, 0) for a flat sheet; (S1 , S2 , S3 ) = (1, 0, 0) for a filament. Intermediate values of Si indicate the departure of a structure from its eikonal shape: sphere, pancake or filament. For details see [13]. � �
A related measure, also constructed out of the moment of inertia tensor is the Vishniac quadrupole statistic [200,548] Qk (R) = and
2
P
α,β
Mkαβ Ikαβ − �P
P
α
γγ γ Mk
Mkαα
�2
N 1 X Qk (R), Q(R) = N k=1
137
P
β
Ikββ
,
(324)
(325)
where N is the number of centres chosen in carrying out the average. The statistic Q(R) always lies in the range [0, 1]. It attains its maximum value Q = 1 for a straight line passing through the centre, and is zero for a uniform distribution of points. A comparison of Q and the structure functions S1 , S2 , S3 is discussed in [436]. Applications of Q to study the growth of filamentarity during gravitational clustering are discussed in [412,493]. These techniques, although robust, can still be confused at low signal-to-noise levels [412,493]. One way to improve their performance might be to enhance the filamentary pattern before trying to quantify its existence with some numerical statistic. This might be accomplished by determining Si and Q for regions of a specified overdensity [494]. Another way would be to preprocess the data by constructing the minimal spanning tree (MST) of the set of points [436]. The MST is a geometrical construction which owes its origins to graph theory. Consider a distribution of points (say, galaxies) in three-dimensional space. One can define a graph on this set to be a collection of nodes (galaxies) and edges (lines joining galaxies). The degree of a node is the number of edges which emerge from it; a sequence of edges joining nodes is called a path; a closed path is a circuit; if any two nodes within a graph have at least one path connecting them then such a graph is said to be connected. A connected graph which has no circuits is called a tree; if a tree contains all the nodes within a graph then it is a spanning tree. The minimal spanning tree of a data set is the tree whose total edge length is the smallest. (A tree is said to be unique if no two edge lengths within it are equal.) It is sometimes convenient to modify the MST of a data set in order to eliminate accidental linkages which can be quite common if the data set is noisy. One way of doing this is by the operations of pruning and separating which are illustrated in Figure (20) and are carried out as follows: we define a k branch to be a path of k edges connecting a node of degree 1 to a node of degree exceeding 2, in such a way that all intervening nodes are of degree 2. A MST is said to be pruned to a level p if all k-branches with k ≤ p have been removed. Pruning serves to remove extraneous ‘foliage’ on the MST which is not directly related to the main structure of the pattern. One can also separate a tree by removing any edges whose length exceeds some cut-off scale l0 usually defined in terms of the mean length of edges in the MST < l >. Separation tends to minimise ‘accidental’ linkages, the tree after separation consists of several disjoint pieces which can be analysed further. An advantage of the MST is that it emphasises filaments embedded in background noise thus enhancing the signal-to-noise ratio in any quantitative statistic such as the structure functions S1 , S2 , S3 and Q [436]. A simple algorithm of constructing the MST, the so–called Greedy Algorithm, is described in [27].
138
Fig. 20. The Minimal Spanning Tree used to enhance structure in a clustered point set. The diagram (a) shows a diagrammatic set of points in two dimensions; (b) shows the MST of the set (a); (c) shows the result of pruning – all nodes of degree one connected to nodes with degree exceeding two have been removed; (d) a separated, pruned tree – all edges of (c) exceeding a certain critical length have been removed. Adapted, with permission, from [27].
8.8. Topological Descriptors Interesting though the geometry of the galaxy distribution may be, such studies do not tell us about the topology of clustering. Or, in other words, its connectivity. One is typically interested in the question of how the individual filaments, sheets and voids join up and intersect to form the global pattern. Is the pattern cellular, having isolated voids surrounded by high–density sheets, 139
or is it more like a sponge in which under– and over–dense regions interlock? Looking at ‘slice’ surveys gives the strong visual impression that we are dealing with bubbles; pencil beams perhaps re-inforce this impression by suggesting that a line–of–sight intersects at more–or–less regular intervals with walls of a cellular pattern. One must be careful of such impressions, however, because of elementary topology. Any closed curve in two dimensions must have an inside and an outside, so that a slice through a sponge–like distribution will appear to exhibit isolated voids just like a slice through a cellular pattern. It is important therefore that we quantify this kind of property using well–defined topological descriptors. The problem of quantifying the topology of large–scale structure has been discussed in the literature for many years [161,508]. More recently, in an influential series of papers, Gott and collaborators [220,246,222,383] have developed a particular method for doing just this. We shall not discuss this approach in much detail, because of the existence of an extensive review of this work by Melott [383]. Briefly, the method makes use of a topological invariant known as the genus, related to the Euler–Poincar´e characteristic, of the iso–density surfaces of the distribution. To extract this from a sample, one must first smooth the galaxy distribution with a filter (usually a Gaussian is used) to remove the discrete nature of the distribution and produce a continuous density field. By defining a threshold level on the continuous field, one can construct excursion sets (sets where the field exceeds the threshold level) for various density levels. An excursion set will typically consist of a number of regions, some of which will be simply connected and others of which will be multiply connected. If the density threshold is labelled by ν, the number of standard deviations of the density away from the mean, then one can construct a graph of the genus of the excursion sets at ν as a function of ν: we call this function G(ν). The genus can be formally expressed as an integral over the intrinsic curvature K of the excursion set surfaces, Sν by means of the Gauss - Bonnet theorem: 4π [1 − G(ν)] =
Z
K dA,
(326)
Sν
where the integral is taken over each compact two–dimensional surface in the excursion set. Roughly speaking, the genus for a single surface is the number of handles the surface posesses; a sphere has no handles and has zero genus, a torus has one and therefore has a genus of one. For technical reasons to do with the effect of boundaries, it has become conventional not to use G but GS = G − 1 [222]. In terms of this definition, multiply connected surfaces have GS ≥ 0 and simply connected surfaces have GS < 0. To compute topological properties of discrete data sets, it is usually convenient 140
Fig. 21. A polyhedral torus. This figure is adapted from [383].
to work with the discrete analogue of equation (326) which is easy to derive once we note that the curvature of a discrete surface is localised in each of its N vertices so that K(x) ≃ Di δ(x − xi ) (327)
where Di is the deficit angle evaluated at the ith vertex of a polyhedral surface. Substituting equation (327) in equation (326) we obtain 4π [1 − G(ν)] =
N X
Di
(328)
i
which is the required analog of equation (326). To see how equation (328) can be used to determine the genus of a compact 141
polyhedral surface, let us consider the simple but illustrative example of a torus shown in figure (21). All the curvature of the polyhedral torus is concentrated P in each of its 16 vertices, the deficit angle at each vertex being Di = 2π− i Vi , P where i Vi is the sum of the vertex angles around a given vertex. Thus, each of the outer eight corners of the torus contributes a positive deficit angle: Di = 2π − 3π/2 = π/2, whereas each of the eight inner corners of the torus will contribute a negative deficit angle Di = 2π − 5π/2 = −π/2. The sum P total of all the deficit angles is therefore 16 i=1 Di = 8 × π/2 − 8 × π/2 = 0, implying G = 1 for a torus. (A numerical algorithm for determining the genus of a two or three-dimensional discrete manifold is given in [383].) One of the great advantages of using the genus measure to study large scale structure, aside from its robustness to errors in the sample, is that all Gaussian density fields have the same form [161,6,246] of GS (ν): �
GS (ν) = A 1 − ν
2
�
ν2 exp − . 2 !
(329)
This means that if one smooths the field enough to remove the effect of non– linear displacements of galaxy positions, the genus curve should look Gaussian for any model evolved from Gaussian initial conditions, regardless of the form of the initial power–spectrum, which only enters through the normalisation factor A in Eqn. (329). This makes it a potentially powerful test of non–Gaussian initial fluctuations, or models which involve non–gravitational physics on large scales to form large–scale structure. The observations support the interpretation of Gaussian initial conditions, although the distribution looks non–Gaussian on smaller scales. The nomenclature for the non– Gaussian distortion one sees is a ‘meatball shift’: non–linear clustering tends to produce an excess of high–density simply–connected regions, compared with the Gaussian curve. What one would expect to see in the standard picture of gravitational instability from Gaussian initial conditions, is therefore a ‘meatball’ topology when the smoothing scale is small, changing to a sponge as the smoothing scale is increased. This is indeed what seems to be seen in the observations; an example is shown in Figure (22). The smoothing required also poses a problem, however, because present redshift surveys sample space only rather sparsely and one needs to smooth rather heavily to construct a continuous field in the first place. A smoothing on scales much larger than the scale at which correlations are significant will tend to produce a Gaussian distribution by virtue of the central limit theorem. The power of this method is therefore limited by the scale of smoothing required which, in turn, depends on the space–density of galaxies. This is a particular problem in a topological analysis of the QDOT redshift survey [398]. Topological information can also be obtained from two–dimensional data sets, whether these are simply projected galaxy positions on the sky (such as the 142
Fig. 22. The genus curve is shown for galaxies in the CfA, a small shift towards meatball-like topology is discernable. Reproduced, with permission, from [222].
Lick map, or the APM survey) or ‘slices’, such as the various CfA compilations [159]. There are some subtleties, however. Firstly, as discussed above, two–dimensional information topology does not distinguish between ‘sponge’ and ‘swiss–cheese’ alternatives. Nevertheless, it is possible to assess whether, for example, the mean density level (ν = 0) is dominated by underdense or overdense regions so that one can distinguish swiss–cheese and meatball alternatives to some extent. The topological quantity usually discussed in two– dimensional work is the Euler–Poincar´e characteristic Γ of the excursion sets, which is roughly speaking the number of disjoint regions minus the number of holes in such regions. This is analogous to the genus, but has the interesting property that it is an odd function of ν for a two–dimensional Gaussian random field, unlike G(ν) which is even. In fact the mean value of Γ per unit 143
area takes the form �
�
hΓ(ν)i = Bν exp −ν 2 /2 ,
(330)
where B is a constant which depends only on the (two–dimensional) power spectrum of the random field [6,118]. Notice that hΓi < 0 for ν < 0 and hΓi > 0 for ν > 0. A curve shifted to the left with respect to this would be a meatball topology, and to the right would be a swiss–cheese (in the restricted sense described above). The most obviously useful application of this method is to look at projected catalogues, the main problem being that if the catalogue is very deep, each line of sight contains a superposition of many three–dimensional structures. This projection acts to suppress departures from Gaussian statistics by virtue of the central limit theorem [146]. Nevertheless, useful information is obtainable from projected data because of the sheer size of the data sets available [391,221,131,455,146,129]; as is the case with three– dimensional studies, the analysis reveals a clear meatball shift which is what one expects in the gravitational instability picture. An analysis of the genus curve for topological defect toy models was given in [86,223]. An application of the two dimensional genus characteristic to analysing anisotropy in the Cosmic Microwave Background is discussed in [118,223,519,351]. More sophisticated generalised morphological measures of large scale structure topology and connectedness based on Minkowski functionals have been studied in [381].
8.9. Dimensions and Scaling The obvious way to test the idea of multifractal scaling using observations is to attempt to extract estimates of the f (α) spectrum or, equivalently, the generalised dimensions Dq from the catalogue. Care must be taken when doing this, however, because the formal defintions given in Sec. 6.3 require one to take the limit of very small box–size. Obviously, when dealing with a point process one cannot do this because in this limit all boxes will be empty. One therefore looks for scaling over a finite range of box sizes. The standard way to extract information from catalogues is via partition functions. For a distribution which has multifractal scaling properties (see §6.3), the function Z(q, r), defined by N 1 X Z(q, r) = niq−1 ∝ r τ (q) , N i=1
(331)
where r is the size of the cell. By graphing Z against r one can extract τ (q) for any q and this is related to Dq by eq. (270). The Z–partition function does not behave well, however, for q < 2 because the low values of q are dominated by low–density regions whose statistics are severely distorted by discreteness effects, as discussed above. For q < 2 one therefore uses an inverse function – 144
the W –partition function, defined by W (τ, n) =
N 1 X ri (n)−τ ∝ n1−q . N i=1
(332)
Here ri (n) is the radius of the smallest sphere centred upon a point i which encloses n neighbours. Given these two estimators one can extract all the Dq from a galaxy catalogue [280,369,370,368]. Although this technique is relatively new, the results are encouraging. The CfA survey shows clear multifractal scaling properties having, for example, D2 = 1.3 and D0 = 2.1; a more recent analysis of the QDOT survey, which predominantly probes the linear regime, has also good scaling properties but quite different to those of CfA: D2 = 2.77 and D0 = 2.90. Notice that in the monofractal models discussed by, for example, Pietronero [452,115,116] all the Dq would be identical. It remains to be seen whether these analyses will lead to an understanding of the dynamical origin of the multifractal scaling observed.
8.10. Velocity Statistics Because peculiar velocity data is known only for a relatively small number of galaxies, statistical studies of galaxy motion have been restricted to quite simple descriptors, such as the net flow in a given volume [354]. For Gaussian primordial density fields one can construct useful probability distributions, such as [516]
P (v) =
s
v2 �
54 Z πv
1
v σv
�2
"
3 v exp − 2 σv �
�2 #
dv , σv
(333)
which is the probability that velocity is observed between v1 and v2 on a smoothing scale R in a randomly–selected volume: σv2 is given by 33 σv2 (R)
= 4π(H0 f )
2
Z
33
P (k)W 2 (kR) dk.
(334)
Comparison of σv with the mean square density fluctuation σ [see (61)], shows that large scales are weighed more heavily in the former. For power law spectra P (k) ∝ k n , σv2 (R) ∝ R−(1+n) , the observed value of σv (R) can therefore be used to place constraints on the value of the spectral index n.
145
where f ≃ Ω0.6 . More information is contained in two–point correlation statistics of ~v(~x). Firstly, the scalar velocity correlation function: ′
ξv (r) = h~v(~x) · ~v(~x )i = 4π(H0 f )
2
Z∞
P (k)j0 (kr)dk ,
(335)
0
where j0 (x) is a spherical Bessel function of order zero and r = |~x − ~x′ | [445,289,215,229]. Attempts to move further to consider the properties of the velocity correlation tensor, which takes into account the direction of ~v and not just its magnitude, were developed in detail by Gorski [214,215]. There are a number of subtleties involved in velocity statistics that one does not encounter with spatial distributions so we shall point a couple out here. Let us assume that we have a continuous density field and its related velocity field ~v(~x); that is to say, we know the velocity at every point ~x and the density is also defined at ~x. The relevant autocovariance function of ~v must be a tensor: hv i (~x1 )v j (~x2 )i = Ψij (~x1 , ~x2 ).
(336)
Using statistical homogeneity and isotropy, we can decompose the tensor Ψ into transverse and longitudinal parts in terms of scalar functions ψ⊥ and ψk : �
�
Ψij (~x1 , ~x2 ) = ψk (x12 )ni nj + ψ⊥ (x12 ) δ ij − ni nj ,
(337)
~n = (~x1 − ~x2 ) /x12 .
(338)
ψk = h(~n · ~v1 )(~n · ~v2 )i ψ⊥ = h(~u · ~v1 )(~u · ~v2 )i.
(339)
where If ~u is any vector satisfying ~u · ~n = 0 then
~ v = 0 and there is a consequent It can be shown that, in the linear regime, ∇×~ relationship between the longitudinal and transverse functions: ψk =
d [rψ⊥ (r)] dr
(340)
One can test whether the actual velocity field obeys this relationship using the appropriate covariance tensor. Of course, one needs good peculiar motion data and the statistics available at present are not particularly good [215]. One also only measures a peculiar motion in the radial direction from the observer. There is, however, another problem which is spelt out at length by Bertschinger [43]: when one measures galaxy velocities one is not extracting a continuous velocity field. This has a complex and poorly–understood effect upon the final statistics. 146
A more sophisticated approach to the use of velocity information is provided by the POTENT analysis method [44,154,155]; for a recent extensive review of this approach see [153]. The technique makes use of the fact that in the linear theory of gravitational instability the velocity field is curl–free and can therefore be expressed as the gradient of a potential. We saw in §2.2 Eqn. (30) that this velocity potential turns out to be simply proportional to the linear theory value of the gravitational potential. Because the velocity field is the gradient of a potential Φ, one can use the purely radial motions revealed by redshift and distance information to map Φ in three dimensions: ∆Φ(r, θ, φ) = −
Zr
′
vr (r , θ, φ) dr.
(341)
0
Once the potential has been mapped, one can recover the remaining components of v α by differentiating Φ along transverse directions. One can now solve for the density field using the linearised continuity equation δ=−
1 ~ ∇ · ~v af H
(342)
or its quasi–linear generalisation [33] "
2 ~ δ = 1− ∇ · ~v 3af H
#3/2
−1
(343)
Since the velocity field probes the underlying distribution of both dark and luminous matter, the POTENT approximation provides a potentially powerful means for determining Ω. An extension of this techique using the Zel’dovich approximation instead of linear theory is discussed in [415] (see §4.2). Great things are claimed of the POTENT analysis, but one should be cautious of these until larger and more reliable peculiar velocity data sets are available. From the continuity equation, eq. (19) or (21) one sees that the velocity field is more sensitive to the presence of longer wavelengths in the primordial spectrum than the density field. We therefore expect the velocity field to show smaller departures from linear behaviour than the density field when both are smoothed over identical scales. It is therefore useful to extend the quasilinear analysis of §4.1 and §4.7 to velocity fields. We define for this purpose a scalar velocity variable θ(~x) ≡ (1/H)∇~v(~x), in terms of which the skewness and the kurtosis of the velocity field have the form hθ3 i hθ2 i2 hθ4 i − 3hθ2 i2 T4 = hθ2 i3
T3 =
147
(344)
(the angular brackets denote an ensemble average). For Gaussian fields, T3 = T4 = 0. In the weakly nonlinear regime, gravity induces a departure from the initial Gaussianity which results in the following expressions for T3 , T4 , for scale free initial spectra P (k) ∝ k n with top-hat final smoothing [283,36,403] 1 26 − (n + 3) 0.6 Ω 7 � � 1 7 12088 338 T4 = 1.2 − (n + 3) + (n + 3)2 Ω 441 21 3 T3 = −
�
�
(345)
If n is known then equation’s (345) can be used to determine the value of Ω. On the other hand, the ratio T4 /T32 is virtually independent of Ω : T4 (12088/441) − (338/21)(n + 3) + (7/3)(n + 3)2 = , T32 [(26/7) − (n + 3)]2
(346)
and can therefore be used to test the gravitational instability hypothesis if the value of n is known independently [36]. For instance galaxy survey’s seem to indicate −2 ≤ n ≤ −1 on cluster scales (see §8.4), which leads to the prediction: 1.55 ≤ T4 /T32 ≤ 1.85, for data smoothed on such scales. These above methods of course require one to know peculiar motions for a sample of galaxies. As we have mentioned previously, one can still use the existence of peculiar velocities in a statistical sense even if one cannot measure a velocity for each individual source. Correlations and power–spectra in particular show a characteristic distortion when they are viewed in redshift space rather than real space. The two–point correlation function will, for example, be elongated in the radial direction. Given the paucity of available peculiar velocity data, it seems to us that this type of analysis is the most promising approach to the use of cosmological velocity information at present [291,243,226,244,194,195,112,255].
9. Discussion and Conclusions In this review we have attempted to give a comprehensive account of the many facets of gravitational instability, focussing particularly upon its dynamical and statistical aspects. It is well established that gravitational instability proceeds along several distinct epochs over which its characteristic features change continuously. It is perhaps helpful, by way of a summary, to delineate these epochs and how they can be described by the various techniques we have reviewed in this paper. During the first epoch density fluctuations are much smaller than unity and consequently an adequate description is provided by linear theory. During this 148
epoch fluctuations, as long as the thermal velocity of matter is small, evolve self-similarly δ(~x, t) ∝ ∆+ (t)δ(~x), as a result of which the fluctuation spectrum retains many of its original features, particularly the presence or absence of phase correlations. Linear theory begins to break down when δ ∼ 1, marking the onset of the quasi-linear, or weakly non-linear, epoch. During this epoch, mode–mode coupling between the different Fourier components of the density contrast becomes important, resulting in the build–up of phase correlations. Non–Gaussian features in the density field then become important, even when the initial fluctuations are Gaussian. Our understanding of the strongly non–linear regime has undergone a radical change during the last two decades. Two decades ago the top–down model of galaxy formation suggested by Zeldovich and co-workers in connection with adiabatic models of structure formation and the bottom–up, or hierarchical, model suggested by Peebles in relation to isothermal models of galaxy formation were regarded as being mutually exclusive. The former produced correlated structures on very large scales whereas clustering in the latter was essentially featureless and self–similar. The first hints that this rigid demarcation of the two scenarios was not, in fact, correct appeared in the early eighties in studies involving non-baryonic models (such as CDM). These models develope structures from small to large scales and so might be called hierarchical and yet displayed many large–scale features usually associated with pancake models. These results received further confirmation from high resolution Nbody simulations and non-linear approximations such as the adhesion model. It is now widely believed that pancakes form generically in models of hierarchical clustering, the precise size of the pancake being determined by the form of the primordial fluctuation spectrum. It is interesting that pancakes, though prominent at the time of appearance, are actually best regarded as intermediate asymptotes which fade out and ultimately disappear as matter within them moves towards filaments (which form at the intersections of pancakes) and then along filaments towards clumps (which form where filaments intersect). The period during which pancakes, filaments and clumps coexist may be called the cellular epoch. Once most of the matter has collected in clumps, gravitational instability proceeds hierarchically as neighboring clumps attract one another, finally merging to form more and more massive aggregates of gravitationally bound matter. This later epoch of gravitational instability is characterised by the gradual flow of power from smaller to larger scales accompanied by the elimination of small voids and also, occasionally, by the emergence of large coherent structures – secondary pancakes – in models whose primordial spectra have signficant large scale power (including CDM).
149
Clearly the physics of the different epochs characterising gravitational instability will vary continuously as will the statistical properties of the Universe during these separate epochs. It is here that non-linear approximations to gravitational dynamics accompanied by statistical methods play a vital role in the development of our understanding of these processes, and how they apply to the real Universe. While some features of gravitational instability, particularly its dynamical aspects, are reasonably well understood, others, including a comprehensive statistical treatment (such as the one based upon the BBGKY hierarchy) are still in the developmental stage. Consequently, some quasi-analytical treatments which can adequately address certain dynamical aspects of clustering may also can fail to come up with satisfactory answers to statistical questions and vice versa. An illustration of this is the Press-Schechter approximation which, while accounting fairly accurately for the mass (or multiplicity) function of bound objects such as galaxies, fails to say anything at all about the large scale clustering properties of the distribution. It is becoming widely acknowledged that large scale features in the galaxy distribution such as superclusters and voids are real physical entities and can no longer be regarded solely as products of a visual system sensitive to detecting filamentarity. As a result there is a growing need for statistical measures that can provide a qualitative description of such large scale features as exist in the galaxy distribution. It is also realised that whereas statistical descriptors such as the two point correlation function are very useful in characterising the clustering properties of the galaxy distribution on small scales, they say next to nothing about the over-all clustering pattern of galaxies in the Universe (whether bubble-like or sponge-like) and must therefore be complemented by other statistical measures some of which are discussed in §8. The development of analytical techniques to follow the evolution of structure must therefore be accompanied by a comprehensive understanding of the behaviour of the various pattern diagnostics when applied to different degrees of evolution from different primordial power spectra. We have concentrated upon analytical approaches in this article, but there are of course many situations were an analytic treatment is not practical, particularly if one seeks a detailed comparison of evolved distributions with observational properties. We therefore fully acknowledge the enormous value of computational methods in this kind of study. Without the N–body simulation, progress in this area during the last two decades would have been limited indeed. Nevertheless, simulating the process of structure formation is not the same as understanding it and we feel most strongly that analytical studies should be the focus of much more theoretical effort in the forthcoming years. We have shown that much can be explained and understood using quite simple mathematical techiques, and that this is an extremely active area. As
150
further observational data are obtained, about the clustering of galaxies and the primordial fluctuations (from the cosmic microwave background), to complement these theoretical analyses, there is good reason to be optimistic that we will, before long, be able to understand the large–scale structure of the Universe.
Acknowledgement The authors acknowledge stimulating conversations with Robert Brandenberger, John Dubinsky, Jim Fry, Nikolai Gnedin, Salman Habib, Alan Heavens, Anatoli Klypin, Lev Kofman, Bob Mann, Adrian Melott, Dipak Munshi, Dima Pogosyan, Dave Salopek, B.S. Sathyaprakash, Sergei Shandarin, Tarun Souradeep and Alexei Starobinsky. We also thank Ed Bertschinger for his detailed comments on an earlier version of this paper. Peter Coles receives a PPARC Advanced Research Fellowship and thanks PPARC for travel support for the visit to IUCAA during which most of this paper was written. He also thanks IUCAA for hospitality. Both authors thank S.S. Pawar for help in preparing the figures.
References [1] S.J. Aarseth, in: J. Brackbill and B.I. Cohen (eds), Methods of Computational Physics (Academic Press, New York, 1984) p. 1. [2] S.J. Aarseth, J.R. Gott and E.L. Turner, Astrophys. J., 236 (1979) 43. [3] L.F. Abbott and M.B. Wise, Nucl. Phys. B., 135 (1984) 279. [4] G.O. Abell, Astrophys. J. Suppl., 3 (1958) 211. [5] G.O. Abell, H.G. Corwin and R.P. Olowin, Astrophys. J. Suppl., 70 (1989) 1. [6] R.J. Adler, The Geometry of Random Fields (Wiley, New York, 1981). [7] J. Aitchison and J.A.C. Brown, The Lognormal Distribution with special reference to its uses in Economics (Cambridge University Press, Cambridge, 1969). [8] L. Appel and B.J.T. Jones, Mon. Not. R. astr. Soc., 245 (1990) 522. [9] V.I. Arnol’d, S.F. Shandarin and Ya.B. Zel’dovich, Geophys. Astrophys. Fluid. Dyn., 20 (1982) 111. [10] V.I. Arnol’d, Catastrophe Theory (Springer, Berlin, 1976).
151
[11] V.I. Arnol’d, S.M. Gusein-Sade, A.N. Varchenko Singularities of Differentiable Maps, vol. 1 (Birkhauser, Boston, 1985). [12] A. Babul, Astrophys. J., 349 (1990) 429. [13] A. Babul and G.D. Starkman, Astrophys. J., 401 (1992) 28. [14] A. Babul and R. van de Weygaert, CITA preprint, Nature submitted (1994). [15] J.S. Bagla and T. Padmanabhan, Mon. Not. R. astr. Soc., 266 (1994) 227. [16] N.A. Bahcall, Ann. Rev. Astron. Astrophys. 26 (1988) 631. [17] N.A. Bahcall and R.M. Soneira, Astrophys. J., 270 (1983) 20. [18] N.A. Bahcall and M.J. West, Astrophys. J., 392 (1992) 419. [19] R. Balescu, Equilibrium and Non–equilibrium Statistical Mechanics (Wiley, New York, 1975) [20] R. Balian and R. Schaeffer, Astr. Astrophys., 220 (1989) 1. [21] R. Balian and R. Schaeffer, Astr. Astrophys., 226 (1989) 373. [22] J.M. Bardeen, Phys. Rev. D, 22 (1980) 1882. [23] J.M. Bardeen, J.R. Bond, N. Kaiser and A.S. Szalay, Astrophys. J., 304 (1986) 15. [24] J. Barnes and P. Hut, Nature, 324 (1986) 446. [25] J.D. Barrow and S.P. Bhavsar, Quart. J. R. astr. Soc., 28 (1987) 109. [26] J.D. Barrow, S.P. Bhavsar and D.H. Sonoda, Mon. Not. R. astr. Soc., 210 (1984) 19P. [27] J.D. Barrow, S.P. Bhavsar and D.H. Sonoda, Mon. Not. R. astr. Soc., 216 (1985) 17. [28] J.D. Barrow and P. Saich, Class. Quant. Grav., 10 (1993) 79. [29] H. Bateman and A. Erdelyi, Higher Transcendental Functions, Vol. 1 (McGraw–Hill, New York, 1953). [30] C.M. Baugh and G. Efstathiou, Mon. Not. R. astr. Soc., 265 (1993) 165. [31] C.M. Baugh and G. Efstathiou, Mon. Not. R. astr. Soc., 267 (1994) 323. [32] D.J. Baumgart and J.N. Fry, Astrophys. J., 375 (1991) 25. [33] F. Bernardeau, Astrophys. J., 390 (1992) L61. [34] F. Bernardeau, Astrophys. J., 392 (1992) 1. [35] F. Bernardeau, Astrophys. J., 427 (1994) 51. [36] F. Bernardeau, Astrophys. J., 433 (1994) 1.
152
[37] F. Bernardeau and L.A. Kofman, Astrophys. J., in press (1994). [38] F. Bernardeau, T.P. Singh, B. Banerjee and S.M. Chitre, Mon. Not. R. astr. Soc., 269 (1994) 947. [39] E. Bertschinger, Astrophys. J., 268 (1983) 17. [40] E. Bertschinger, Astrophys. J. Suppl., 58 (1985) 1. [41] E. Bertschinger, Astrophys. J. Suppl., 58 (1985) 39. [42] E. Bertschinger, Astrophys. J., 316 (1987) 489. [43] E. Bertschinger, in: V.J. Martinez, M. Portilla and D. Saez (eds), New Insights into the Universe. Proceedings, Valencia, Spain 1991 (Springer, Berlin, 1992) p. 65. [44] E. Bertschinger and A. Dekel, Astrophys. J., 336 (1989) L5. [45] E. Bertschinger, A. Dekel, S.M. Faber, A. Dressler and D. Burstein, Astrophys. J., 364 (1990) 370. [46] E. Bertschinger and J.M. Gelb, Computers in Physics, 5 (1991) 164. [47] E. Bertschinger and B. Jain, Astrophys. J., 431 (1994) 486. [48] E. Bertschinger and A.J.S. Hamilton, Astrophys. J., 435 (1994) 1. [49] S. Bharadwaj, Astrophys. J., 428 (1994) 419. [50] S.P. Bhavsar and J.D. Barrow, Mon. Not. R. astr. Soc., 205 (1983) 61P. [51] S.P. Bhavsar and E.N. Ling, Astrophys. J., 331 (1988) L63. [52] S. Bildhauer, T. Buchert and M. Kasai, Astron. Astrophys., 263 (1992) 23. [53] J. Binney and S. Tremaine, Galactic Dynamics (Princeton University Press, Princeton, 1987). [54] O. Blaes, J.V. Villumsen and P. Goldreich, Astrophys. J., 361 (1990) 331. [55] G.R. Blumenthal, S.M. Faber, J.R. Primack and M.J. Rees, Nature, 311 (1984) 517. [56] G.R. Blumenthal, L.N. da Costa, D.S. Goldwirth, M. Lecar and T. Piran, Astrophys. J., 388 (1992) 234. [57] H. B¨ohringer and G. Wiedenmann, in: V.J. Martinez, M. Portilla and D. Saez (eds), New Insights into the Universe. Proceedings, Valencia, Spain 1991 (Springer, Berlin, 1992) p. 127. [58] J.R. Bond, in: M. Sasaki (ed), Relativistic Cosmology, (Academic Press 1994), p. 23. [59] J.R. Bond, S. Cole, G. Efstathiou and N. Kaiser, Astrophys. J., 379 (1991) 440.
153
[60] J.R. Bond and H.M.P. Couchman, in: A.A. Coley, C.C. Dyer and B.O.J. Tupper (eds), Proceedings of the Second Canadian Conference on General Relativity and Relativistic Astrophysics (World Scientific, Singapore, 1988), p. 385. [61] J.R. Bond, J. Centrella, A.S. Szalay and J.R. Wilson, Mon. Not. R. astr. Soc., 210 (1984) 515. [62] J.R. Bond and G. Efstathiou, Astrophys. J., 285 (1984) L45. [63] J.R. Bond and A.S. Szalay, Astrophys. J., 277 (1983) 443. [64] J.R. Bond, A.S. Szalay and J. Silk, Astrophys. J., 324 (1988) 627. [65] J.R. Bond, R. Crittenden, R.L. Davis, G. Efstathiou and P.J. Steinhardt, Phys. Rev. Lett. 72 (1994) 13. [66] J.R. Bond and S.T. Myers, CITA preprint (1994). [67] J.R. Bond and S.T. Myers, CITA preprint (1994). [68] J.R. Bond and S.T. Myers, CITA preprint (1994). [69] J.R. Bond and S.T. Myers, CITA preprint (1994). [70] H. Bondi, Mon. Not. R. astr. Soc., 107 (1947) 410. [71] W.B. Bonnor and A. Chamorro, Astrophys. J., 361 (1990) 21. [72] S.A. Bonometto, A. Iovino, L. Guzzo, R. Giovanelli and M.P.. Haynes, Astrophys. J., 419 (1993), 451. [73] S.A. Bonometto, F. Lucchin and S. Matarrese, Astrophys. J., 323 (1987) 19. [74] S. Borgani, Physics Reports, to be published (1994). [75] S. Borgani, P. Coles and L. Moscardini, Mon. Not. R. astr. Soc., 271 (1994) 223. [76] F.R. Bouchet and L. Hernquist, Astrophys. J. Suppl., 68 (1988) 521. [77] F.R. Bouchet and L. Hernquist, Astrophys. J., 400 (1992), 25. [78] F.R. Bouchet, R. Juszkiewicz, S. Colombi and R. Pellat, Astrophys. J., 394 (1992) L5. [79] F.R. Bouchet, R. Schaeffer and M. Davis, Astrophys. J., 383 (1991) 19. [80] F.R. Bouchet, M.A. Strauss, M. Davis, K.B. Fisher, A. Yahil and J.P. Huchra, Astrophys. J., 417 (1993) 36. [81] F.R. Bouchet, S. Colombi, E. Hivon and R. Juszkiewicz, Astr. Astrophys. submitted (1994). [82] R.G. Bower, Mon. Not. R. astr. Soc., 248 (1991) 332.
154
[83] R.G. Bower, P. Coles, C.S. Frenk and S.D.M. White, Astrophys. J., 405 (1993) 403. [84] T.G. Brainerd, R.J. Scherrer and J. V. Villumsen, Astrophys. J. 418 (1993) 570. [85] E. Branchini and R.G. Carlberg, Astrophys. J., 434 (1994) 37. [86] R. Brandenberger, D. Kaplan and S. Ramsey, Brown University Preprint, Brown-HET-922 (1993) [87] T.J. Broadhurst, R.S. Ellis, D.C. Koo and A.S. Szalay, Nature, 343 (1990) 726. [88] J.W. Bruce, J. Lond. Math. Soc. (2), 33 (1986) 375. [89] M. Bruni, P.K.S. Dunsby and G.F.R. Ellis, Astrophys. J., 395 (1992) 34. [90] M. Bruni, S. Matarrese and O. Pantano, Astrophys. J., submitted (1994). [91] T. Buchert, Astron. Astrophys., 223 (1989) 9. [92] T. Buchert, Mon. Not. R. astr. Soc., 254 (1992) 729. [93] T. Buchert, Astron. Astrophys., 267 (1993) L51. [94] T. Buchert, Mon. Not. R. astr. Soc., 267 (1994) 811. [95] T. Buchert and J. Ehlers, Mon. Not. R. astr. Soc., 264 (1993) 375. [96] T. Buchert, A.L. Melott, and A.G. Weiss Astron. Astrophys., 288 (1994) 349. [97] J.M. Burgers, The Non–linear Diffusion Equation (Reidel, Dordrecht, 1974). [98] D. Burstein, Rep. Prog. Phys., 53 (1990) 421. [99] R.G. Carlberg and H.M.P. Couchman, Astrophys. J. 340 (1989) 47. [100] D.E. Cartwright and M.S. Longuet–Higgins, Proc. Roy. Soc. Lond. Ser. A., 237 (1956) 212. [101] P. Catelan, Mon. Not. R. astr. Soc., submitted (1994). [102] P. Catelan, P.Coles, S. Matarrese and L. Moscardini, Mon. Not. R. astr. Soc., 268 (1994) 966. [103] P. Catelan, F. Lucchin, S. Matarrese and L. Moscardini, Mon. Not. R. astr. Soc., submitted (1994) [104] P. Catelan and L. Moscardini, Astrophys. J. 426 (1994) 14. [105] A. Cavaliere and N. Menci, Astrophys. J., 435 (1994) 528. [106] R. Cen, Astrophys. J. Suppl., 78 (1992) 341. [107] J.M. Centrella and A.L. Melott Nature, 305 (1983) 196.
155
[108] A. Chamorro, Astrophys. J. 383 (1991) 51. [109] J.M. Cline, H.D. Politzer, S.-J. Rey and M.B. Wise, Comm. Math. Phys., 112 (1987) 217. [110] S. Cole, Astrophys. J., 367 (1991) 45. [111] S. Cole, A. Arag´on-Salamanca, C.S. Frenk, J.F. Navarro and S.E. Zepf, Mon. Not. R. astr. Soc., 271 (1994) 781. [112] S. Cole, K.B. Fisher and D.H. Weinberg, Mon. Not. R. astr. Soc., 267 (1994) 785. [113] S. Cole and N. Kaiser, Mon. Not. R. astr. Soc., 233 (1988) 637. [114] S. Cole and N. Kaiser, Mon. Not. R. astr. Soc., 237 (1989) 1127. [115] P.H. Coleman, L. Pietronero and R.H. Sanders, Astr. Astrophys., 200, L32. [116] P.H. Coleman and L. Pietronero, Phys. Rep., 213 (1992) 311. [117] P. Coles, Mon. Not. R. astr. Soc., 222 (1986) 9P. [118] P. Coles, Mon. Not. R. astr. Soc., 234 (1988) 509. [119] P. Coles, Mon. Not. R. astr. Soc., 238 (1989) 319. [120] P. Coles, Mon. Not. R. astr. Soc., 243 (1990) 171. [121] P. Coles, in: E.D. Feigelson and G.J. Babu, Statistical Challenges in Modern Astronomy (Springer, New York, 1992) p. 57. [122] P. Coles, Mon. Not. R. astr. Soc., 262 (1993) 1065. [123] P. Coles and J.D. Barrow, Mon. Not. R. astr. Soc., 228 (1987) 407. [124] P. Coles and A.G. Davies, Mon. Not. R. astr. Soc., 264 (1993) 261. [125] P. Coles and G.F.R. Ellis, Nature, 370 (1994) 609. [126] P. Coles and C.S. Frenk, Mon. Not. R. astr. Soc., 253 (1991) 727. [127] P. Coles and B.J.T. Jones, Mon. Not. R. astr. Soc., 248 (1991) 1. [128] P. Coles, A.L. Melott and S.F. Shandarin, Mon. Not. R. astr. Soc., 260 (1993) 765. [129] P. Coles, L. Moscardini, M. Plionis, F. Lucchin, S. Matarrese and A. Messina, Mon. Not. R. astr. Soc., 260 (1993) 572. [130] P. Coles, L. Moscardini, F. Lucchin, S. Matarrese and A. Messina, Mon. Not. R. astr. Soc., 264 (1993) 749. [131] P. Coles and M. Plionis, Mon. Not. R. astr. Soc., 250 (1991) 75. [132] C.A. Collins, R.C. Nichol and S.L. Lumsden, Mon. Not. R. astr. Soc., 254 (1992) 295.
156
[133] S. Colombi, Astrophys. J., 435 (1994) 536. [134] H.M.P. Couchman, Mon. Not. R. astr. Soc., 225 (1987) 777. [135] H.M.P. Couchman, Mon. Not. R. astr. Soc., 225 (1987) 795. [136] H.M.P. Couchman, Astrophys. J., 368 (1991) L23. [137] P. Crane and W.C. Saslaw, Astrophys. J., 301 (1986) 1. [138] R. Crittenden, J.R. Bond, R.L. Davis, G. Efstathiou and P.J. Steinhardt, Phys. Rev. Lett., 71 (1993) 324. [139] K.M. Croudace, J. Parry, D.S. Salopek and J.M. Stewart, Astrophys. J, 423 (1994) 22 [140] E.L. Crow and K. Shimizu (eds), Lognormal Distributions: Theory and Applications (Marcel Dekker, New York, 1988). [141] L.N. da Costa, M.J. Geller, P.S. Pellegrini, D.W. Latham, A.P. Fairall, R.D. Marzhe, C.N.A. Miller, J.P. Huchra, J.H. Calderon, M. Ramella and M.I. Kurtz, Astrophys. J., 424 (1994) L1. [142] L.N. da Costa, P.S. Pellegrini, W.L.W. Sargent, J. Tonry, M. Davis, A. Meiksin, D.W. Latham, J.W. Menzies and L.A. Coulson, Astrophys. J., 337 (1988) 544. [143] L.N. da Costa, in: Cosmic Velocity Fields, Proceedings of the ninth IAP Astrophysics meeting; F.R. Bouchet and M. Lachieze-Rey (eds) (Editions Frontieres 1994) p. 475. [144] L.N. da Costa, M.S. Vogeley, M.J. Geller, J.P. Huchra and C. Park, Astrophys. J. Lett. in press (1994). [145] G.B. Dalton, G. Efstathiou, S.J. Maddox and W.J. Sutherland, Astrophys. J., 390 (1992) L1. [146] A.G. Davies and P. Coles, Mon. Not. R. astr. Soc., 260 (1993) 553. [147] A.G. Davies and P. Coles, Mon. Not. R. astr. Soc., 262 (1993) 591. [148] M. Davis, G. Efstathiou, C.S. Frenk and S.D.M. White, 292 (1985) 371. [149] M. Davis, J.P. Huchra, D.W. Latham and J.R. Tonry, Astrophys. J., 253 (1982) 423. [150] M. Davis and P.J.E. Peebles, Astrophys. J. Suppl., 34 (1977) 425. [151] M. Davis and P.J.E. Peebles, Astrophys. J., 267 (1983) 465. [152] R.L. Davis, H.M. Hodges, G.F. Smoot, P.J. Steinhardt and M.S. Turner, Phys. Rev. Lett., 69 (1992) 1856. [153] A. Dekel, Ann. Rev. Astron. Astrophys., 32 (1994) 371. [154] A. Dekel, E. Bertschinger and S.M. Faber, Astrophys. J., 364 (1990) 349.
157
[155] A. Dekel, E. Bertschinger, A. Yahil, M.A. Strauss, M. Davis and J.P. Huchra, Astrophys. J., 412 (1993) 1. [156] A. Dekel, G.R. Blumenthal, J.R. Primack and S. Olivier, Astrophys. J., 338 (1989) L5. [157] A. Dekel and M.J. Rees, Nature, 326 (1987) 455. [158] A. Dekel and M.J. West, Astrophys. J., 288 (1985) 411. [159] V. de Lapparent, M.J. Geller and J.P. Huchra, Astrophys. J., 302 (1986) L1. [160] V. de Lapparent, M.J. Geller and J.P. Huchra, Astrophys. J., 343 (1989) 1. [161] A.G. Doroshkevich, Astrofizica, 6 (1970) 320. [162] A.G. Doroshkevich, Astrophys. Lett., 14 (1973) 11. [163] A.G. Doroshkevich and E.V. Kotok, Mon. Not. R. astr. Soc., 246 (1990) 10. [164] A.G. Doroshkevich, V.S. Ryabenkii and S.F. Shandarin, Astrofizika, 9 (1973) 144. [165] A.G. Doroshkevich, S.F. Shandarin and E. Saar, Mon. Not. R. astr. Soc., 246 (1978) 10. [166] A.G. Doroshkevich, E.V. Kotok, I.D. Novikov, A.N. Polyudov, S.F. Shandarin and Yu.S. Sigov, Mon. Not. R. astr. Soc., 192 (1980) 321. [167] R. Durrer and I. Kovner, Astrophys. J., 356 (1990) 49. [168] R. Durrer and N. Straumann, Mon. Not. R. astr. Soc., 242 (1990) 221. [169] G. Efstathiou, in: J.A. Peacock, A.F. Heavens and A.T. Davies (eds), Physics of the Early Universe. Proceedings of the 36th Scottish Universities Summer School in Physics (Adam Hilger, Bristol, 1990) p. 361. [170] G. Efstathiou and J.R. Bond, Mon. Not. R. astr. Soc., 218 (1986) 103. [171] G. Efstathiou, J.R. Bond and S.D.M. White, Mon. Not. R. astr. Soc., 258 (1992) 1P. [172] G. Efstathiou, G.B. Dalton, W. Sutherland and S.J. Maddox, Mon. Not. R. astr. Soc., 257 (1992) 125. [173] G. Efstathiou, M. Davis, C.S. Frenk and S.D.M. White, Astrophys. J. Suppl., 57 (1985) 241. [174] G. Efstathiou and J.W. Eastwood, Mon. Not. R. astr. Soc., 194 (1981) 503. [175] G. Efstathiou, S.M. Fall and C. Hogan, Mon. Not. R. astr. Soc., 189 (1979) 203. [176] G. Efstathiou, C.S. Frenk, S.D.M. White and M. Davis, Mon. Not. R. astr. Soc., 235 (1988) 715.
158
[177] G. Efstathiou, N. Kaiser, W. Saunders, A. Lawrence, M. Rowan–Robinson and C.S. Frenk, Mon. Not. R. astr. Soc., 247 (1990) 10P. [178] G. Efstathiou and M.J. Rees, Mon. Not. R. astr. Soc., 230 (1988) 5P. [179] J. Einasto, M. Joeveer and E. Saar, Mon. Not. R. astr. Soc., 193 (1980) 353. [180] J. Einasto, J. Einasto, M. Gramann and E. Saar, Mon. Not. R. astr. Soc., 248 (1991) 593. [181] G.F.R. Ellis, in: R.K. Sachs (ed), General Relativity and Cosmology (Academic Press, New York, 1971), p. 104. [182] G.F.R. Ellis and M. Bruni, Phys. Rev. D, 40 (1989) 1804. [183] G.F.R. Ellis and P.K.S. Dunsby, Cape Town preprint, Astrophys. J. submitted (1994). [184] G.F.R. Ellis and W.J. Stoeger, Class. Qu. Grav., 4 (1987) 1679. [185] A.E. Evrard, Mon. Not. R. astr. Soc., 235 (1988) 911. [186] A.E. Evrard, F. Summers and M. Davis, Astrophys. J., 422 (1994) 11. [187] S.M. Faber and D. Burstein, in: V.C. Rubin and G.V. Coyne (eds), Large–scale Motions in the Universe (Princeton University Press, Princeton, 1988) p. 115. [188] D. Fargion, Nuovo Cimento B., 77 (1983) 111. [189] K. Farrar and A.L. Melott, Computers in Physics, 4 (1990) 185. [190] H.A. Feldman and A.E. Evrard, Int. J. Mod. Phys. D., 2 (1993) 113. [191] H.A. Feldman, N. Kaiser and J.A. Peacock, Astrophys. J., 426 (1994) 23. [192] J.A. Fillmore and P. Goldreich, Astrophys. J., 281 (1984) 1. [193] J.A. Fillmore and P. Goldreich, Astrophys. J., 281 (1984) 9. [194] K.B. Fisher, M. Davis, M.A. Strauss, A. Yahil and J.P. Huchra, Astrophys. J., 402 (1993) 42. [195] K.B. Fisher, M. Davis, M.A. Strauss, A. Yahil and J.P. Huchra, Mon. Not. R. astr. Soc., 267 (1994) 927. [196] J.N. Fry, Astrophys. J., 262 (1982) 424. [197] J.N. Fry, Astrophys. J., 277 (1984) L5. [198] J.N. Fry, Astrophys. J., 279 (1984) 499. [199] J.N. Fry, Astrophys. J., 279 (1984) 729. [200] J.N. Fry, Astrophys. J., 289 (1985) 10. [201] J.N. Fry, Phys. Lett., 158B (1985) 211.
159
[202] J.N. Fry, Astrophys. J., 306 (1986) 358. [203] J.N. Fry, Astrophys. J., 421 (1994) 21. [204] J.N. Fry, R. Giovanelli, M.P. Haynes, A.L. Melott and R.J. Scherrer, Astrophys. J., 340 (1989) 11. [205] J.N. Fry and A.L. Melott, Astrophys. J., 292 (1985) 395. [206] J.N. Fry and R.J. Scherrer, Astrophys. J., to be published (1993) [207] J.N. Fry, A.L. Melott and S.F. Shandarin, Astrophys. J., 412 (1993) 504. [208] E. Gaztanaga, Astrophys. J., 398 (1992) L17. [209] E. Gaztanaga, Mon. Not. R. astr. Soc., 268 (1994) 913. [210] E. Gaztanaga and J.A. Frieman, Fermilab preprint 207-A (1994) [211] M. Giavalisco, B. Mancinelli, P.J. Mancinelli and A. Yahil, Astrophys. J., 411 (1993) 9. [212] R. Giovanelli and M.P. Haynes, Ann. Rev. Astr. Astrophys., 29 (1991) 499. [213] M.H. Goroff, B. Grinstein, S.–J. Rey and M.B. Wise, Astrophys. J., 311 (1986) 6. [214] K. Gorski, Astrophys. J., 332 (1988) L7. [215] K. Gorski, M. Davis, M.A. Strauss, S.D.M. White and A. Yahil, Astrophys. J., 344 (1989) 1. [216] K. Gorski, J. Silk and N. Vittorio, Phys. Rev. Lett. 68 (1992) 733. [217] K. Gorski, G. Hindshaw, A.J. Banday, C.L. Bennett and E.L. Wright, Astrophys. J. Lett. (1994) submitted. [218] J.R. Gott, Astrophys. J., 201 (1975) 296. [219] J.R. Gott and M.J. Rees, Astr. Astrophys., 45 (1975), 365. [220] J.R. Gott, A.L. Melott and M. Dickinson, Astrophys. J., 306 (1986) 341. [221] J.R. Gott, S. Mao, C. Park, O. Lahav, Astrophys. J., 385 (1992) 26. [222] J.R. Gott, J. Miller, T.X. Thuan, S.E. Schneider, D.H. Weinberg, C. Garrie, K. Polk, M. Vogeley, S. Jeffrey, S.P. Bhavsar, A.L. Melott, R. Giovanelli, M.P. Haynes, R.B. Tully and A.J.S. Hamilton, Astrophys. J., 340 (1989) 625. [223] J.R. Gott, C. Park, R. Juszkiewicz, W.E. Bies, D.P.Bennett, F.R. Bouchet and A. Stebbins, Astrophys. J., 352 (1990) 1. [224] M. Gramann, Astrophys. J., 405 (1993) L47. [225] M. Gramann, Astrophys. J., 405 (1993) 449. [226] M. Gramann, R. Cen and N.A. Bahcall, Astrophys. J., 419 (1993) 440.
160
[227] B. Grinstein and M.B. Wise, Astrophys. J., 320 (1987) 448. [228] L.P. Grischuk and Ya.B. Zel’dovich, Sov. Astr., 25 (1981) 267. [229] E.J. Groth, R. Juszkiewicz and J.P. Ostriker, Astrophys. J., 346 (1989) 558. [230] E.J. Groth and P.J.E. Peebles, Astr. Astrophys., 41 (1975) 143. [231] E.J. Groth and P.J.E. Peebles, Astr. Astrophys., 53 (1976) 131. [232] E.J. Groth and P.J.E. Peebles, Astrophys. J., 217 (1977) 385. [233] S.F. Gull and A.J.M. Garrett, in: G. J. Erickson (ed), Maximum Entropy and Bayesian Methods, Seattle 1991 (Kluwer, Dordrecht, 1992). [234] J.E. Gunn, Astrophys. J., 218 (1977) 592. [235] J.E. Gunn and J.R. Gott, Astrophys. J., 176 (1972) 1. [236] S.N. Gurbatov and A.I. Saichev, Sov. Phys. JETP., 53 (1981) 347. [237] S.N. Gurbatov, A.I. Saichev and S.F. Shandarin, Sov. Phys. Dokl., 30 (1985) 921. [238] S.N. Gurbatov, A.I. Saichev and S.F. Shandarin, Mon. Not. R. astr. Soc., 236 (1989) 385. [239] S.N. Gurbatov, A.I. Saichev and I.G. Yakushkin, Sov. Phys. Usp., 26 (1983) 857. [240] M. Guyot and Ya.B. Zel’dovich, Astr. Astrophys., 9 (1970) 227. [241] R. Guzman and J.R. Lucey, Mon. Not. R. astr. Soc., 263 (1993) L47. [242] A.J.S. Hamilton, Astrophys. J., 332 (1988) 67. [243] A.J.S. Hamilton, Astrophys. J., 385 (1992) L5. [244] A.J.S. Hamilton, Astrophys. J., 406 (1993) L47. [245] A.J.S. Hamilton, Astrophys. J., 417 (1993) 19. [246] A.J.S. Hamilton, J.R. Gott and D. Weinberg, Astrophys. J., 309 (1986) 1. [247] A.J.S. Hamilton, P. Kumar, E. Lu and A. Mathews, Astrophys. J., 374 (1991) L1. [248] D. Hansel, F.R. Bouchet, R. Pellat and A. Romani, Astrophys. J., 310 (1986), 23. [249] E. Harrison, Phys. Rev. D., 1 (1970) 2726. [250] M.A. Hausman, D.W. Olson and B.D. Roth, Astrophys. J., 270 (1983) 351. [251] S.W. Hawking, Astrophys. J., 145 (1966) 544. [252] M.P. Haynes, Ann. Rev. Astr. Astrophys., 29 (1991) 499.
161
[253] M.P. Haynes and R. Giovanelli, in: V.C. Rubin and G.V. Coyne (eds), Large– scale Motions in the Universe (Princetion University Press, Princeton, 1988) p. 31. [254] D.J. Heath, Mon. Not. R. astr. Soc., 179 (1977) 351. [255] A.F. Heavens and A.N. Taylor, Mon. Not. R. astr. Soc., in press (1995). [256] J.P. Henry and K.A. Arnoud, Astrophys. J., 372 (1991) 410. [257] L. Hernquist and N. Katz, Astrophys. J. Suppl., 70 (1989) 419. [258] E. Hivon, F.R. Bouchet, S. Colombi and R. Juszkiewicz, Astr. Astrophys. Sunmitted (1994). [259] R.W. Hockney and J.W. Eastwood, Computer Simulation Using Particles (McGraw–Hill, New York, 1981). [260] G.L. Hoffman, E.E. Salpeter and I. Wasserman, Astrophys. J., 268 (1983) 527. [261] Y. Hoffman, Astrophys. J., 308 (1986) 493. [262] Y. Hoffman, Astrophys. J., 340 (1989) 69. [263] Y. Hoffman and S. Bludman, Phys. Rev. Lett. 52 (1984) 1087. [264] J. Holtzman, Astrophys. J. Suppl., 71 (1989) 1. [265] E. Hubble, Astrophys. J., 79 (1934) 8. [266] J.–C. Hwang and E. T. Vishniac, Astrophys. J., 353 (1990) 1. [267] V. Icke, Astr. Astrophys., 27 (1973) 1. [268] V. Icke, Mon. Not. R. astr. Soc., 206 (1984) 1. [269] V. Icke and R. van de Weygaert, Astr. Astrophys., 184 (1987) 16. [270] S. Ikeuchi, K. Tomisaka and J.P. Ostriker, Astrophys. J., 265 (1983) 583. [271] S. Ikeuchi and M. Umemura, Prog. Theor. Phys., 72 (1984) 216. [272] M.B. Isichenko, Rev. Mod. Phys., 64 (1992) 961. [273] M. Itoh, S. Inagaki and W.C. Saslaw, Astrophys. J., 403 (1993) 476. [274] B. Jain and E. Bertschinger, Astrophys. J., 431 (1994) 495. [275] K. Janes and P. Demarque, Astrophys. J., 264 (1983) 206. [276] L.G. Jensen and A.S. Szalay, Astrophys. J., 305 (1986) L5. [277] M. Joeveer, J. Einasto and E. Tago, Mon. Not. R. astr. Soc., 185 (1978) 357. [278] W.A. Johnson and R.F. Mehl, Trans. Am. Inst. Min. Metal. Eng., 135 (1939) 416.
162
[279] B.J.T. Jones, P. Coles and V.J. Mart´ınez, Mon. Not. R. astr. Soc., 259 (1992) 146. [280] B.J.T. Jones, V. J. Mart´ınez, E. Saar and J. Einasto, Astrophys. J., 332 (1988) L1. [281] R. Juszkiewicz, Mon. Not. R. astr. Soc., 197 (1981) 931. [282] R. Juszkiewicz and F.R. Bouchet, in: Proceedings of the Second DAEC Meeting, Meudon, France eds. G. Mamon and D. Gerbal, (1991). [283] R. Juszkiewicz, F.R. Bouchet and S. Colombi, Astrophys. J., 412 (1993) L9. [284] R. Juszkiewicz, D.H. Weinberg, P. Amsterdamski, M. Chodorowski and F.R. Bouchet, preprint IASSNS-AST 93/50 (1993). [285] R. Juszkiewicz, D.H. Sonoda and J.D. Barrow, Mon. Not. R. astr. Soc., 209 (1984) 139. [286] N. Kaiser, Astrophys. J., 284 (1984) L9. [287] N. Kaiser, Mon. Not. R. astr. Soc., 227 (1987) 1. [288] N. Kaiser, Mon. Not. R. astr. Soc., 231 (1988) 149. [289] N. Kaiser, in: M. Mezetti, G. Giuricin, F. Mardirossian and M. Ramella (eds), Large–scale Structure and Motions in the Universe (Kluwer, Dordrecht, 1989) p. 197. [290] N. Kaiser, in: D.W. Latham and L.N. da Costa (eds) Proceedings of the Texas/ESO–CERN Symposium on Relativistic Astrophysics, Cosmology and Fundamental Physics, Annals of the New York Academy of Sciences, 647 (1991) p. 295. [291] N. Kaiser, G. Efstathiou, R.S. Ellis, C.S. Frenk, A. Lawrence, M. Rowan– Robinson and W. Saunders, Mon. Not. R. astr. Soc., 252 (1991) 1. [292] H. Kang, J.P. Ostriker, R. Cen, D. Ryu, L. Hernquist, A.E. Evrard, G.L. Bryan and M.L. Norman, Astrophys. J., 430 (1994) 83. [293] A. Kashlinsky, Astrophys. J., 317 (1987) 19. [294] A. Kashlinsky, in: D. W. Latham and L.N. da Costa (eds), Large–scale Structures and Peculiar Motions in the Universe, A. S. P. Conference Series 15 (1991) p. 103 [295] N. Katz and J.E. Gunn, Astrophys. J., 377 (1991) 365. [296] N. Katz, L. Hernquist and D.H. Weinberg, Astrophys. J., 399 (1992) 109. [297] N. Katz, T. Quinn and J.M. Gelb, Mon. Not. R. astr. Soc., 265 (1993) 689. [298] N. Katz and S.D.M. White, Astrophys. J., 412 (1993) 455. [299] G. Kauffman and A.P. Fairall, Mon. Not. R. astr. Soc., 248 (1991) 313.
163
[300] G. Kauffman, B. Guiderdoni and S.D.M. White, Mon. Not. R. astr. Soc., 267 (1994) 981. [301] G. Kauffman and A.L. Melott, Astrophys. J., 393 (1992) 415. [302] G. Kauffman and S.D.M. White, Mon. Not. R. astr. Soc., 261 (1993) 921. [303] G. Kauffman, S.D.M. White and B. Guiderdoni, Mon. Not. R. astr. Soc., 264 (1993) 201. [304] M. Kendall and A. Stuart, The Advanced Theory of Statistics, Volume 1, (Griffin & Co., London, 1977). [305] T. Kiang, Zeitschr. f. Astrophys., 64 (1966) 433. [306] S. Kida, J. Fluid Mech., 93 (1979) 337. [307] J.C. Kirkwood, J. Chem. Phys., 3 (1935) 300. [308] R.P. Kirshner, A. Oemler, P.L. Schechter and S.A. Schechtman, Astrophys. J., 248 (1981) L57. [309] R.P. Kirshner, A. Oemler, P.L. Schechter and S.A. Schechtman, Astr. J., 88 (1983) 1285. [310] A.A. Klypin, J. Holtzman, J.R. Primack and E. Regos, Astrophys. J., 416 (1993) 1. [311] A.A. Klypin and S.F. Shandarin, Mon. Not. R. astr. Soc., 204 (1983) 891. [312] A.A. Klypin and S.F. Shandarin, Astrophys. J., 413 (1993) 48. [313] H. Kodama and M. Sasaki, Prog. Theor. Phys. Suppl., 78 (1984) 1. [314] H. Kodama and M. Sasaki, Int. J. Mod. Phys. A., 2 (1987) 491. [315] L.A. Kofman, in: P. Flin and H.W. Duerbeck (eds), Morphological Cosmology. Proceedings of 11th Krakow Cosmological School (Springer, Berlin, 1989) p. 354. [316] L.A. Kofman, in: K. Sato (ed), Proc. IUAP Proceedings on Nucleosynthesis in the Universe (Kluwer, Dordrecht, 1991) 495. [317] L.A. Kofman, E. Bertschinger, J.M. Gelb, A. Nusser and A. Dekel, Astrophys. J., 420 (1994) 44. [318] L.A. Kofman, N.Y. Gnedin and N.A. Bahcall, Astrophys. J., 413 (1993) 1. [319] L.A. Kofman and D.Yu. Pogosyan, SISSA preprint: astroph/9403029 (1994). [320] L.A. Kofman, D.Yu. Pogosyan and S.F. Shandarin, Mon. Not. R. astr. Soc., 242 (1990) 200. [321] L.A. Kofman, D.Yu. Pogosyan, S.F. Shandarin and A.L. Melott, Astrophys. J., 393 (1992) 437.
164
[322] L.A. Kofman and S. F. Shandarin, Nature, 334 (1988) 129. [323] L.A. Kofman and A.A. Starobinsky, Sov. Astron. Lett. 11 (1985) 271. [324] E.W. Kolb and M.S. Turner, The Early Universe (Addison–Wesley, Chicago, 1990). [325] J.R. Kuhn and J.M. Uson, Astrophys. J., 263 (1982) L47. [326] C.G. Lacey and S. Cole, Mon. Not. R. astr. Soc., 262 (1993) 627. [327] C.G. Lacey, B. Guiderdoni, B. Rocca-Volmerange, and J. Silk, Astrophys. J., 402 (1993) 15. [328] C.G. Lacey and J. Silk, Astrophys. J., 381 (1991) 14. [329] M. Lachieze–Rey, Astrophys. J., 408 (1993) 403. [330] O. Lahav, P.B. Lilje, J.R. Primack and M.J. Rees, Mon. Not. R. astr. Soc., 251 (1991) 128. [331] O. Lahav, M. Itoh, S. Inagaki and Y. Suto, Astrophys. J., 402 (1993) 387. [332] K. Lake and R. Pim, Astrophys. J., 298 (1985) 439. [333] A. Lawrence, M. Rowan–Robinson, J. Crawford, I. Parry, X.-Y. Xia, R.S. Ellis, C.S. Frenk, W. Saunders, G. Efstathiou and N. Kaiser, Mon. Not. R. astr. Soc., to be published (1995). [334] A. Lemaitre, Mon. Not. R. astr. Soc., 91 (1931) 483. [335] A.R. Liddle and D.H. Lyth, Phys. Lett. B., 291 (1992) 391. [336] A.R. Liddle and D.H. Lyth, Mon. Not. R. astr. Soc., 265 (1993) 379. [337] A.R. Liddle and D.H. Lyth, Phys. Reports, 231 (1993) 1. [338] J.E. Lidsey and P. Coles, Mon. Not. R. astr. Soc., 258 (1992) 57P. [339] E.M. Lifshitz, Zh. Eksp. Teoret. Fiz. 16 (1946) 587. [340] E.M. Lifshitz and I.M. Khalatnikov, Sov. Phys. Usp., 6 (1964) 495. [341] P.B. Lilje and G. Efstathiou, Mon. Not. R. astr. Soc., 231 (1988) 635. [342] D.N. Limber, Astrophys. J., 119 (1954) 665. [343] C.C. Lin, L. Mestel and F.H. Shu, Astrophys. J., 142 (1965) 1431. [344] E.N. Ling, C.S . Frenk and J.D. Barrow, Mon. Not. R. astr. Soc., 223 (1986) 21P. [345] B. Little and D.H. Weinberg, Mon. Not. R. astr. Soc., 267 (1994) 605. [346] E.L. Lokas, R. Juszkiewicz, D.H. Weinberg and F.R. Bouchet, Mon. Not. R. astr. Soc., submitted (1994).
165
[347] J. Loveday, G. Efstathiou, B.A. Paterson and S.J. Maddox, Astrophys. J., 400 (1992) L43. [348] F. Lucchin, S. Matarrese and S. Mollerach, Astrophys. J., 401 (1992) L49. [349] F. Lucchin, S. Matarrese, A.L. Melott and L. Moscardini, Astrophys. J., 422 (1994) 430. [350] S. L. Lumsden, A. F. Heavens and J. A. Peacock, Mon. Not. R. astr. Soc., 238 (1989) 293. [351] X. Luo, Phys. Rev. D, 49 (1994) 3810. [352] X. Luo and D.N. Schramm, Phys. Rev. Lett., 71 (1993) 1124. [353] D. Lynden–Bell, Astrophys. J., 139 (1964) 1195. [354] D. Lynden–Bell, S. M. Faber, D. Burstein, R. L. Davies, A. Dressler, R. J. Terlevich and G. Wegner, Astrophys. J., 326 (1988) 19. [355] D. Lynden–Bell, O. Lahav and D. Burstein, Mon. Not. R. astr. Soc., 241 (1989) 325. [356] S. J. Maddox, G. Efstathiou, W. J. Sutherland and J. Loveday, Mon. Not. R. astr. Soc., 242 (1990) 43P. [357] K. Maeda and H. Sato, Prog. Theor. Phys., 70 (1983) 772. [358] K. Maeda, M. Sasaki and H. Sato, Prog. Theor. Phys., 69 (1982) 89. [359] N. Makino, M. Sasaki and Y. Suto, Phys. Rev. D., 46 (1992) 585. [360] B. B. Mandelbrot, Fractals: Form, Chance, Dimension (Freeman, San Francisco, 1977). [361] B. B. Mandelbrot, The Fractal Geometry of Nature (Freeman, New York, 1982). [362] R. G. Mann, A. F. Heavens and J. A. Peacock, Mon. Not. R. astr. Soc., 263 (1993) 798. [363] S. Mao and C.S. Kochanek, Mon. Not. R. astr. Soc., 268 (1994) 569. [364] D. Maoz and H.–W. Rix, Astrophys. J., 416 (1993) 425. [365] H. Martel, Astrophys. J., 377 (1991) 7. [366] H. Martel and W. Freudling, Astrophys. J., 371 (1991) 1. [367] H. Martel and I. Wasserman, Astrophys. J., 348 (1990) 1. [368] V. J. Mart´ınez and P. Coles, Astrophys. J., 437 (1994) 550. [369] V. J. Mart´ınez and B. J. T. Jones, Mon. Not. R. astr. Soc., 242 (1990) 517. [370] V. J. Mart´ınez, B. J. T. Jones, R. Dominguez–Tenreiro and R. van de Weygaert, Astrophys. J., 357 (1990) 50.
166
[371] S. Matarrese, F. Lucchin, L. Moscardini and D. Saez, Mon. Not. R. astr. Soc., 259 (1992) 437. [372] S. Matarrese, O. Pantano and D. Saez, Phys. Rev. D, 47 (1993) 1311. [373] S. Matarrese, O. Pantano and D. Saez, Phys. Rev. Lett. 72 (1994) 320. [374] S. Matarrese, O. Pantano and D. Saez, Mon. Not. R. astr. Soc., 271 (1994) 513. [375] J. C. Mather, E. S. Cheng, R. E. Eplee, R. B. Isaacman, S. S. Meyer, R. A. Shafer, R. Weiss, E. L. Wright, C. L. Bennett, N. W. Boggess, E. Dwek, S. Gulkis, M. G. Hauser, M. Janssen, T. Kelsall, P. M. Lubin, S. H. Moseley Jr, T. L. Murdock, R. F. Silverberg, G. F. Smoot and D. T. Wilkinson, Astrophys. J., 354 (1990) L37. [376] J. C. Mather et al. Astrophys. J., 420 (1994) 439. [377] T. Matsuda and E. Shima, Prog. Theor. Phys., 71 (1984) 855. [378] S. Maurogordato and M. Lachieze-Rey, Astrophys. J., 320 (1987) 13. [379] S. Maurogordato and M. Lachieze-Rey, Astrophys. J., 369 (1991) 30. [380] P. Meakin, Phys. Rev. A., 36 (1987) 2833. [381] K. R. Mecke, T. Buchert and H. Wagner, Astr. Astrophys., 288 (1994) 697. [382] A. Meiksin, I. Szapudi and A. S. Szalay, Astrophys. J., 384 (1992) 87. [383] A. L. Melott, Physics Reports, 193 (1990) 1. [384] A. L. Melott, Comments on Astrophysics, 15 (1990) 1. [385] A. L. Melott and J.L. Pauls, Phys. Rev. Lett. (1994) submitted. [386] A. L. Melott, T. Pellman and S. F. Shandarin, Mon. Not. R. astr. Soc., 269 (1994) 626. [387] A. L. Melott and S. F. Shandarin, Astrophys. J., 342 (1989) 26. [388] A.L. Melott and S.F. Shandarin, Nature 346 (1990) 633. [389] A.L. Melott, F. Lucchin, S. Matarrese, and L. Moscardini, Mon. Not. R. astr. Soc., 268 (1994) 69. [390] A. L. Melott, T. Buchert and A. G. Weiss, Astr. Astrophys. In Press. [391] A.L. Melott, A.P. Cohen, A.J.S. Hamilton, J.R. Gott and D.H. Weinberg, Astrophys. J., 345 (1989) 618. [392] A.L. Melott, S.F. Shandarin and D.H. Weinberg, Astrophys. J. 428 (1994) 28. [393] P. Meszaros, Astr. Astrophys., 37 (1974) 225. [394] J. L. Meyerling, Philips Res. Rept. 8 (1953) 270.
167
[395] R. E. Miles, Math. Biosci., 6 (1970) 270. [396] J. Moller, Adv. Appl. Prob. , 21 (1989) 37. [397] J. E. Moody, E. L. Turner and J. R. Gott, Astrophys. J., 273 (1983) 16. [398] B. Moore, C. S. Frenk, D. H. Weinberg, W. Saunders, A. Lawrence, M. Rowan– Robinson, N. Kaiser, G. Efstathiou and R. S. Ellis, Mon. Not. R. astr. Soc., 256 (1992) 477. [399] J.G. More, A.F. Heavens and J.A. Peacock, Mon. Not. R. astr. Soc., 220 (1986) 189. [400] L. Moscardini, S. Matarrese, F. Lucchin, and A. Messina, Mon. Not. R. astr. Soc., 248 (1991) 424. [401] F. Moutarde, J. M. Alimi, F. R. Bouchet, R. Pellat and A. Ramani, Astrophys. J., 382 (1991) 377. [402] V.F. Mukhanov, H.A. Feldman and R.H. Brandenberger, Phys. Rep., 215 (1992) 203. [403] D. Munshi, V. Sahni and A. A. Starobinsky, Astrophys. J., 436 (1994) 517. [404] D. Munshi, T. Souradeep and A. A. Starobinsky, Astrophys. J., submitted (1995). [405] D. Munshi and A. A. Starobinsky, Astrophys. J., 428 (1994) 433. [406] H. Nariai and M. Fujimoto, Prog. Theor. Phys., 47 (1972) 105. [407] J.F. Navarro and W. Benz, Astrophys. J., 380 (1991) 320. [408] J.F. Navarro and S.D.M. White, Mon. Not. R. astr. Soc., 265 (1993) 271. [409] R. P. Nelson and J. C. B. Papaloizou, Mon. Not. R. astr. Soc., 265 (1993) 905. [410] R.C. Nichol, C.A. Collins, L. Guzzo and S.L. Lumsden, Mon. Not. R. astr. Soc., 255 (1992) 21P. [411] R. Nityananda and T. Padmanabhan, Mon. Not. R. astr. Soc., 271 (1994) 976. [412] A. Nusser and A. Dekel, Astrophys. J., 362 (1990) 14. [413] A. Nusser and A. Dekel, Astrophys. J., 391 (1992) 443. [414] A. Nusser and A. Dekel, Astrophys. J., 405 (1993) 437. [415] A. Nusser, A. Dekel, E. Bertschinger and G. R. Blumenthal, Astrophys. J., 376 (1991) 6. [416] F. Occhionero, P. Santangelo and N. Vittorio, Astron. Astrophys. 117 (1983) 365.
168
[417] K. A. Olive, G. Steigman and T. P. Walker, Astrophys. J., 380 (1991) L1. [418] S. Olivier, G. R. Blumenthal, A. Dekel, J. R. Primack and D. Stanhill, Astrophys. J., 356 (1990) 1. [419] S. Otto, H. D. Politzer, J. Preskill and M. B. Wise, Astrophys. J., 304 (1986) 62. [420] T. Padmanabhan and D. Narasimha, Mon. Not. R. astr. Soc., 259 (1992) 41p. [421] T. Padmanabhan and K. Subramanian, Astrophys. J., 410 (1993) 482. [422] T. Padmanabhan, Structure formation in the Universe (Cambridge University Press, Cambridge, 1993). [423] G. Paladin and A. Vulpiani, Physics Reports, 156 (1987) 147. [424] M. Panek, Mon. Not. R. astr. Soc., 216 (1985) 85. [425] C. Park, J. R. Gott, A. L. Melott and I. D. Kharachentsev, Astrophys. J., 387 (1992) 1. [426] C. Park, M.S. Vogeley, M.J. Geller and J.P. Huchra, Astrophys. J., 431 (1994) 569. [427] R.B. Partridge and P.J.E. Peebles, Astrophys. J., 148 (1967) 377. [428] J. L. Pauls and A.L. Melott, Mon. Not. R. astr. Soc. in press (1995). [429] J.A. Peacock, Mon. Not. R. astr. Soc., 253 (1991) 1P. [430] J.A. Peacock, in: V.J. Martinez, M.Portilla and D. Saez (eds), New Insights into the Universe. Proceedings, Valencia, Spain 1991 (Springer, Berlin, 1992) p. 1. [431] J.A. Peacock and S. Dodds, Mon. Not. R. astr. Soc., 267 (1994) 1020. [432] J.A. Peacock and A.F. Heavens, Mon. Not. R. astr. Soc., 217 (1985) 805. [433] J.A. Peacock and A.F. Heavens, Mon. Not. R. astr. Soc., 243 (1990) 133. [434] J.A. Peacock and D. Nicholson, Mon. Not. R. astr. Soc., 253 (1991) 307. [435] J.A. Peacock and M.J. West, Mon. Not. R. astr. Soc., 259 (1992) 494. [436] R.C. Pearson and P. Coles, Mon. Not. R. astr. Soc., 272 (1995) 231. [437] P.J.E. Peebles, Astrophys. J., 147 (1967) 859. [438] P.J.E. Peebles, Astrophys. J., 189 (1974) L51. [439] P.J.E. Peebles, Astr. Astrophys., 32 (1974) 197. [440] P.J.E. Peebles, The Large–scale Structure of the Universe (Princeton University Press, Princeton, 1980). [441] P.J.E. Peebles, Astrophys. J., 257 (1982) 438.
169
[442] P.J.E. Peebles, Astrophys. J., 258 (1982) 415. [443] P.J.E. Peebles, Astrophys. J., 263 (1982) L1. [444] P.J.E. Peebles, Astrophys. J., 284 (1984) 439. [445] P.J.E. Peebles, Astrophys. J., 315 (1987) L73. [446] P.J.E. Peebles, Astrophys. J., 362 (1990) 1. [447] P.J.E. Peebles, Principles of Physical Cosmology (Princeton University Press, Princeton, 1993). [448] P.J.E. Peebles, Astrophys. J., 429 (1994) 43. [449] P.J.E. Peebles and E.J. Groth, Astrophys. J., 196 (1975) 1. [450] L. Perivolaropoulos, R. Brandenberger and A. Stebbins, Phys. Rev. D, 41 (1990) 1764. [451] V. Petrosian, E.E. Salpeter and P. Szekeres, Astrophys. J., 147 (1967) 1222. [452] L. Pietronero, Physica, 144A (1987) 257. [453] R. Pim and K. Lake, Astrophys. J., 304 (1986) 75. [454] R. Pim and K. Lake, Astrophys. J., 330 (1988) 625. [455] M. Plionis, R. Valdarnini and P. Coles, Mon. Not. R. astr. Soc., 258 (1992) 114. [456] D. Yu Pogosyan, Tartu Preprint, Estonian Acad. Sci. (1989). [457] D. Yu Pogosyan and A.A. Starobinsky, Mon. Not. R. astr. Soc., 265 (1993) 507. [458] H.D. Politzer and J. Preskill, Phys. Rev. Lett., 56 (1986) 99. [459] H.D. Politzer and M.B. Wise, Astrophys. J., 285 (1984) L1. [460] M. Postman, M.J. Geller and J.P. Huchra, Astr. J., 91 (1986) 1267. [461] W.H. Press and P.L. Schechter, Astrophys. J., 187 (1974) 425. [462] J.R. Primack and G.R. Blumenthal, in: F. Mardirossian, G. Giuricin and M. Mezzetti (eds), Clusters and Groups of Galaxies, (Reidel, Dordrecht, 1984) p. 435. [463] J.R. Primack, J. Holtzman, A. Klypin and D.O. Caldwell, Phys. Rev. Lett., in press (1995). [464] E. Regos and M.J. Geller, Astrophys. J., 377 (1991) 14. [465] S.O. Rice, Bell Systems Tech. Journal, 24 (1945) 46. [466] S.O. Rice, in: N. Wax (ed), Selected Papers on Noise and Stochastic Processes (Dover, New York, 1954) p. 133.
170
[467] L. Ruamsuwan and J.N. Fry, Astrophys. J., 396 (1992) 416. [468] V.A. Rubakov, M.V. Sazhin and A.V. Veryaskin, Phys. Lett. B., 115 (1982) 189. [469] B. Ryden and M. Gramann, Astrophys. J., 383 (1991) L33. [470] D. Ryu, J.P. Ostriker, H. Kang and R. Cen, Astrophys. J., 414 (1993) 1. [471] R.K. Sachs and A.M. Wolfe, Astrophys. J., 147 (1967) 73. [472] V. Sahni, Pramana, 15 (1980) 423. [473] V. Sahni, One–loop Quantum Gravitational Effects and the Growth of Density Perturbations in Cosmological Models, (PhD Thesis, Moscow State University, 1984) [474] V. Sahni, in: Proceedings of Texas/ESO–CERN Symposium on Relativistic Astrophysics, Cosmology and Fundamental Physics, Annals of the New York Academy of Sciences, 647 (1991) 749. [475] V. Sahni, H. Feldman and A. Stebbins, Astrophys. J., 385 (1992) 1. [476] V. Sahni, B.S. Sathyaprakash and S.F. Shandarin, Astrophys. J., 431 (1994) 20. [477] V. Sahni, B.S. Sathyaprakash and D. Pogosyan, In preparation (1995). [478] V. Sahni, B.S. Sathyaprakash and S.F. Shandarin, In preparation (1995). [479] V. Sahni and T. Souradeep, in: M. C. Bento, O. Bertolami, J.M. Mourao and R. F. Picken (eds), Classical and Quantum Gravity: Proceedings of the First Iberian Meeting on Gravity, Evora, Portugal 21 - 26 September 1992 (World Scientific, Singapore, 1993) p. 256. [480] J.K. Salmon, “Parallel Hierarchical N-body Methods”, PhD thesis, Caltech (1991) Unpublished. [481] J.K. Salmon and M.S. Warren, J. Comp. Phys. , in press (1994). [482] D.S. Salopek, Phys. Rev. Lett., 69 (1992) 3602. [483] D.S. Salopek, J.M. Stewart and K.M. Croudace, Mon. Not. R. astr. Soc., 271 (1994) 1005. [484] D.S. Salopek and J.M. Stewart, Phys. Rev. D, 51 (1995) 517. [485] W.C. Saslaw, Astrophys. J., 235 (1980) 299. [486] W.C. Saslaw, Gravitational Physics of Stellar and Galactic Systems (Cambridge University Press, Cambridge, 1985). [487] W. C. Saslaw, Astrophys. J., 304 (1986) 11. [488] W.C. Saslaw, Astrophys. J., 341 (1989) 588.
171
[489] W.C. Saslaw, Astrophys. J., 391 (1991) 423. [490] W.C. Saslaw, S.M. Chitre, M. Itoh and S. Inagaki, Astrophys. J., 365 (1990) 419. [491] W.C. Saslaw and A.J.S. Hamilton, Astrophys. J., 276 (1984) 13. [492] W.C. Saslaw and R.K. Sheth, Astrophys. J., 409, 504. [493] B. S. Sathyaprakash, V. Sahni, D. Munshi, D. Pogosyan and A. L. Melott, Mon. Not. R. ast. Soc. (1995) In press. [494] B. S. Sathyaprakash, V. Sahni, S.F. Shandarin and K.B. Fisher, In preparation 1995. [495] H. Sato, Prog. Theor. Phys., 68 (1982) 236. [496] H. Sato and K. Maeda, Prog. Theor. Phys., 70 (1983) 119. [497] W. Saunders, C.S. Frenk, M. Rowan–Robinson, G. Efstathiou, A. Lawrence, N. Kaiser, R.S. Ellis, J. Crawford, X.–Y. Xia and I. Parry, Nature, 349 (1991) 32. [498] R. Schaeffer and J. Silk, Astrophys. J., 292 (1985) 319. [499] R. Schaeffer and J. Silk, Astrophys. J., 322 (1988), 1. [500] P.L. Schechter, Astrophys. J., 203 (1976) 247. [501] R.J. Scherrer, A.L. Melott and S.F. Shandarin, Astrophys. J., 377 (1991) 29. [502] J. Schwarz, J. P. Ostriker and A. Yahil, Astrophys. J., 202 (1975) 1. [503] L.I. Sedov, Similarity and Dimensional Methods in Mechanics (Academic Press, New York, 1959) [504] M. Seldner and P.J.E. Peebles, Astrophys. J., 215 (1977) 703. [505] S.F. Shandarin, Sov. Astron. Lett., 9 (1983) 104. [506] S.F. Shandarin, Kansas University preprint (1994); To appear in: Proceedings of the Conference “Cosmic Velocity Fields”, Paris, July 1993 [507] S.F. Shandarin, A.G. Doroshkevich and Ya.B. Zel’dovich, Sov. Phys. Usp., 26 (1983) 46. [508] S.F. Shandarin and Ya.B. Zel’dovich, Comments on Astrophysics, 10 (1983) 33. [509] S.F. Shandarin and Ya.B. Zel’dovich, Rev. Mod. Phys., 61 (1989) 185. [510] C.D. Shane and C.A. Wirtanen, Publ. Lick. Obs., 22 (1967), part 1. [511] T. Shanks, Mon. Not. R. astr. Soc., 186 (1979) 583. [512] T. Shanks, D. Hale-Sutton, R. Fong and N. Metcalfe, Mon. Not. R. astr. Soc., 237 (1989), 589.
172
[513] P. Shapiro and K. Struck–Marcell, Astrophys. J. Suppl., 57 (1984) 205. [514] N.A. Sharp, S.A. Bonometto and F. Lucchin, Astr. Astrophys., 130 (1984) 79. [515] R.K. Sheth, H.J. Mo and W.C. Saslaw, Astrophys. J., 427 (1994) 562. [516] J. Silk and N. Vittorio, in: J. Audouze and F. Melchiorri (eds), Confrontation between Theories and Observations in Cosmology: Present Status and Future Programs. Proceedings of the International School of Physics “Enrico Fermi”, (North–Holland, Amsterdam, 1990) p. 137. [517] V. Silviera and I. Waga, Phys. Rev. D, 50 (1994) 4890. [518] G.F. Smoot, C.L. Bennett, A. Kogut, E.L. Wright, J. Aymon, N.W. Boggess, E.S. Cheng, G. de Amici, S. Gulkis, M.G. Hauser, G. Hinshaw, P.D. Jackson, M. Janssen, E. Kaita, T. Kelsall, P. Keegstra, C. Lineweaver, K. Loewenstein, P. Lubin, J. Mather, S.S. Meyer, S.H. Moseley, T. Murdock, L. Rokke, R.F. Silverberg, L. Tenorio, R. Weiss and D.T. Wilkinson, Astrophys. J., 396 (1992) L1. [519] G.F. Smoot, L. Tenorio, A.J. Banday, A. Kogut, E.L. Wright, G. Hinshaw and C.L. Bennett, Astrophys. J., submitted (1993). [520] J. Soda and Y. Suto, Astrophys. J., 396 (1992) 379. [521] L.V. Solov’eva and I.S. Nurgaliev, Sov. Astr., 29 (1985) 267. [522] L.V. Solov’eva and A.A. Starobinsky, Sov. Astr., 29 (1985) 367. [523] T. Souradeep and V. Sahni, Mod. Phys. Lett., A7 (1992) 3541. [524] A.A. Starobinsky, Sov. Astr. Lett., 11 (1985) 133. [525] A.A. Starobinsky and V. Sahni, in: Modern Theoretical and Experimental Problems of General Relativity (MGI Press, Moscow, 1984) p. 77. [526] D. Stoyan, W.S. Kendall and J. Mecke, Stochastic geometry and its applications, (Akademie–Verlag, Berlin, 1987) [527] M.A. Strauss and M. Davis, in: V. Rubin and G. V. Coyne (eds), Large–scale Motions in the Universe (Princeton University Press, Princeton, 1988) p. 256. [528] M.A. Strauss, M. Davis, A. Yahil and J.P. Huchra, Astrophys. J., 385 (1992) 421. [529] M.F. Struble and H.J. Rood, Astrophys. J. Suppl., 77 (1991) 263. [530] M.P. Susperregi and J.J. Binney, Mon. Not. R. astr. Soc., 271 (1994) 719. [531] W.J. Sutherland, Mon. Not. R. astr. Soc., 234 (1988) 159. [532] W.J. Sutherland and G. Efstathiou, Mon. Not. R. astr. Soc., 248 (1991) 159. [533] Y. Suto, M. Itoh and S. Inagaki, Astrophys. J., 350 (1990) 492. [534] Y. Suto and M. Sasaki, Phys. Rev. Letters, 66 (1991) 264.
173
[535] A.S. Szalay in: Large Scale Structures in the Universe, Seventeenth advanced course of the Swiss society of Astronomy and Astrophysics, Saas-Fee (Geneva Observatory, Switzerland, 1987). [536] I. Szapudi and A.S. Szalay, Astrophys. J., 403 (1993) 43. [537] I. Szapudi, A.S. Szalay and P. Boschan, Astrophys. J., 390 (1992) 350. [538] R.C. Tolman, Proc. Nat. Acad. Sci. 20 (1934) 169. [539] M. Totsuji and T. Kihara, Pub. Astr. Soc. Jap., 21 (1969) 221. [540] R.B. Tully and J.R. Fisher, Nearby Galaxy Atlas (Cambridge University Press, Cambridge, 1987). [541] E.L. Turner, Astrophys. J., 365 (1990) L43. [542] R. van de Weygaert and V. Icke, Astron. Astrophys. 213 (1989) 1. [543] R. van de Weygaert and A. Babul, Astrophys. J. Lett. 425 (1994) L59. [544] R. van de Weygaert and E. van Kampen, Mon. Not. R. astr. Soc., 263 (1993) 481. [545] R. van de Weygaert, Astron. Astrophys. 283 (1994) 361. [546] M. Vergassola, B. Dubrulle, U. Frisch and A. Noullez, Astron. Astrophys. 289 (1994) 325. [547] E.T. Vishniac, Mon. Not. R. astr. Soc., 203 (1983) 345. [548] E.T. Vishniac, in: E.W. Kolb, M.S. Turner, D. Lindley, K. Olive and D. Seckel (eds), Inner Space/ Outer Space (University of Chicago Press, Chicago, 1986) p. 190. [549] N. Vittorio and M.S. Turner, Astrophys. J., 316 (1987) 475. [550] S.V. Vogeley, M.J. Geller and J.P. Huchra, Astrophys. J., 382 (1991) 44. [551] S.V. Vogeley, C. Park, M.J. Geller and J.P. Huchra, Astrophys. J., 391 (1992) L5. [552] G. Voronoi, J. reine angew. Math. 134 (1908) 198. [553] M.S. Warren, P.J. Quinn, J.K. Salmon and W.H. Zurek, Astrophys. J., 399 (1992) 405. [554] I. Wasserman, Astrophys. J., 248 (1981) 1. [555] G. Wegner, J.R. Thorstensen, M. J. Kurtz, M.J. Geller and J.P. Huchra, Astr. J., 100 (1990) 1405. [556] S. Weinberg, Phys. Rev. Lett., 59 (1987) 2607. [557] D.H. Weinberg and S. Cole, Mon. Not. R. astr. Soc., 259 (1992) 652.
174
[558] D.H. Weinberg, J.P. Ostriker and A. Dekel, Astrophys. J., 336 (1989) 9. [559] D.H. Weinberg and J.E. Gunn, Mon. Not. R. astr. Soc., 247 (1990) 260. [560] D H. Weinberg and J.E. Gunn, Astrophys. J., 352 (1990) L25. [561] D. Weistrop, P. Hintzen, R.C. Kennicutt, C. Liu, J. Lowenthal, K.P. Cheng, R. Oliverson, and B. Woodgate, Astrophys. J., 396 (1992) L23. [562] M.J. West, D.H. Weinberg and A. Dekel, Astrophys. J., 353 (1990) 329. [563] M. White, D. Scott and J. Silk, Ann. Rev. Astron. Astrophys., 32 (1994) 319. [564] S.D.M. White, Mon. Not. R. astr. Soc., 186 (1979) 145. [565] S.D.M.White and C.S. Frenk, Astrophys. J., 379 (1991), 52. [566] G.B. Whitham, Linear and Non–linear Waves, (Wiley, New York, 1974). [567] B.G. Williams, Ph.D. Thesis, University of Edinburgh, (1992). [568] B.G. Williams, J.A. Peacock and A.F. Heavens, Mon. Not. R. astr. Soc., 252 (1991) 43. [569] B.G. Williams, A.F. Heavens, J.A. Peacock and S.F. Shandarin, Mon. Not. R. astr. Soc., 250 (1991) 458. [570] E.L. Wright, et al. Astrophys. J., 420 (1994) 1. [571] A. Yahil, in: V. Rubin and G.V. Coyne (eds), Large–scale Motions in the Universe (Princeton University Press, Princeton, 1988) p. 219. [572] S. Zaroubi and Y. Hoffman, Astrophys. J., 414 (1993) 20. [573] Ya.B. Zel’dovich, Astron. Zh., 41 (1964) 873. [574] Ya.B. Zel’dovich, Astr. Astrophys., 4 (1970) 84. [575] Ya.B. Zel’dovich, Mon. Not. R. astr. Soc., 160 (1972) 1P. [576] Ya.B. Zel’dovich, Sov. Astron. Lett., 8 (1982) 102. [577] Ya B. Zel’dovich, J. Einasto and S.F. Shandarin, Nature, 300 (1982) 407. [578] Ya.B. Zel’dovich, A.V. Mamaev and S.F. Shandarin, Sov. Phys. Usp., 26 (1983) 77. [579] Ya.B. Zel’dovich and I.D. Novikov, The Structure and Evolution of the Universe, (University of Chicago Press, Chicago, 1983). [580] Ya.B. Zel’dovich and S.F. Shandarin, Sov. Astron. Lett., 8 (1982) 67. [581] J.M. Ziman, Models of Disorder (Cambridge University Press, Cambridge, 1979). [582] F. Zwicky, Morphological Astronomy (Springer, Berlin, 1957). [583] F. Zwicky, E. Herzog, P. Wild, M. Karpowicz and C.T. Kowal, Catalog of Galaxies and Clusters of Galaxies Vols. 1 - 6, (Pasadena: Calif. Inst. Technol. 1961 - 1968).
175