is to achieve real-time replication of even the most sparsely located content ... unstructured P2P networks, peers usually operate on local knowledge, with ...
APRE: A Replication Method for Unstructured P2P Networks Dimitrios Tsoumakos Nick Roussopoulos Department of Computer Science University of Maryland College Park, MD 20742, U.S.A.
CS-TR-4817 February 2006, College Park, MD Abstract We present APRE, a replication method for structureless Peer-to-Peer overlays. The goal of our method is to achieve real-time replication of even the most sparsely located content relative to demand. APRE adaptively expands or contracts the replica set of an object in order to improve the sharing process and achieve a low load distribution among the providers. To achieve that, it utilizes search knowledge to identify possible replication targets inside query-intensive areas of the overlay. We present detailed simulation results where APRE exhibits both efficiency and robustness relative to the number of requesters and the respective request rates. The scheme proves particularly useful in the event of flash crowds, managing to quickly adapt to sudden surges in load.
I. I NTRODUCTION Peer-to-Peer (hence P2P) computing represents the notion of sharing resources available at the edges of the Internet [32]. Its success can still be largely attributed to file-sharing applications (e.g., [11], [13], [14], [19]) which enable users worldwide to exchange locally maintained content. Nevertheless, an increasing number of diverse applications that utilize this technology have emerged. P2P has been proposed to assist in web caching [16], instant messaging [15], e-mails [18], update propagation [8], conferencing [3], etc. A basic requirement for every P2P system is fault-tolerance. Since the primary objective is resource location and sharing, we require that this basic operation takes place in an reliable manner. In a variety of circumstances, the distributed and dynamic nature of the target environments stress the system’s ability to operate as desired. Therefore, in many scenarios (routes to) recourses become scarce, servers get overloaded and throughput can diminish due to high workloads. Data replication techniques are commonly utilized in order to avoid such instances. System resources (content and its location, routing indices, topology information, etc) are cached/replicated by more than a single node in the network, alleviating single points of contact in both routing
2
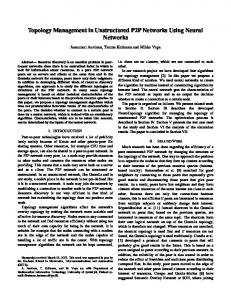
Fig. 1.
Part of the overlay network of our model. Shaded peers inside the bold dotted line represent Mi , while those inside the
thin dotted eclipse represent M j . Other peers (those with a file connected to them) also serve objects i or j
and data exchange and reducing the average distance to the objects. Replication can be performed in a variety of manners: Mirroring (Akamai), caching (web servers), CDNs, etc. In large scale unstructured P2P networks, peers usually operate on local knowledge, with variable up-times and no control over the induced topology or workload. Data availability and efficient data sharing dictate replication in this challenging environment. P2P file-sharing applications implicitly handle replication through object sharing. Some systems force users to maintain the new replicas for the benefit of other users. However, this does not tackle the issue of real-time replication adaptive to the current workload. In this work, we present APRE (Adaptive Probabilistic REplication), a replication method based on soft-state probabilistic routing indices. Our approach focuses on providing an adaptive solution to the problem of availability together with minimizing the instances of server overloads and serious service degradation. We intend for our system to “expand” and “contract” its resources according to the workload as perceived locally. New replicas are created in areas of high demand in the overlay, thus disposing of the need of advertising them. Moreover, this will be done in a completely decentralized manner, with minimal communication overhead and using absolutely affordable memory space per node. A. Our Framework First, we describe our framework for resource-sharing in an unstructured P2P network. We intend to present a model as general and realistic as possible, avoiding many unnecessary assumptions.
3
We assume a pure Peer-to-Peer model, with no imposed hierarchy over the set of participating peers. All of them may serve and request various objects. Each peer locally maintains its own collection of objects, as well as a local view of the system. Ignoring physical connectivity and topology from our talk, we generally expect peers to be aware of their one-hop neighbors in the overlay, while maintaining any other protocol-specific information (e.g., search indices, routing tables, etc). The system is expected to exhibit a dynamic behavior, with peers entering and leaving at will and also inserting/removing objects from their repositories. The overlay structure will also be affected, since nodes are not guaranteed to connect to the same neighbors each time. As a motivating example, assume an unstructured P2P system, where peers share and request replicated resources. Objects are assumed to be requested regularly, e.g., results of a live sports meeting, weather maps, security updates, real time aggregated statistics, software, etc. There exist some nodes (similar to the web servers or mirror sites in the Internet) that provide with fresh content, but their connectivity or availability varies, as happens with all other network nodes. Peers that are interested in retrieving the newest version of the content conduct searches for it in order to locate a fresh or closer replica. Figure 1 gives a graphic representation of our system. For each object i, there exists a set of peers called the server set Si = {si1 , si2 , . . . , sik } that serve the specific object. These are the nodes that, at a given time, are online, store object i and are willing to share it. A subset of Si , the mirror set Mi ⊆ Si (the shaded peers) represents the set of peers that, if online, always serve i. This does not imply that all peers in Mi will always be online, their connectivity in the overlay will remain the same, or that they will never refuse connections. But we can assume, without loss of generality, that these nodes will be mostly available. Our assumption is not unrealistic: Imagine that these servers can represent mirror sites/authority nodes that provide with up-to-date content. Nevertheless, they are not guaranteed to be always on-line, nor do they provide similar services. Apart from the mirror set, other peers that already host or have recently retrieved an object can serve requests for it (nodes with files attached to them in Figure 1). A server set comprises of these nodes plus the corresponding mirror set. Naturally, peers may belong to server or mirror sets for multiple objects. While this is a symmetric environment, it is clear that nodes will exhibit different sharing abilities. A variety of parameters, including available storage, CPU power, popularity of stored objects, system workload, connectivity, etc, contribute to this fact. Some of these factors remain more or less static over time (e.g., processing power or the maximum available bandwidth of a host), while others change
4
dynamically. Whichever the case, it is safe to assume that each peer in such a system will impose a limit on the services it can provide to other peers. This is something that is already utilized by several file-sharing applications (e.g., Kazaa [19]), FTP servers, etc. There exist a variety of metrics that can be used to realize those limits, for example the maximum number of concurrent connections, upload bandwidth, number of shared files, rate of received requests, etc. In this work, we focus on two of these parameters, namely workload and object popularity as they are manifested through a single observable quantity, the request rate λ. It is obvious that servers of popular (or temporally popular) items receive a larger number of requests, which can possibly affect their sharing ability as well as the system’s behavior. Given this general framework, our goal is to design and implement a replication protocol that will provide efficient sharing of objects (in terms of providing low load operation), scalability and bandwidth-efficiency. APRE is a distributed protocol that automatically adjusts the replication ratio of every shared item according to the current demand for it. By utilizing inexpensive routing indices during searches, loaded servers are able to identify “hot” areas inside the unstructured overlay with a customizable push phase. Selected nodes create replicas, sharing part of the load. Under-utilized servers are able to host different content. The rationale behind APRE is the tight coupling between replication and the lookup protocol which controls how searches get disseminated in the overlay. By combining the Adaptive Probabilistic Search (APS) state with APRE, we are able to identify (in real-time) “hot” or “cold” lookup paths and avoid the need of advertising new replicas. We show that this method proves very efficient in a variety of metrics and environments and is fully customizable. The rest of this report is organized as follows: Section II summarizes our work in probabilistic searching and content dissemination which is the basis of APRE. In Section III we describe our protocol in detail and extensive results are presented in Section IV. Finally, Sections V and VI contain our related work and conclusions respectively. II. P ROBABILISTIC R ESOURCE L OCATION A. Probabilistic Search We now briefly describe the APS [37] search method, upon which our replication scheme is based. In APS, each node keeps a local index consisting of one entry for each object it has requested per neighbor. The value of this entry reflects the relative probability of this node’s neighbor to
5
Indices Initially After walkers finish After the updates A→B 30 20 20 B→C 30 20 20 C→D 30 20 20 A→E 30 20 40 E→F 30 20 40 A→G 30 30 30 Fig. 2. Node A searches for an object stored at node F using APS (pessimistic) with two walkers. The table shows how index values change. X→Y denotes the index value stored at node X for neighbor Y relative to the requested object.
be chosen as the next hop in a future request for the specific object. Searching is based on the deployment of k independent walkers and probabilistic forwarding. Each intermediate node forwards the query to one of its neighbors with probability given by its local index. Index values are updated using feedback from the walkers. If a walker succeeds (fails), the relative probabilities of the nodes on the walker’s path are increased (decreased). The update procedure takes the reverse path back to the requester and can take place either after a walker miss (optimistic update approach), or after a hit (pessimistic update approach). Figure 2 shows an example. APS exhibits many plausible characteristics as a result of its learning feature. Every node on the deployed walkers updates its indices according to search results, so peers eventually share, refine and adjust their search knowledge with time. Walkers are directed towards objects or redirected if a miss or an object deletion occurs. APS is also bandwidth-efficient: It induces zero overhead over the network at join/leave/update operations and displays a high degree of robustness in topology changes. III. O UR “E XPAND -C ONTRACT ” T ECHNIQUE APRE is based on two basic operations: Expansion and Contraction. These are shown pictorially in Figures 4 and 5 respectively. Our main goal is to provide a completely decentralized mechanism through which the system will adaptively expand its replica size when demand is increased and will shrink when demand will fall. The high-level behavior of our system can be described using a simple model (Figure 3): In normal mode, nodes can adequately serve requests and also retrieve objects. As load increases, some may reach their self-imposed limits. By invoking the Expand process, we aim at bringing the node status back to normal and lower the average load for a specific object inside an area.
6
Contract
Expand
Peer Load
Overloaded Normal Operation Under−utilized Contract
Fig. 3.
State transitions in our system
Normal operation and load balancing will not be necessarily achieved simultaneously. Consider, for example, that a peer initiating Expand may receive requests for multiple objects. Expanding in respect to one of them will probably lower its load, but will not necessarily bring its level back to normal. As load decreases, nodes can free up space (and the respective resources) and thus share a bigger portion of the available workload. Let us now discuss why the system would benefit from those two operations. When parts of the server set Si receive too many requests, the following may occur: Clients’ connections get refused, while servers receive an increasing amount of requests and their performance deteriorates. Both groups would benefit from an increase in the number of replicas available, especially if those replicas were placed inside the areas of high demand in the overlay. Conversely, consider that one or more subsets of Si have recently received very few requests for object i. This practically means that a potentially large amount of their storage space is underutilized. They could remove the document to free up space or replace it with another document of high demand. We have to stress here the point that the system will not force any peer to store or serve an object until this becomes necessary; Only peers that have already retrieved the document, or have available storage can play that role. Contract will also be invoked when a peer is called to join Si but cannot do so without exceeding its limits (e.g., maximum sharing capacity). Note that peers can still choose to reject a certain action, for example refuse to deactivate an object in order to serve a new one. Figure 4 shows an example of our system expanding in response to increased demand for a specific object. On the left we see some initial server set (gray oval) and the demand for i (arrows from various parts of the network). Servers in two areas are overloaded with requests, thus forcing extra replicas in those two areas to be activated for sharing. Si expands, as we see on the right
7
Fig. 4.
Expansion
Algorithm 1 Expand 1: if Replica i at node x reaches its limit then / 2: P ← FindPossibleServers(i); {P ∩ Si = 0} 3: Activate i at Y ⊆ P 4: end if
part of the picture, in response to the demand and replication status for object i. Similarly, Figure 5 shows that the two white areas of the server set (the area inside the dotted line) do not receive requests for object i. This leads to the contraction of Si which is now the gray oval on the right part of the figure. Algorithms 1 and 2 presents a high-level description of how these two methods would work. Our goal is to achieve a system behavior that resembles the buffer management techniques in databases: Viewing the P2P network as a large buffer, we want to decide (in a distributed manner) the ratio of object presence in the buffer according to user-specified queries (i.e., workload). A. Protocol Implementation In this section we describe the actual implementation of the APRE protocol as described by the expand-contract algorithms. We assume that servers measure load and perform replication on a per object basis (similar to lookup and reverse indices). Vital to the success of our scheme are the following points: 1) Mechanism to identify when an object is “hot” (many requests) or “cold” 2) Mechanism to create replicas inside high-demand areas 3) Minimization of communication inside Si The conditions of line 1 in Algorithms 1, 2 describe when Expand or Contract are initiated. We believe that each peer can independently choose when to initiate an expansion or when to deactivate a replica. Therefore, there is no need for any message exchange between peers inside
Si .
8
Fig. 5.
Contraction
Algorithm 2 Contract 1: if (Replica i at node x is under-utilized) or (x receives Activate(x, j)) then 2: i ← ChooseOb ject(); {i is among the candidates for eviction} 3: DeactivateReplica(i); 4: if (x received an Activate(x, j)) then 5: ActivateReplica( j); 6: end if 7: end if
We assume that each server s advertises the maximum number of requests that replica i can up
accept per time unit Limit s,i . If it receives less than Limit down requests for object i, this replica is s,i deactivated/deleted from the node’s cache without any further communication. Alternative measures such as the maximum number of allowed connections can be used. If the replica cannot sustain its advertised rate, then it may choose to advertise a new maximum capacity. Obviously, the total up
maximum capacity for server s is equal to ∑ Limit s,i . Function ChooseObject decides at each i∈s
point which object should be evicted at nodes that have reached their storage capacities. Natural choices are to have the new replica replace the least recently used one or the least popular one. In order to identify “hot” areas inside the overlay, we utilize part of the state that AGNO [9] builds during searches: After some queries take place, paths with large index values connect the requesters to the content providers (see Fig. 6). In AGNO, we use these paths (plus some extra state) to relay messages from content-holders directly to interested peers. In this problem, paths with high index values are used to identify “hot” areas inside the overlay (i.e. locate subset Y ). In short, peers store reverse index values for each of their neighbors. These represent the APS index values that their neighbors hold relative for them and are piggybacked during searches (see Figure 7). Reverse indices can be used to contact nodes inside query-intensive areas in an unstructured overlay. They represent a measure of how useful a peer is for finding an object according to its neighbors. Overloaded servers issue a special message which is forwarded either
9
E
A 10 E 150 Y2 40 Y5 90
D
B 50 C 100 10 D 20 E Reverse Indices
A
B
A 50
Fig. 6. Visual representation of a sample power-law graph, after several searches for a single object using the APS method. Solid line arcs show high index value links between nodes
A
20
D
90
Z2
10
B 60 C 220 30 D 30 E
C A 100 X1 30 X2 90 ... ...
Fig. 7. Node A has four neighbors who obtain index values as the white tables show. The blue table depicts the reverse index values stored at node A
probabilistically or to the top-k neighbors according to the stored reverse index values. Each node on the path independently decides whether it will join Si according to the implemented replication policy. This phase continues with nodes passing this message over in a similar fashion, until either their T T L value reaches zero or a duplicate reception (due to a cycle) occurs. Figure 8 shows an example of our scheme at work: Black nodes represent requesters of the item held at the middle node. Directed APS searches are depicted by arrows. In the push phase, paths with high index values are visited (links with dotted lines). The new shaded nodes with bold outline represent possible replicas created. Reverse indices get updated during searches, but this is not enough: There may be peers that have searched for an object and built large index values in the past, but are no longer interested in it. If searches are no longer routed through those peers, the respective reverse index values will not be updated and will remain high. Thus, our scheme could erroneously consider such nodes as candidates for replication. To correct this situation, we add an aging factor to the reverse indices, which forces their values to decrease with time. Peers now keep track of the time that a reverse index was last updated in order to acquire its correct value before using it. When a peer receives a search message, it sets the corresponding reverse index to the piggybacked value and its last modified field to the time of receipt. We describe this process in Figure 9. The value of the index decreases exponentially, while two searches at times t1 ,t2 reset its value. A push message received at time t3 will use the value as shown in the figure. The last modified value is also reset when a reverse index is used, since a peer computes its current value before using it.
Reverse Index Value
10
t t0 Fig. 8. After searches take place, reverse index values are updated and new replicas can be created inside areas of high demand
t1
t2
t3
Fig. 9. Example of exponential decay in the reverse index values
Each node on the path independently decides whether it will join Si according to our replication policy. Currently, we have implemented three: FurthestFirst, ClosestFirst and Uniform. In the first policy, the probability of a node joining Si increases with the message distance, while the opposite occurs in ClosestFirst. All nodes are given the same chance in Uniform. After Y has been identified, replicas are transmitted and activated. In order for APRE to adapt to various workloads and avoid system oscillation due to replicas with perceived load a little above or below the limits frequently entering and leaving Si [29], we introduce a scaled replication policy. In effect, we define 3 different intervals that relate to the up
amount of overloading D = λi − Limiti . Servers individually estimate λi , the rate of requests for object i measured locally. Each interval has TTL probability values associated with it, one for each hop distance. These values increase as D falls into higher number intervals. Thus, a heavily overloaded server will create more replicas than a less overloaded one and marginally overloaded peers will not alter Si significantly. IV. R ESULTS We test the effectiveness of APRE using a message-level simulator written in C. Object requests occur at rate λr with exponentially distributed inter-arrival times. At each run, we randomly choose a single node that plays the role of the initial Mi ≡ Si set and a number of requesters, also uniformly at random. The requester set is periodically altered by 10%. Results are averaged over several tens of runs. We utilize 10,000-node random and power-law graphs with average node degrees around 4 (similar to gnutella snapshots [27]) created with the BRITE [22] and Inet-3.0 [17] topology generators. To evaluate the replication scheme, we utilize the following metrics: The average load Λ which is the number of received requests per second for Si . Obviously, regarding our load-balancing
11
80
25
Load(qu/sec)
20 15
1170
1425
1848
60
1510 2691
10 192
1190
803 449
1535
5
340 644
0
Fig. 10.
4000
2615
4000
1472
1044
314 576
4000 1356 2762
5
2981
50 40 30 20
4000
10 lambda(qu/sec)
APRE-FurthestFirst APRE-ClosestFirst Path-cache
70
% change in Si
APRE-FurthestFirst APRE-ClosestFirst Path-cache
10 15
20
Variation in Λ and |Si | over increasing λr values
0
Fig. 11.
5
10 lambda(qu/sec)
15
20
Percentage of change in Si per replication phase
requirement, we also need to measure its standard deviation σΛ . A high value for σΛ indicates that load is very unevenly balanced across Si . Besides the size of the server set, we also keep track of the number of replica activations/de-activations. Regardless of how low Λ and σΛ may be, frequent changes in Si incur huge overheads in terms of messages and bytes transferred. up
down ) = (18, 3) for all nodes and objects. APRE Parameters: We assume that (Limits,i , Limits,i
During each time step, server nodes estimate λr (within ε = 0.1) by counting the number of requests and estimating the number of different requesters involved. This value will be used to calculate the decay of the reverse indices (as described in [9]). During the Expand push phase, peers forward to the two neighbors with the largest reverse index values. We utilize a scheme with 3 distinct intervals for values of D: [0 − 5], (5 − 20], (20 − ∞). While we experimented with more fine-grained granularities, the results did not vary considerably. Finally, we assume no item can be replicated at more than 40% of the network nodes (maximum replication ratio). This external condition simulates the natural limitations in storage that exist in most systems. We compare our method against a random replication scheme as well as path-replication as applied by Freenet [4] and in effect by lar [12]. In the first case, we randomly create the same number of replicas as our method. In path replication (hence path-cache), each time a server is overloaded we replicate the object along the reverse path to the requester. In both cases, the APS method is used for lookups, while in path-cache replicas are also deactivated using our Contract scheme. Obviously, by varying the push method and the replication probabilities, APRE can behave either as path-cache, random, or in between with a variable rate of replica creation per workload. This allows for full customization according to the system’s primary objects, namely low load (more replicas) or space (replicas only where necessary).
0
Fig. 12.
200
400
600 Si
800 1000
200
400
600
Si
800
1000
200
400
600
1 00 000
.. ... .................... ........ ................. ....................... .... .............................. 10 .................. .... .. ..................................................... ........................ . .. . 1
.. ...... . Random .............. .......................... ....................... ...... .... ... ... ... ... ... .... .... ...... .. .....
10
. Path-cache
0
. APRE
10
Load (qu/sec)
.
10
100 .
0
12
800 1000
Si
Si load distribution for λr = 4/sec
A. Basic Performance Comparison For our default setting, we assume 2000 random requesters, with initial |Si | = 1 as we vary their λr . The results are presented in figures 10, 11. At each point in Figure 10, we annotate the respective |Si | value. APRE effectively expands Si in order to accommodate increased demand and manages to keep all servers into the Normal Operation zone, well below Limit up (identified by the bold horizontal line). Our first observation is that FurthestFirst achieves lower Λ values by creating more replicas than ClosestFirst. Downstream paths during the “push” phase contact an increasing number of nodes as their distance from the initiator increases, thus giving FurthestFirst an increased probability of replication. Path-cache exhibits a steeper increase in Λ and fails to keep its value within the acceptable region for large λr . Choosing only successful walks to replicate along, quickly “saturates” the frequently used paths with replicas. Increased demand merely forces the algorithm to utilize a few more paths, which is the reason why this method fails to increase the replica set to meet the limits. It is interesting to note that APRE exhibits small σΛ values, ranging from 3.9 to 16 only in the highest λr setting. These values are either smaller or at most comparable to Λ, a good indication of load balancing. On the other hand, randomly placing the same number of replicas yields a very poor load-balancing result, with σΛ values 2 orders of magnitude higher. This is also a clear indication of the need for correct placement inside structureless multi-path overlays. While a low deviation from the mean value is desired, it is also important that only few peers are documented as operating above their limits. Figure 12 shows the load distribution of every server s at a random point in time (λr = 4/sec). Servers are sorted in decreasing order of load. While APRE, path-cache have similar Λ, σΛ values, our method exhibits a less steep curve and, more
13
100 APRE-FurthestFirst APRE-ClosestFirst Path-cache Random
90 % of overloaded Si
80 70 60 50 40 30 20 10 0
Fig. 13.
5
10 lambda (qu/sec)
15
20
Ratio of overloaded servers
importantly, has only 3 servers above Limit up , compared to 54 for path-cache. Random replication causes extremely unbalanced load. Figure 13 displays the average percentage of overloaded servers at any time for all three methods. Our technique clearly outperforms the two competing methods by having 2-6 times fewer overloaded servers than path-cache. Replicating closer to requesters creates, as we saw, more service points, thus marginally reducing the number of overloaded instances for FurthestFirst. Random exhibits very poor performance which is partly undone as demand increases. This is exclusively due to the learning feature of APS. Moreover, we show that APRE achieves a much more robust replication. The stability of the server population constitutes an important metric to the evaluation of a replication scheme. This is measured by the average ratio of new replicas entering Si per replication phase over the size of Si . Obviously, a large percentage of new content creation is highly undesirable, as it burdens network and local resources. Figure 11 shows that APRE is particularly robust, altering at most 3% of Si per push phase, while Path-cache oscillates and performs poorly in most runs. The same experiment is repeated with 5,000 requesters, which constitute 50% of the overlay (see Figures 14 and 15). APRE again keeps the system within its limits, except for the two cases where even the largest replica set cannot achieve that (75k and 100k total queries per second). Figure 15 exhibits why ClosestFirst is a preferred strategy over FurthestFirst in these settings: Besides creating more replicas, in conditions of very high demand load is less evenly distributed among the server set (see the embedded graph in Figure 15). Still, our method shows remarkable stability in the Si population for both strategies, while Path-cache exhibits even worse performance
14
3068 2730
40 3999
25 Load
3997
2528
20
3999
2340
3998
2122
15 1704
10 531040 01088
2219
5 772 1583
3210
687
0
2874
3355
3703 3999
% of change in Si
APRE-FurthestFirst APRE-ClosestFirst Path-cache
30
3997
10 lambda
15
20 10 5
20
0
20
Fig. 14. Variation in the average load vs. variable λr (5000 requesters)
10 15 lambda(qu/sec)
20
5
10 lambda(qu/sec)
20
15
Fig. 15. Percentage of change in Si and σΛ vs. variable λr (5000 requesters)
60
4000
10 qu/sec 8 qu/sec 4 qu/sec 2 qu/sec
50 40 30
10 qu/sec 8 qu/sec 4 qu/sec 2 qu/sec
3000
|Si|
Load (qu/sec)
30
30
10
3999
5
50
APRE-FurthestFirst APRE-ClosestFirst 40 Path-cache load STD
50
35
2000
20 1000
10 0
Fig. 16.
100 200 300 400 500 600 700 800 900 1000 Time (sec)
100 200 300 400 500 600 700 800 900 1000 Time(sec)
Λ and |Si | over time for 5000 requesters and multiple λr values
than before. Finally, Figure 16 shows how Λ and |Si | vary with time, using ClosestFirst. For all values of λr , APRE manages to bring Λ to a steady state in few time steps, a state which is hence maintained with almost no deviation. The same is true for the size of Si , with the exception that for high total demand, it takes longer to reach the steady state. This is due to the fact that even more paths are now utilized, with reverse index values increasing besides the originally “hot” ones. Table I summarizes our observations for this setup by showing the performance of the two schemes for the remainder of our metrics. APRE achieves very high success rates in lookups keeping bandwidth consumption steadily low in all runs. The same holds for the messages produced during Expand. Finally, replicating inside query-intensive areas allows for an active reduction to the average hop-distance from requesters to servers.
15
TABLE I P ERFORMANCE C OMPARISON UNDER A VARIETY OF METRICS (5000 R EQUESTERS ) λr = 1/sec
λr = 4/sec
λr = 8/sec
λr = 15/sec
λr = 20/sec
ClosestFirst
Success(%) SearchMesg ReplMesg PathLength
90.2 9.6 41.7 3.4
95.8 7.8 39.7 2.2
98.4 7.8 39.2 2.0
99.0 7.9 39.3 2.0
99.9 7.8 39.4 1.9
FurthestFirst
Success(%) SearchMesg ReplMesg PathLength
91.6 9.6 40.4 3.2
99.0 8.1 38.4 2.0
99.4 8.0 38.4 1.9
99.9 8.1 38.3 1.9
99.9 8.0 38.2 1.8
Path-cache
Success(%) SearchMesg PathLength
87.8 10.2 3.6
97.8 8.4 2.5
98.6 7.9 2.2
99.0 7.6 2.1
99.0 7.7 2.0
Method
B. Flash Crowds In the previous section we established our basic premise, replication along high demand paths in the overlay proves an effective and highly robust solution in a variety of metrics and workloads. Although our method does not explicitly offer load-balancing, it achieves a well-proportionate load distribution. We also showed that our method is advantageous to randomly replicating inside the network or merely choosing a single path and fully replicate along it. In the first case, few replicas receive the majority of requests, while in the second case, a large amount of replicas get deactivated and re-activated each time. In the next experiment, we examine the behavior of our method when we experience a sudden surge in the workload. This is often referred to as a flash crowd, an unexpected rise in requests towards specific item(s), typically due to some newsworthy event that just took place. Flash crowds have been regularly documented in web traffic history (e.g., September 11th) and are known to cause severe congestion at the network layer. Requests may never reach content servers while others do so with significant delays, caused by packet loss and retransmission attempts. Content holders are unable to handle the volume of requests while end-users experience long delays and failures in their queries. To simulate a similar situation, we start our system with 500 requesters querying at rate λr = 2/sec. At time t=401sec, 10 times as many requesters start querying for this item at rate λr = 12/sec. The parameters return to their initial values at time t=601sec. On average, the total demand during the flash-crowd period increases by a factor of over 70. Note that this is the worst case scenario, when simultaneously both requesters and rates increase. We present the variations in Λ
16
30
.. ..... . . ...
4000
APRE Path-cache
... ....... .......... ........ ................ .. . . .
3000
2000
10
0
1000
....................
0
100 200 300 400 500 600 700 800 900 1000 Time (sec)
30
..
....................
100 200 300 400 500 600 700 800 900 1000 Time(sec)
4000
. . ..
APRE Path-cache 3000
..
APRE Path-cache
20
.... .................... ..........................
|Si|
Load (qu/sec)
APRE Path-cache
20
|Si|
Load (qu/sec)
..
2000
10
1000
0
Fig. 17.
100 200 300 400 500 600 700 800 900 1000 Time (sec)
.................... ..........................
0
200
400 600 Time (sec)
800
1000
Effect of flash crowds in Λ and Si in two different settings
and |Si | in the first 2 graphs of Figure 17. APRE promptly manages to meet the surge in requests by increasing the replication ratio by a factor of 30. Excluding a very short window due to our mechanism’s response, our method succeeds in keeping the load factor below the limit (with σΛ < 10) and steady through time. At both moments of load change, replicas are activated and de-activated rapidly to meet the extra requests or reduced traffic. While path-cache shows similar response speed, it creates more servers in the low-workload period and less than the minimum number required to keep content providers from overloading during the surge. The next two figures show how the same two metrics vary in a more challenging flash-crowd setting. Here, we initially set |Si | = 500, λr = 1/sec, while for time t ∈ (400, 480] we set |Si | = 5000, λr = 10/sec. On average, the workload inside the overlay increases by a factor of 120. Our results show that, even for shorter and steeper changes, APRE very successfully adapts to the surge in requests. On average, Si is expanded by a factor of 175 in order to reduce and balance load (our results document an average σΛ ' 8.6).
17 1 5000requ, ClosestFirst 2000requ, ClosestFirst
0.9 0.8 0.7
G
0.6 0.5 0.4 0.3 0.2 0.1 0
Fig. 18.
2
4
6
8
10 12 lambda (requests/sec)
14
16
18
20
Average value of the gini coefficient G as a function of λr for the ClosestFirst strategy
C. Measuring the Degree of Load-Balancing The Gini coefficient (or Gini ratio) G is a summary statistic that serves as a measure of inequality in a population [7]. The Gini coefficient is calculated as the sum of the differences between every possible pair of individuals, divided by the mean size: n
n
∑ ∑ |xi − x j |
G=
i=1 j=1
2n2 µ
,
where n is the number of observations, whose values are given by xi , and µ =
∑ni=1 xi n
is their
mean. The Gini coefficient has been used as a measure of inequality in size and fecundity in plant populations in numerous studies (e.g., Weiner 1985, Geber 1989, Knox et al. 1989, Preston 1998). Recent work [36] proposed its use as a load-balancing metric. Assuming our population comprises of the number of received requests for each replica, we calculate the value of G as an additional index of load distribution among servers. Note here that a low value of G is a strong indication that load is equally distributed among them, but it does not necessarily mean that this load is low. Figure 18 shows the average values of G for all different values of request rates and both numbers of requesters (2k and 5k). In low-load runs servers show very similar loads. As the total load increases (either through an increase in λr or |Si |), so does the inequality between the received requests. The authors in [36] identify that G < 0.5 presents very well-balanced configurations, while when G is approximately between 0.5 and 0.65, relatively fair distributions are achieved. Our scheme, while not explicitly providing any mechanism to balance load inside Si , manages to provide very well-balanced configurations for medium to low loads and fair ones for medium to high loads.
18 40
10000 Max Repl = 1 Max Repl = .8 Max Repl = .4 Max Repl = .2 Max Repl = .1
9000 8000 7000
32 28 24 Load
|Si|
6000 5000
16
3000
12
2000
8
1000
4
0
2
4
6
8 10 12 Lambda (requests/sec)
14
16
18
0
20
Fig. 19. |Si | variation for different maximum allowed replication ratio 1
2
4
6
8 10 12 Lambda (requests/sec)
14
16
18
20
Fig. 20. Λ variation for different maximum allowed replication ratio 10
Max Repl = 1 Max Repl = .8 Max Repl = .4 Max Repl = .2 Max Repl = .1
Max Repl = 1 Max Repl = .8 Max Repl = .4 Max Repl = .2 Max Repl = .1
8
% change in Si
0.8
% of overloaded Si
20
4000
0.6
0.4
0.2
0
Max Repl = 1 Max Repl = .8 Max Repl = .4 Max Repl = .2 Max Repl = .1
36
6
4
2
2
4
6
8 10 12 Lambda (requests/sec)
14
16
18
20
Fig. 21. Percentage of overloaded nodes for different maximum allowed replication ratio
0
2
4
6
8 10 12 Lambda (requests/sec)
14
16
18
20
Fig. 22. Percentage of change in Si for different maximum allowed replication ratio
The reason for that is because the push phase (thus, by extension, the creation of new replicas) operates symmetrically on multiple (k) high-quality paths. So, neither the originating server gets starved of requests, nor the newly established ones differ substantially in their positioning. Only when |Si | reaches our artificial limit of 4000 peers we notice that load allotment gets uneven. up
D. Effect of the Maximum Replication Ratio and Limits,i
Our default scenarios assumed a set value of 0.4 × N for the maximum allowed |Si | (where N = 10k = size of our overlay). In the next figures, we show how the performance of APRE using ClosestFirst varies while we vary the maximum allowed ratio from 0.1 to 1.0. Too small values should force the system to quickly saturate while complete freedom to replicate should exhibit the best behavior. The results are presented in Figures 19, 20, 21 and 22 When the ratio is too small (at most 1000 nodes are allowed to host the object), Si quickly
19 1
40 limit_up = 10 limit_up = 18 limit_up = 30
36 32
0.8
% of overloaded Si
28 24 Load
limit_up = 10 limit_up = 18 limit_up = 30
20 16
0.6
0.4
12 0.2
8 4 0
0
2
Fig. 23.
4
6
8 10 12 Lambda (requests/sec)
14
18
16
20
2
4
6
8 10 12 Lambda (requests/sec)
14
16
18
20
Fig. 24. Percentage of overloaded nodes for different values up of Limits,i
up
Λ variation for different values of Limits,i
up
reaches this limit. This affects the values of Λ as well as the number of servers over Limits,i , which rapidly increase. As more peers are allowed to become servers, |Si | increases and so does the percentage of servers above the limit. The interesting observation here is that even for the most optimistic case (no replication restriction), APRE manages to keep the ratio of change in the server-set below 3%. up
In the next experiment, we vary the maximum advertised capacity Limits,i uniformly. Sample results are presented in Figures 23 and 24. As we would expect, the smaller the upper limit gets, the faster our algorithm reacts to load, thus creating replicas sooner. Obviously, given some storage restriction (such as a maximum allowed up
number of peers able to enter Si ), small Limits,i values cause system saturation and more overloaded instances. On the other hand, for larger upper limits, the server-set increases more gracefully and significantly fewer server overloads are observed. E. Other Experiments We test our method on a set of 4,000-node power-law graphs created with Inet-3.0 generator [17]. These graphs have an average degree of d = 4.3 (maximum degree equals to 855), while over 30% of the nodes have only one neighbor. Figure 25 shows how Λ varies with time for both replication strategies used in APRE using 1000 or 2000 nodes as requesters. These topologies noticeably affect performance compared to our previous tests. Even for averagerange λr values, Λ moves close to the overload line, while expansion shows diminished ability to extend Si . This is consistent with results documented in previous work [37]. The tested topologies
20
40 35
Load (qu/sec)
30
FurthestFirst-2k requ ClosestFirst-2k requ FurthestFirst-1k requ ClosestFirst-1k requ
25 20 15 10 5 0
Fig. 25.
100 200 300 400 500 600 700 800 900 1000 Time (sec)
Average load for 1k and 2k requesters in power-law topologies (λr = 6/sec)
offer fewer paths between servers and clients, while a large percentage of the nodes only have one neighbor. This also explains why FurthestFirst outperforms ClosestFirst. Favoring replication close to the requesters quickly saturates available nodes due to lack of alternate paths. Nevertheless, its is worth to notice that our method still manages to keep Λ at lower levels. Even at the 2k-ClosestFirst run, where Λ > Limit up , 14% of the servers are overloaded compared to 20% by path-cache. We must note here that the replication protocol is not always responsible for overloaded servers. In many occasions, the amount of demand (query-intensive areas have been saturated) or the overlay connectivity (e.g. power-law overlays) cannot allow for more extensive or balanced replication. As we experiment with more densely connected graphs, APRE performs inside the load limits where it failed to do so over more sparse overlays. Moreover, with biased forwarding, as happens with most informed approaches, certain nodes will unavoidably receive a bulk of requests. This situation can only be corrected through maintaining additional state at each peer (such as the location of other servers) and changing the forwarding scheme. In an environment with rapid changes in both workload and Si , this locally maintained metadata can become frequently stale, thus incurring larger communication (besides the local storage) overhead. Our approach, on the other hand, does not require a change in APS, but relies on its ability to independently create and store that state through new object discoveries and reverse index built-up. V. R ELATED W ORK Replication is a well-known technique utilized to achieve high availability and fault-tolerance in large-scale systems. While applied to a variety of contexts, we focus in the area of distributed
21
(P2P) systems. Structured overlays (DHTs) balance routing between network nodes, due to the nature of the hashing functions used. Moreover, in systems like CFS [6] and PAST [30], each item (or chunk of it) is replicated on a set number of network nodes. DHTs take advantage of the routing structure, which in effect allows for almost-deterministic paths between two nodes, thus identifying “hot” areas easily. Nevertheless, DHTs are not optimized for skewed access patterns and direct such traffic to few nodes responsible for popular content. DHash [2] is a replication method applied on Chord [35]. The protocol allows for r copies to be stored at the r immediate successors of the initial copy’s home. In [38], the authors propose the storage of at most R replicas for an object. Their location is determined by a hash function, allowing requesters to pro-actively redirect their queries. The work in [33] proposes replicating one hop closer to requester nodes as soon as peers are overloaded. Lar [12] is a DHT-based approach similar to APRE, in that it adapts in response to current workload. Overloaded peers replicate at the query initiator and create routing hints on the reverse path. Hints contain some other locations that the content has been previously replicated, so queries are randomly redirected during routing. The method takes advantage of the DHT substrate in order to place the hints. Our scheme does not attempt to re-route queries or shed load to the initiator, but rather places replicas inside forwarding-intensive areas using multiple paths. Moreover, the state kept is accessible at any time, not only at the time of the query arrival. HotRoD [36] presents a load-balancing approach for DHTs handling range queries in RDBMSs. It is based on a locality-preserving DHT and replication of overloaded arcs (consecutive modes on the DHT ring). [25] employes minimization function that combined high availability and low load to replicate video content inside a DHT. The approach requires knowledge of peer availabilities, workload and data popularity. In [29], the authors show that load-balancing based on periodic load statistics suffer from oscillation. By directing queries towards the the maximum capacity replica store, they show that both heterogeneity and oscillation issues are tackled. This method, nevertheless, assumes prior contact of an authority server which provides with a list of existing replicas. Moreover, replicas regularly advertise their maximum capacities to the network. In most P2P file-sharing applications, replication is naturally handled through content sharing among users. In general, the following two approaches exist: Files comprise of equal size chunks and are individually indexed, or peers dynamically decide the portion that is retrieved from each source peer. The first approach is utilized by Overnet [24], BitTorrent [5] and Slurpie [31]. Each
22
file is divided into a number of standard-size fragments (9500KB, 256KB, 256KB for those systems respectively). A peer may then download different fragments from various sources. Upon completion, each fragment becomes available for sharing with other nodes. The second approach [28] (or modifications of it [1]) is currently used by other P2P applications (e.g., Morpheus [23]). A requester contacts many source peers and retrieves small portions of the file from each of them. When each small chunk is retrieved, more is asked from that specific source. There also exist several schemes (e.g. [20], [26]) which allow for increased robustness in reconstructing a file by receiving a few extra parts of it. There has also been considerable amount of work on flash crowd avoidance. In [10], overloaded servers redirect future requests to mirror nodes to which content has been pushed. This approach does not tackle the issue of which node to replicate to. PROOFS [34] explicitly constructs a randomized overlay to locate content under heavy load conditions or unwilling participants. In effect, the method relies on the combination of custom overlay creation and a gossiping lookup scheme to locate objects and does not involve replication. Finally, the work in [21] discusses static replication in unstructured networks, given content popularity and random walks as a lookup method. VI. C ONCLUSIONS In this report we presented our adaptive replication scheme for unstructured Peer-to-Peer systems based on probabilistic soft state. APRE aims at providing a direct response to workload changes, by creating server points in needy areas or releasing redundant replicas in areas of low demand. Our approach couples lookup indices together with an aging mechanism in order to identify, in real time, query intensive areas inside the overlay. Peers then individually decide on the time and extent of replication, based on local workload computation. Our work shows that it is important to couple replication with the search protocol in unstructured systems. Random replication performs poorly with informed lookup schemes, unless extra state is added to enhance searches. Applying APRE over a scheme such as APS mitigates this problem. APS-indices store local, per-object state to direct queries to objects. While peers only keep metadata about their neighbors, this information can be used to identify, hop-by-hop, where the queries are coming from. Moreover, our scheme is highly customizable allowing control of both the size and the location (as defined through reverse-indices) of replication.
23
Through thorough simulations, we show that APRE is extremely robust in eliminating server overloads while minimizing the communication overhead and balancing the load. Specifically, we show that replicating along the reverse path is an extreme case of our protocol. By effectively discovering all reverse paths, APRE manages to distribute content proportional to demand in a variety of overlays and workloads. Finally, we show that our method succeeds in creating a very stable server set with minimal amount of oscillation. VII. ACKNOWLEDGMENTS This material is based upon work supported by, or in part by, the U.S. Army Research Laboratory and the U.S. Army Research Office under contract/grant number DAAD19-01-1-0494 R EFERENCES [1] John W. Byers, Michael Luby, and Michael Mitzenmacher. Accessing multiple mirror sites in parallel: Using tornado codes to speed up downloads. In INFOCOM, 1999. [2] J. Cates. Robust and efficient data management for a distributed hash table. Master’s thesis, Massachusetts Institute of Technology, May 2003. [3] Y. Chu, S. Rao, S. Seshan, and H. Zhang. Enabling conferencing applications on the internet using an overlay muilticast architecture. In SIGCOMM, 2001. [4] I. Clarke, O. Sandberg, B. Wiley, and T. Hong. Freenet: A Distributed Anonymous Information Storage and Retrieval System. Lecture Notes in Computer Science, 2001. [5] Bram Cohen. Incentives build robustness in bittorrent, 2003. [6] F. Dabek, M. Kaashoek, D. Karger, R. Morris, and I. Stoica. Wide-area cooperative storage with CFS. In SOSP, 2001. [7] C. Damgaard and J. Weiner. Describing Inequality in Plant Size or Fecundity. Ecology, 81, 2000. [8] A. Datta, M. Hauswirth, and K. Aberer. Updates in highly unreliable, replicated peer-to-peer systems. In ICDCS, 2003. [9] D.Tsoumakos and N. Roussopoulos. AGNO: An Adaptive Group Communication Scheme for Unstructured P2P Networks. In Euro-Par, 2005. [10] P. Felber, T. Kaldewey, and S. Weiss. Proactive hot spot avoidance for web server dependability, 2004. [11] http://www.gnutella.com. Gnutella website. [12] V. Gopalakrishnan, B. Silaghi, B. Bhattacharjee, and P. Keleher. Adaptive replication in peer-to-peer systems. In ICDCS, 2004. [13] http://www.bittorrent.com/index.html. BitTorrent home page. [14] http://www.emule project.net/. eMule project. [15] http://web.icq.com/. ICQ web site. [16] S. Iyer, A. Rowstron, and P. Druschel. Squirrel: A decentralized peer-to-peer web cache. In PODC, 2002. [17] C. Jin, Q. Chen, and S. Jamin. Inet: Internet Topology Generator. Technical Report CSE-TR443-00, Department of EECS, University of Michigan, 2000. [18] J. Kangasharju, K. Ross, and D. Turner. Secure and Resilient Peer-to-Peer E-Mail: Design and Implementation. In IEEE Intl Conf. on P2P Computing, 2003.
24
[19] http://www.kazaa.com. Kazaa website. [20] Michael G. Luby, Michael Mitzenmacher, M. Amin Shokrollahi, Daniel A. Spielman, and Volker Stemann. Practical lossresilient codes. In STOC, 1997. [21] C. Lv, P. Cao, E. Cohen, K. Li, and S. Shenker. Search and Replication in Unstructured Peer-to-Peer Networks. In ICS, 2002. [22] A. Medina, A. Lakhina, I. Matta, and J. Byers. BRITE: An Approach to Universal Topology Generation. In MASCOTS, 2001. [23] http://www.morpheus.com. Morpheus website. [24] http://www.overnet.com/. Overnet website. [25] W. Poon, J. Lee, and D. Chiu. Comparison of Data Replication Strategies for Peer-to-Peer Video Streaming. In ICICS, 2005. [26] Michael O. Rabin. Efficient dispersal of information for security, load balancing, and fault tolerance. JACM, 36(2), 1989. [27] M. Ripeanu and Ian Foster. Mapping the gnutella network: Macroscopic properties of large-scale peer-to-peer systems. In IPTPS, 2002. [28] Pablo Rodriguez and Ernst W. Biersack. Dynamic parallel access to replicated content in the Internet. IEEE/ACM Transactions on Networking, 10(4), August 2002. [29] M. Roussopoulos and M. Baker. Practical load balancing for content requests in peer-to-peer networks. Technical Report cs.NI/0209023, Stanford University, 2003. [30] A. Rowstron and P. Druschel. Storage Management and Caching in PAST, A Large-scale, Persistent Peer-to-peer Storage Utility. In SOSP, 2001. [31] Rob Sherwood, Ryan Braud, and Bobby Bhattacharjee. Slurpie: A cooperative bulk data transfer protocol. In IEEE Infocom, 2004. [32] Clay Shirky. What Is P2P ... And What Isn’t. OpenP2P.com, 2000. [33] T. Stading, P. Maniatis, and M. Baker. Peer-to-peer caching schemes to address flash crowds. In IPTPS, 2002. [34] A. Stavrou, D. Rubenstein, and S. Sahu. A lightweight, robust p2p system to handle flash crowds. In ICNP, 2002. [35] I. Stoica, R. Morris, D. Karger, F. Kaashoek, and H. Balakrishnan. Chord: A scalable Peer-To-Peer lookup service for internet applications. In SIGCOMM, 2001. [36] Theoni Pitoura, Nikolai Ntarmos, and Peter Triantafillou. Replication, Load Balancing and Efficient Range Query Processing in DHTs. In EDBT, 2006. [37] D. Tsoumakos and N. Roussopoulos. Adaptive Probabilistic Search for Peer-to-Peer Networks. In 3rd IEEE Intl Conference on P2P Computing, 2003. [38] M. Waldvogel, P. Hurley, and D. Bauer. Dynamic replica management in distributed hash tables. Technical Report RZ–3502, IBM, 2003.