mailing list to receive updates, if any, may send a request to the following address: AQMAN .... rather conceptualize aquifers with simple water mass balances.
AQMAN: LINEAR AND QUADRATIC PROGRAMMING MATRIX GENERATOR USING TWO-DIMENSIONAL GROUND-WATER FLOW SIMULATION FOR AQUIFER MANAGEMENT MODELING By L. Jeff Lefkoff and Steven M. Gorclick
U.S. GEOLOGICAL SURVEY Water-Resources Investigations Report 87-4061 Menlo Park, California 1987
DEPARTMENT OF THE INTERIOR DONALD PAUL HODEL, Secretary U. S. GEOLOGICAL SURVEY
Dallas L. Peck, Director
For additional information write to:
Copies of this report can be purchased from:
Regional Hydrologist, WR U.S. Geological Survey 345 Middlefield Road Menlo Park, California 94025
Books and Open-File Report U.S. Geological Survey Box 25425, Federal Center Denver, Colorado 80225 (Telephone: (303) 236-7476)
PREFACE This report describes a computer model that combines ground-water flow simulation with mathematical optimization in order to develop and evaluate aquifer management strategies. The computer program is intended for general application and may have to be modified by the user for specific field problems. Although the program will produce reliable calculations for a wide variety of problems, the user is cautioned that in some cases the accuracy of management solutions can be significantly affected by user discretion during implementation. The user is requested to kindly notify the originating office of any errors found in this report or in the computer program. Updates may occasionally be made to both the report and the computer program. Users who wish to be added to the mailing list to receive updates, if any, may send a request to the following address:
AQMAN U.S. Geological Survey 345 Middlefield Road, MS-421 Menlo Park, CA 94025 Copies of processing from:
the computer
program on
tape are available at cost of
U.S. Geological Survey WATSTORE Program Office 437 National Center Reston, VA 22092 Telephone: (703) 648-5686 The use of computer and software brand names in this report is for identification purposes only and does not imply endorsement by the U. S. Geological Survey.
CONTENTS
Abstract 7 Introduction 8 Ground-Water Management Modeling 10 Background 10 The response matrix method 10 General Problem Formulation for Linear and Quadratic Programs 13 Linear and quadratic objectives 13 Constraints and system linearity 14 Time parameters -15 Stress and response 16 Drawdowns 16 Gradients and velocities 16 Head, gradient, and velocity definitions 18 The MPS file and the solution 19 Problem Formulation with AQMAN 20 Objective function 20 Linear objective 20 Quadratic objective 20 Constraint set 23 Pumping and recharge constraints 23 Head constraints 24 Gradient and velocity constraints 26 Head and velocity definitions 30 Nonlinearities 34 Time parameters 34 The unit stress and scaling 36 Quadratic objective 37 The MPS file 37 User changes 37 MPS format conventions 37 Naming conventions 41 Size of the MPS file 42 Program Description 43 A^aiu " " " "" " " """ "" """ " "" "" " """ """ """ " """" """ "" " """" "" " "" """"»" "U Subroutine PRE 43 Subroutine CHKDAT---------------------------------45 Subroutine GRADS 45 Subroutine MPSFMT . . _.45 Subroutine QUAD Subroutine READ1 Subroutine WRITE 1
Data Files Sample Problem References Appendix I, Definition of VariablesAppendix II, Date File Instructions Appendix III, Quadratic Objective Subroutine FUNOBJAppendix IV, Data Files for Sample ProblemsAppendix V, AQMAN Program List
45 46 46
47 48 55 57 61 67 76 94
ILLUSTRATIONS
Figure 1. 2. 3a. 3b. 3c. 4a. 4b. 4c. 5. 6. 7. 8. 9. 10.
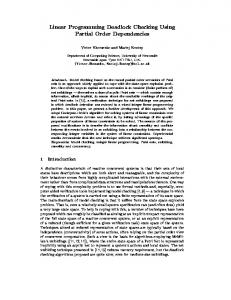
Managed and unmanaged potentiometric surfaces with several wells. Lift, potentiometric surface, and seepage velocity induced by a pumping well. MPS file written by AQMAN for the data shown in Table 1. There are three control locations, two decision wells, and one management period. Head definition is substituted at control location 1. Head constraint at location 1 is manually inserted. MPS file written by AQMAN for the data shown in Table 1 with velocity control added at control pair 1. Head definition is specified at velocity control pair 1 and 2. Velocity constraint at control pair 1 is manually inserted. The vector sum V of velocity controls 1 and 2. Organization of the MPS file. Flow chart showing major computations performed by AQMAN. Finite-difference grid for the sample problem (after Trescott and others, 1976). The sample problem, re-formulated with a response matrix. The re-formulated sample problem with four head definitions added.
LIST OF TABLES
Table
1.
Sample computations of manageable drawdown, and coefficients. The last two columns form the response matrix.
response
CONVERSION FACTORS
For convenience of readers who prefer to use metric (International System) units, conversion factors for inch-pound units used in this report are listed below: Multiply inch-pound unit
Bv
To obtain metric unit
foot (ft)
0.3048
meter (m)
cubic feet
0.02832
per second (ftVs)
cubic meter
per second (m 8/s)
ABSTRACT
A FORTRAN-77 computer program code that helps solve a variety of aquifer management problems involving the control of ground-water hydraulics is presented. It is intended for use with any standard mathematical programming package that uses Mathematical Programming System input format. The computer program creates the input files to be used by the optimization program. These files contain all the hydrologic information and management objectives needed to solve the management problem. Used in conjunction with a mathematical programming code, the computer program identifies the pumping or recharge strategy that achieves a user's management objective while maintaining ground-water hydraulic conditions within desired limits. The objective may be linear or quadratic, and may involve the minimization of pumping and recharge rates or of variable pumping costs. The problem may contain constraints on ground-water heads, gradients, and velocities for a complex, transient hydrologic system. Linear superposition of solutions to the transient, two-dimensional ground-water flow equation is used by the computer program in conjunction with the response matrix optimization method. A unit stress is applied at each decision well and transient responses at all control locations are computed using a modified version of the U.S. Geological Survey two dimensional aquifer simulation model. The program also computes discounted cost coefficients for the objective function and accounts for transient aquifer conditions.
INTRODUCTION
Numerical simulation models have become essential tools for hydrogeologists. Often models are utilized for evaluating different ground-water management strategies. Such strategies may be needed for aquifer management problems that involve: contaminant plume stabilization and removal coastal aquifer protection maximization of aquifer yields design of surface excavation dewatering systems development of policies for conjunctive use of surface and ground waters inspection of the impacts of water use regulation. The difficulty with trying to use simulation models to study these problems is that potential strategies can be tested only on a trial and error basis. There is no guarantee that the best alternatives will be discovered. Simulation by itself is valuable for understanding system behavior and in some cases for predicting future responses, but it is far less valuable as a tool for discovering optimal aquifer management strategies. In order to effectively determine viable and efficient aquifer management plans, simulation can be combined with optimization procedures of operations research. Operations research is a general field of applied mathematics that is concerned with optimal decision making. AQMAN is a FORTRAN-77 computer code that provides a link between groundwater simulation and two widely used techniques developed in operations research: linear programming and quadratic programming. These techniques provide a mathematical framework and efficient computational algorithms to determine the optimal allocation of scarce resources. Water, its cost of extraction, and the costs required to maintain its quality are the scarce resources of interest to the hydrologist. Combined simulation-management models can be used to identify pumping and recharge schedules that achieve some goal, such as minimizing ground-water production costs, while simultaneously protecting water quality and satisfying water demands. This procedure is known as aquifer management modeling. Aquifer management modeling is concerned with the best selection of well locations and pumping and recharge rates that achieves certain goals with regard to aquifer yields, drawdowns, hydraulic heads, hydraulic gradients, and ground-water velocities. It also can involve recharge through streambeds, ground-water flow to streams and lakes, maintenance of surface-water levels, and other interactions between surface water and ground water. Aquifer management modeling is a a multistaged procedure. First, a simulation model is developed for a particular field site. The hydrologic behavior of the site should be well understood. Second, a management problem is formulated. Third, the simulation model is used to generate a compact simulator -called a response matrix. Fourth, a special data file is created that contains the response matrix and represents the management formulation in a format that is required for solution by any of a number of available optimization codes. Fifth, a standard linear or quadratic programming code reads the special file and determines the optimal solution. Sixth, the effect of the pumping and recharge schedules prescribed by the optimal solution is verified using the original simulation model. Seventh, the sensitivity of the solution to uncertainties is explored.
The AQMAN program performs stages three and four: generation of the response matrix and construction of the optimization data file. It is also useful in stage seven, sensitivity analysis. Given a field area for which a simulation model has been developed and for which a management problem has been formulated, AQMAN can be used to evaluate alternative management strategies. It is applicable to problems for which two-dimensional confined aquifer simulation models are appropriate. AQMAN uses the code of Trescott and others (1976) to simulate the set of system responses to pumping or recharge, as well as other system stresses. It then converts this information into a response matrix and creates the optimization data file. From that point on an optimization code is employed to solve the linear or quadratic programming problem. The use of AQMAN for aquifer management modelling requires a thorough understanding of aquifer simulation and the principle of linear superposition. Experience with the optimization methods of linear and quadratic programming is helpful, but not essential. The user should be familiar with aquifer flow simulation and should be able to use the code of Trescott and others (1976) for the problem of interest AQMAN's programming logic is quite general for aquifer management modelling, so that with appropriate modifications other ground-water flow simulators may be linked with AQMAN. However, this may require several changes in both the flow simulator and in the AQMAN code. These changes should be performed only by experienced ground-water modellers. In its current form, AQMAN is fully linked only with the Trescott code. Aquifer simulation must be performed for systems that show a linear drawdown response to pumping and are sufficiently described by the equation that governs two-dimensional ground-water flow: 3H
= S
- + W,
id - 1.2
where H * hydraulic head [L], Tj: * transmissivity tensor [L2/T], S - storage coefficient [L°], W - source (recharge) or sink (pumping) per unit area [L/T], t - time [T], X| x: - spatial coordinates [L].
(1)
GROUND-WATER MANAGEMENT MODELING Background
Ground-water management modeling is a relatively new discipline in hydrology. Over the past 25 years, two types of management models have been developed: lumped parameter and distributed parameter models. Lumped parameter models have been used to study economic and policy matters that involve ground-water resources. They do not explicitly consider the governing equations of ground-water flow, but rather conceptualize aquifers with simple water mass balances. Examples of lumped parameter models are those of Chaudhry and others (1974), Anderson and others (1983), and Khepar and Chaturvedi (1982). Distributed parameter management models join aquifer simulation with optimization methods and explicitly solve the partial differential equation that governs flow. Gorelick (1983) discusses and critically evaluates the methods and applications of these models. They have been used to manage well fields, to evaluate efficient conjunctive use of stream-aquifer systems, and to inspect the impacts of water-resource policies upon the hydrology and economics of ground-water use. AQMAN is a tool that helps solve distributed parameter aquifer management problems. AQMAN links a distributed parameter ground-water simulation model with mathematical optimization methods using a technique known as the response matrix approach (see Gorelick, 1983). This approach was initially developed for optimizing profits from oil production, and was presented in the petroleum engineering literature by Lee and Aronofsky (1958). During the 1970's the technique was expanded and brought into the hydrologic literature, principally by Wattenbarger (1970), Maddock (1972), Rosenwald and Green (1974), and Schwarz (1976). Applications of the response matrix approach have been presented by Larson and others (1977) and by Heidari (1982) to determine "safe yield" of aquifers; by Willis (1983) to determine the optimal pumping scheme to meet agricultural water demands; by Danskin and Gorelick (1985) to evaluate the efficiency of a surface-water recharge program; and by Colarullo and others (1984), Atwood and Gorelick (1985), Gorelick and Wagner (1986), and Lefkoff and Gorelick (1985; 1986) to contain plumes of contaminated ground water and design aquifer restoration systems. The Response Matrix Method The key idea behind the response matrix method is that because a groundwater system described by equation (1) is linear, the influence of each source or sink may be calculated separately and then superposed to compute the complete distribution of hydraulic heads over space and time under any pattern of pumping and recharge. The method fully accounts for the effects of initial conditions, which may vary over space, and the effects of boundary conditions, which may change over time. A response matrix is an assemblage of coefficients, each of which relates pumping at one location to drawdown at another location. In order to see how a response matrix is developed using a simulation model, consider an example where head is to be controlled at a location P during two months by managing pumping at two wells, A and B. By use of a unit pumping rate, drawdown is calculated at the end of each month at location P.
10
Specifically, (1) Reference-head at P is computed by a transient simulation with no pumping. (2) A convenient unit pumping rate, 1.0 fts/s, is selected. (3) A transient simulation is performed with only well A pumping at the unit rate during the first month and not pumping during the second month. Calculated head at P is subtracted from the reference head to obtain a drawdown for each month. For example, say that drawdown is 0.75 feet at the end of the first month and 0.20 feet at the end of the second month. (4) Step (3) is repeated for well B. Say that the calculated drawdown at P from the reference head is 0.40 feet at the end of the first month and 0.25 feet at the end of the second month. Because the system is linear, total drawdown at P induced by managed pumping during each month equals the sum of the drawdowns due to the two wells: Sl - 0.75 QA>1
+ 0.40 QB>1
82 - 0.20 QA |
+ 0.25 QB j + 0.75 QA 2 + °-40 Qfi 2
where s - total drawdown [feet] from the reference head at location P at the end of month 1 or 2 due to managed pumping, Q- pumping rate [fts/s] at well A or B during month 1 or 2. These two equations can be expressed in matrix form:
.75 ..20
.40 .25
0 .75
QA.I QB.I QA.2 Qfl,2
vector of drawdowns
response matrix
vector of pumping rates
Response coefficients (0.75, 0.40, 0.20, 0.25) are stored in a matrix, thus the name response matrix method. Through matrix algebra, a large number of responses can conveniently be added over time and space. For any given set of initial and boundary conditions, total drawdown at a given location will be a linear function of pumping and recharge at all wells during all management periods. The small example above demonstrates two general features of response matrices. First, the matrix contains zero elements in the upper triangular portion because pumping or recharge in some management period can never affect drawdowns in an earlier period. Second, matrix elements are repeated systematically. This is
11
because the response to a unit of pumping depends only on the time since pumping began. That is, the response to a unit pumping rate that begins today is the same as the response to a unit pumping rate that begins next month, except that the responses are lagged by one month. The matrix in the example above has the following general structure: drawdown response in month 1 to unit pumping in month 1
drawdown response in month 2 to unit pumping in month 1
zero response drawdown response in month 2 to unit pumping in month 2 (same as upper left)
When generating the response matrix, the number of computations performed in AQMAN is reduced by taking advantage of this matrix structure.
12
GENERAL PROBLEM FORMULATION FOR LINEAR AND QUADRATIC PROGRAMS
The process of solving a linear or quadratic programming problem begins with the formulation of a management problem as a mathematical model. As with all models, the mathematical formulation extracts the essence of the real-world system and does not consider every detail. Problem formulation may reveal inadequacies in the data. It may also happen that the formulation process, which is often avoided during trial and error simulation, will lead directly to a highly simplified management model, or even to an apparent solution. Problem formulation is certainly the most important and often the most difficult part of management modelling. A management model consists of an objective function (or goal) which to be minimized or maximized, and a series of linear constraints (or restrictions) that must be obeyed. Decision variables are the unkown quantities of concern that can be controlled in a managed system. For our purposes, these are pumping and recharge rates at specific locations. Linear and Quadratic Objectives Linear programming is used for cases in which the objective function, whose value is F, is linear with respect to the decision variables. For example, one might maximize the sum of pumping rates, Qj n at five wells (index i) during eight time periods (index n): Maximize
8 5 F * Z Z n*l i*l
Qj n
(2)
Quadratic programming is used for cases in which the objective is a quadratic function of the decision variables. For example, one might minimize the^ sum of squared differences between pumping rates and ideal target pumping rates, Qj n: Minimize
F »
Z Z n«l i«l
(Q i>n - Q*>n)2
Typical objective functions are: Minimize the cost of pumping Minimize total pumpage Maximize total pumpage Minimize the maximum pumping rate Maximize total recharge Minimize the maximum drawdown Maximize the minimum hydraulic head Minimize the sum of squared deviations from target heads, hydraulic gradients, velocities, drawdowns, or pumping rates Minimize the sum of the absolute value of deviations from target heads, hydraulic gradients, velocities, drawdowns, or pumping rates
13
(3)
Objectives may also involve fixed costs, such as well installation or capital investment in pumping capacity. Further, it is possible to formulate problems with multiple objectives. Aguado and Remson (1980) describe the fixed cost problem, and Cohon and Marks (1975) provide an excellent review of multi-objective analysis. AQMAN does not automatically generate fixed cost objectives nor multiple objective functions, but is nonetheless useful for solving such problems. Constraints and System Linearity
Constraints derive from the physical, economic, or social mechanisms operating in the managed system. Typical ground-water constraints might involve definition of drawdowns as a linear function of system stresses using a response matrix definition of hydraulic heads, velocities, and gradients as a function of system stresses limitations on local drawdowns, hydraulic gradients, velocities or heads restrictions on local hydraulic gradients or velocities to certain magnitudes and directions limitations on pumping rates at individual or groups of wells restrictions on changes in pumping rates, drawdowns, or hydraulic heads over time balances between total pumping and total recharge Constraints may be represented by placing simple bounds on individual decision variables, by inequalities or equalities placed on groups of decision variables, or by restrictions on hydraulic conditions. In all cases, a specified limit appears on the right-hand side. For example, the pumping rate Q at well 2 during period 3 must not exceed 1.5 fts/s: Q2,3 ^
l -5
Total pumpage for three wells must supply at least 5.0 fts/s during period 1: Ql.l + Q2.1 + Q3,l ^ 5-°
Pumping rates at well 1 must be the same for periods 3 and 4: Ql,3 ' Ql.4 ' °
Hydraulic head H at location 3 must not exceed 50 feet during period 1: H3>1 < 50
(7)
During period 4, the hydraulic gradient between locations 1 and 2 must not be less than 5 percent (L is the distance between the two locations): H M " H2»4
> 0.05
(8)
14
The seepage velocity V at location 2 must be at least 0.03 ft/s during period 5: V2,5 * 0-03
(9)
At location 3 during period 1, the x-component of the seepage velocity must be at least twice the y-component:
In both linear and quadratic programming problem formulations all constraints must be linear. This means that the ground-water system must respond linearly to management decisions. The hydraulics of a confined aquifer can be managed successfully using linear or quadratic programming, since ground-water flow is governed by equation (1), which contains a linear relation between head changes and well pumpages. AQMAN is useful only for linear management problems. Nonlinear constraints cannot be imposed. For example, nonlinearities resulting from dewatering of unconfined aquifers cannot be rigorously handled by AQMAN. However, in some cases it may be possible to linearize such systems if drawdown is small compared to saturated thickness, or by solving sequential linear problems where the saturated thickness is given by the last iterate (Danskin and Gorelick, 1985). There is a certain art in formulating problems to avoid nonlinearities. For instance, the absolute value function, which is in fact nonlinear, has a linear equivalent that can be easily incorporated into linear programming problems. The problem and methods for deriving linear formulations is discussed in various operations research text books such as Dantzig (1963), Hillier and Lieberman (1974), and Wagner (1975). Advanced techniques are now available to manage nonlinear systems (Gorelick and others, 1984). Nonlinear management modelling problems are not restricted to aquifer hydraulics. They involve the solution of governing equations which are not linear with respect to management decisions. For instance, a problem which calls for the management of solute concentrations when those concentrations are affected by pumping and recharge decisions is nonlinear. Time Parameters
Three time parameters are used in management modelling. The planning horizon is the total length of time over which a system is being managed. It consists of one or more management periods or planning periods, which define the time during which a particular decision variable is constant or a particular set of constraints applies. For instance, we may define a one-year planning horizon consisting of 12 one-month management periods. A separate decision variable would be defined for each well during each month, and a constraint that relates pumpage to drawdown would be formulated for each month. AQMAN requires that all management periods are equal in length. The third time parameter is the numerical time step used in the finite-difference simulation procedure.
15
Stress and Response Drawdowns Use of the response matrix method for ground-water management modeling relies on the concept of linear response to system stress. A stress is an excitation that induces a change in aquifer heads. An unmanaged stress is one that cannot be controlled due to physical limitations or social demands. Examples might be boundary conditions and pre-determined pumpage or recharge rates given for unmanaged wells. Managed stresses are those described by the decision variables: pumpage and recharge at managed wells, where management decisions must be made. In this context, "well" refers to any source or sink. In addition to actual pumping or injection wells, the term includes stresses such as recharge from a lake or from a river where flow is controlled. In order to strictly maintain system linearity, the flux through a managed well can not be head-dependent. Unstressed heads or unmanaged heads are those that would occur if no managed stresses were applied to the system (Figure 1). Manageable drawdown is the difference between unmanaged head and any limit on head imposed by the user. For example, suppose that head at a location must always be greater than 88.0 feet, and that the unmanaged head there is 93.8 feet in the first management period, and 92.4 feet in the second period. Then the manageable drawdown in the two periods are +5.8 feet and +4.4 feet, respectively. A unit stress is a convenient quantity of managed stress, such as 0.1 fts/s or 1.0 fts/s. For each separate managed well, AQMAN applies a unit stress at the well during the first management period and then applies no managed stresses during subsequent periods. The transient ground-water flow equation (1) is solved to obtain hydraulic head at every control location during every period. The drawdown response is the difference between this head and unmanaged head. Every response appears in the management formulation as a response coefficient The coefficient measures the hydraulic relation between stress at a particular managed well and drawdown at a particular control location. Through the use of linear superposition, the product of the response coefficient and the actual managed stress gives the actual drawdown at the control location induced by pumping or recharge at the managed well. Total drawdown equals the sum of the individual drawdowns caused by each managed well, plus the drawdown caused by initial and boundary conditions and unmanaged pumping and recharge. Total drawdown must be contained within the limits imposed by the manageable drawdown. Gradients and velocities A control pair is defined by two control locations across which a gradient or hydraulic ground-water velocity is being constrained. In order to define a gradient or a velocity, the difference-in-drawdown response is used in a manner similar to drawdown response. Each difference-in-drawdown response also appears in the management formulation as a response coefficient. The coefficient measures the hydraulic relation between stress at a decision well and the difference-in-drawdown within a control pair. The response coefficient multiplied by the managed pumping and recharge rates gives the difference in drawdown. The total difference-indrawdown equals the sum of the influences due to managed stress, unmanaged stress, and initial and boundary conditions. This total difference is linearly proportional to the gradient and to the velocity at the control pair. The total difference-in-drawdown must be contained within the limits imposed
16
Dam with managed releases
ntiometric
:entiometnc surface
RECHARGE WELL Q
Contaminant plume
PUMPING WELL A Unmanaged A
Managed
Figure 1. Managed and unmanaged potentiometric surfaces with several wells.
17
by the manageable gradient or manageable velocity for the control pair. The manageable gradient is the difference between the gradient due to unmanaged heads and any limit on the gradient imposed by the user. The manageable velocity is the difference between the velocity under the unmanaged gradient and any limit on velocity imposed by the user. In both cases, the user's limit on gradient or velocity is multiplied by a factor that converts it to a head difference. For example, say that control pair 2 is defined by control location 4 and 7 (These are indicated below by the subscripts "2", "4", and "7"). Ignoring the time dimension for the sake of clarity, G2
H7 - G 2
(L2 )
(11)
2L2 H7 - V2
where
(12)
G « manageable gradient within the control pair [L], V - manageable velocity within the control pair [L], H * unmanaged head at a control location [L], o G * limit on gradient imposed by the user [L ], V « limit on velocity imposed by the user [L/T], L * distance between the two locations of the control pair [L], o - effective porosity within the control pair [L ], K - hydraulic conductivity within the control pair [L/T].
The conversion factor L or (cL/K) is read as input by AQMAN. Head, gradient, and velocity definitions
Ground-water management problems are usually formulated in terms of drawdown or difference-in-drawdown. AQMAN also allows for head definition, gradient definition, or velocity definition at any control location or control pair as a supplement to drawdown information. The use of definitions may serve two purposes. First, the management solution will directly contain the heads, gradients, or velocities that result in response to optimal pumping and recharge rates. This helps the user characterize the optimal management strategy. Second, the difference between two gradients or two velocities can be easily controlled. This is particularly useful in comparing the magnitude of the two vector components of the gradient or velocity at a pair of control locations. Definitions can be specified for head difference-in-head within a control pair. In introduces a new decision variable and sets unmanaged head and total drawdown. In the
18
at a single control location or for the first case, AQMAN automatically it equal to the difference between second case, the new decision variable
is set equal to the difference between: (1) the difference in unmanaged heads and (2) the total difference-in-drawdown. The user can then impose additional constraints on the new head, gradient, or velocity variables. The MPS File and the Solution
AQMAN creates a data file that defines the objective and all constraint functions and contains all of the response coefficients and manageable drawdowns, gradients, and velocities. The file is written in MPS (Mathematical Programming System) format, which is required by most standard linear and quadratic programming packages. The optimization package reads this MPS file as input, and computes a solution to the management problem. A management solution consists of a set of values for the decision variables. A solution is either infeasible, optimal, or unbounded. An infeasible solution violates one or more of the constraints. A feasible solution is optimal if it produces the best (maximum or minimum) possible value of the objective function. An optimal solution is usually what we hope to find! A problem may have more than one optimal solution, where several management strategies satisfy the constraints and produce the same optimal value for the objective. A solution is unbounded if the optimal value of the objective function goes to positive or negative infinity without violating any of the constraints.
19
PROBLEM FORMULATION WITH AQMAN
This section describes the general procedures required to utilize AQMAN, including manual changes to the MPS file. Detailed instructions for AQMAN input files are given in Appendix II. Objective Function Linear objective
AQMAN is written to handle either a linear or a quadratic objective function. If the linear option is in effect, AQMAN assumes that the linear objective is to minimize or maximize total pumping: N
I
E E CU Qi,n n-1 i*l where
(13)
I * total number of managed wells, N * total number of management periods, s Qj n - pumping rate at well i during period n [L /T], o Cj n - cost coefficient for well i during period n [L].
All cost coefficients are assumed to equal +1.0. These are automatically scaled by multiplying by the negative of the unit stress pumping or recharge rate. (See the sub-section below on "The Unit Stress and Scaling".) If no scaling is required and all unit stresses are either -1.0 (pumping) or +1.0 (recharge), cost coefficients will be +1.0 for pumping wells and -1.0 for recharge wells. These are written by AQMAN to the MPS file. Both pumping and recharge rates are non-negative by default in the MPS file. If a linear objective other than (13) is desired, the user can make changes directly to the MPS file. For instance, say that the problem contains two decision wells, and management criteria specify that pumpage at the first well should be weighted twice as much as pumpage at the second well. Cost coefficients become weights, and the objective would be to optimize
*
f2 Ql,n + 1 Q2,n]J w
The cost coefficient written by AQMAN to the MPS file for Qj should be manually changed to twice its value for each management period n. Quadratic objective If the quadratic option is specified, AQMAN assumes that the objective is to minimize the present value of variable pumping costs. These are the costs associated with the energy required to operate pumps, and do not include capital (fixed) costs of well installation or pumping capacity. Variable pumping costs are a quadratic
20
function of pumping decisions. This is because costs vary with pumping rates and pumping lifts, and lifts depend on pumping rates: N I P-E E Cifn Zu QU n-1 i-l where
P
(15)
- total variable pumping cost [$],
zi,n " total lift at wel1 * during period n [L], Cj n - unit cost of pumping per unit lift at well i during period n [$/(L8/T)/L]. The total lift is a function of pumping during period n and during all_ previous periods at all wells. It consists of two parts (Figure 2). One part, Z, is the unmanaged lift, which is the distance from the land surface down to the transient potentiometric surface that would occur if there was no managed stress applied to the aquifer. The second part, Z, is the managed lift, which is induced by pumping at all wells during the current period and during all previous periods. Both parts of Z are fully computed by AQMAN. That is, zi,n - Zi,n + Zi>n
(16a)
and n
I U(n-k)Qj,k
< 16b>
where r: : (n.v\ is the drawdown response at well i during period n induced by pumping a* unit rate at well j during period k. If j is a recharge well, the response r will be negative. Substitution of (16) into (15) gives N I E E n-1 i«
ci,n zi,nQi,n
n I + *. * k-1
(17)
c i,n r i,j,(n-k)Qj,kQi,n t
cost due to linear component
cost due to quadratic component
The first set of terms is linear, while the second set is quadratic with respect to the decision variables Q. When the user specifies that the objective is quadratic, AQMAN uses equation (17) as the function to be minimjzed. For the cost due to unmanaged lift, undiscounted unit cost coefficients Cj n are read as input, data and are scaled and discounted for each management periojl The value of Zj n during each period is computed, and the scaled product C| >nZ^n is written into the usual objective rows of the MPS file. For each management period, unit costs are discounted according to the
21
Velocity Control Locations
Piping Land Surface
W^"
^__r
r: -II
T _2
> > > < < < < < < < < < ;*
06,2
> > ^
_ M
8
QC
umping Response in Period 2 to Period 1 Pumping
Figure 9.
Response in Period 2 to Period 2 Pumping
Q.
The sample problem, re-formulated with a response matrix.
52
22.2 18.2 15.3 11.5 156.5 156.5 159.7 155.8 185.9 -7.3 -18.7 -21.8 -23.9 33.8 26.2 21.5 15.9 173.7 173.5 1^2.7 172.5 202.6 19.3 -2.2 -8.5 -12.5
0)
Drawdo
On a PRIME 850 mini-computer, AQMAN used 76 CPU seconds for this problem. MINOS used 16 CPU seconds. It is also instructive to see the effect of head definitions on the internally re-formulated problem. For example, the user wants the optimal head at locations 1 and 2 during both periods to appear directly in the solution, and KDEFHD is set equal to 1. The re-formulated problem is shown in Figure 10. Extra unity values have been added to the response matrix, inequalities are changed to equalities, and the value of the right-hand side is now unmanaged heads. The user will have to manually add constraints (32) and (33) to the MPS file.
53
JC/5 .p. t_i
i_ii_ii_ii_iioroi-'roio * 10 t-1 01 *- N> »-* oo oo u> vo oo p> -vi oo -j
w
»-*fOWI-*l-*WI-*l-*
»->l-*fOOO
,_i l_i
C.
u»u»i-'u»^Ji-*i-*i-*
.^ ^
2 Q)
Q X ^ ^
£
ON
+
l-*w
00 Wl ^^ '^^ 00 ^^ O^ ^* ^? **J O^ O^ OO O^ ^^ ^"* ^^ **J ^? ^? ^5 **J O^ t/> O^ ^*
Q .^
, , l l l l i l l l|_j |_j|s}|-'l-'N>l->l->i
i
i
»
t
l l N> l l l ' l i|-*IOI-*IOI-*l-*IOI-*l-*«
i
' ' I-* W
_ fj
-
1^ l
ro oo
o>
l
i-*
I
(-\ tri
>J>>IO>O>NdO>O>hO^-OOvOOOOOOOOOOOOOO
fsj
t-K3^JOOO^JuiN>O>N>OOi->U)->>I^J-->l-P-OOOOOOOOOOOOO
FO
, N>
I i
i
i
i
i
i
i
i
l
i
__
h-'oji-'i.p-wjwwroroi-'i-' ^ (JiOi^JOvOvOvOvOOvOvOOOOOOOOOOOOOOO
01
O>*-«JiO>l-*vO^JI-»l-'*-OW*-OOOOOOOOOOOOO
TO
I To
, N>
NJ
*_» '_>
To
To
To
\^ \V \V \V IA IA IA ii
To To
To
"-»
*-» '-»
*-»
ii IA IA lA lA \^/ \V \V \V lA lA lA »
"-*
"_»
" lA lA lA lA
Figure 10. The re-formulated sample problem with four head definitions added.
54
REFERENCES
Aguado, £., and Remson, I., 1980, Ground-water management with fixed charges: Journal of Water Resources Planning and Management Division, American Society of Civil Engineering, v. 106, no. WR2, p. 375-382. Anderson, T., Burt, O.R., and Fractor, D.T., 1983, Privatizing groundwater basins: a model and its application: in Water Rights, Scarce Resource Allocation, Bureaucracy, and the Environment, by T.L. Anderson (editor), Pacific Institute for Policy Research, San Francisco, 348 p. Atwood, D.F., and Gorelick, S.M, 1985, Hydraulic gradient control for ground water contaminant removal: Journal of Hydrology, v. 76, p. 85-106. Chaudry, M.T., Labadie, J.W., Hall, W.A., and Albertson, ML., 1974, Optimal conjunctive use model for the Indus basin: Journal of Hydraulics Division, American Society of Civil Engineering, v. 100, no. HY5, p. 667- 687. Cohon, J.L., and Marks, D.H., 1975, A review and evaluation of multi-objective programming techniques: Water Resources Research, v. 11, no. 2, p. 208- 220. Colarullo, S.J., Heidari, M, and Maddock III, T., 1984, Identification of an optimal groundwater strategy in a contaminated aquifer: Water Resources Bulletin, v. 20, no. 5, p. 747-760. Danskin, W.R., and Gorelick, S.M, 1985, A policy evaluation tool: management of a multiaquifer system using controlled stream recharge: Water Resources Research, v. 21, no. 11, p. 1731-1747. Dantzig, G.B., 1963, Linear Programming and Extensions: Princeton University Press, Princeton, 627 p. Freeze, R.A., and Cherry, J.A., 1979, Groundwater: Prentice-Hall, Englewood Cliffs, 604 p. Gorelick, S.M, 1983, A review of distributed parameter groundwater management modeling methods: Water Resources Research, v. 19, no. 2, p. 305-319. Gorelick, S.M, Voss, C.I., Gill, P.E., Murray, W., Saunders, MA., and Wright, MH., 1984, Aquifer reclamation design: the use of contaminant transport simulation combined with non-linear programming: Water Resources Research, v. 20, no. 4, p. 415-427. Gorelick, S.M, and Wagner, B.J., 1986, Evaluating strategies for ground water contaminant plume stabilization and removal, Selected Papers in the Hydrologic Sciences: U.S. Geological Survey Water-Supply Paper 2290, pp. 81-89. Heidari, M, 1982, Application of linear system's theory and linear programming to groundwater management in Kansas: Water Resources Bulletin, v. 18, no. 6, p. 1003-1012. Hillier, F.S., and Lieberman, G.J., 1974, Holden-Day, San Francisco, 829 p.
55
Introduction
to
Operations
Research:
IBM, Mathematical programming system/360, Version 2, Linear and separable programming User's Manual: Document No. H20-0476-2, IBM Corporation, New York. Khepar, S.D., and Chaturvedi, MC., 1982, Optimum cropping pattern and ground water management: Water Resources Bulletin, v. 18, no. 4, p. 655-660. Larson, S.P., Maddock III, T., and Papadopulos, S., 1977, Optimization techniques applied to groundwater development: Memoirs of the International Association of Hydrogeology, v. 13, p. E57-E67. Lee, A.S., and Aronofsky, J.S., 1958, A linear programming model for scheduling crude oil production: Journal of Petroleum Technology, v. 213, p. 51-54. Lefkoff, L.J., and Gorelick, S.M, 1985, Rapid removal of a groundwater contaminant plume: Proceedings of the Symposium on Groundwater Contamination and Reclamation, American Water Resources Association, p. 125-131. Lefkoff, L.J., and Gorelick, S.M, 1986, Design and cost analysis of rapid aquifer restoration systems using flow simulation and quadratic programming: Ground Water, v. 24, no. 6, p. 777-790. Maddock III, T., 1972, Algebraic technological function from a simulation model: Water Resources Research, v. 8, no. 1, p. 129-134. Murtagh, B.A., and Saunders, MA., 1983, MINOS 5.0 User's Guide: Technical Report SOL 83-20, Department of Operations Research, Stanford University, Stanford, 118 p. Rosenwald, G.W., and Green, D.W., 1974, A method for determining the optimal location of wells in a reservoir using mixed-integer programming: Society of Petroleum Engineering Journal, v. 14, p. 44-54. Schwarz, J., 1976, Linear models for groundwater management: Journal of Hydrology, v. 28, p. 377-392. Trescott, P.C., Finder, G.F., and Larson, S.P., 1976, Finite-difference model for aquifer simulation in two dimensions with results of numerical experiments: U.S. Geological Survey Techniques of Water Resources Investigations, Book 7, Chap. Cl, 116 p. Wagner, 1975, Principles of Operations Research: Prentice-Hall, Englewood Cliffs, 1039 PWattenbarger, R.A., 1970, Maximizing seasonal withdrawls reservoirs: Journal of Petroleum Technology, p. 994-998.
from
gas
storage
Willis, R., 1983, A unified approach to regional groundwater management: in Groundwater Hydraulics, Water Resource Monograph Series, by J.S. Rosenshein and G.D. Bennett (edited), American Geophysical Union, Washington, 416 p.
56
APPENDIX I - DEFINITION OF VARIABLES
ANNDIS * the annual discount rate, used only with quadratic objective function. Read by Subroutine QUAD from unit 13. CASE * the type of objective function in a linear management problem. either "LINEAR" or "QUAD". Read by PRE from unit 14.
Must equal
CDELT * multiplying factor for time steps. Read by subroutine PRE from unit 14. The Trescott variable CDLT is set equal to CDELT. CONHD(JN) * user-defined limit on head at each control location JN. Read by Main from unit 14. JN goes from 1 to (NCNTR x NNPER). The CONHD vector is ordered by control location numbers within each sequential management period. CONTYP(JN) * user-defined type of head constraint at control location JN. Read Main from unit 14. Must equal either "L" for "less than or equal to", "G" "greater than or equal to", or "E" for "equal to". Because constraints re-formulated in terms of drawdowns, these inequalities are reversed in MPS file. The vector CONTYP is ordered as is CONHD. COSTC(IQ,N) * pumping cost per unit period N. Read as undiscounted Subroutine QUAD and MPSFMT to each unit pumping cost. IQ managed wells.
by for are the
pumping rate per unit lift for well IQ during unit cost from unit 13 by subroutine QUAD. apply a discount factor and a scaling factor includes only quadratic (usually, pumping)
COSTF » unit pumping cost like COSTC, but constant for all wells and all periods. If KEYCOS equals 0, pumping costs are constant and read by subroutine QUAD from unit 13 as COSTF. Subroutine QUAD then applies a discount factor and enters COSTF into the COSTC matrix. DRDRES(JN) * drawdown response at each control location during each period. For each decision well, AQMAN's Main calls subroutine PRE to obtain heads HD, computes DRDRES(JN) - HDSS(JN) - HD(JN), and passes DRDRES to subroutine MPSFMT, which writes it into the column section of the MPS file. FIXQ(I,N) * pre-determined pumping rate given for unmanaged well I during pumping period N. Read from unit 14 by subroutine PRE. GCON(KN) * user-defined limit on either the gradient or the seepage velocity between the two locations of control pair KN during each period. Read from unit 13 by Subroutine GRADS. KN goes from 1 to (NGRAD x NPER). GCON is ordered by control pairs within each sequential pumping period. The convention adopted is GCON * Head(l) - Head(2). GFACT(KN) * user-defined factor by which GCON is multiplied. Read from unit 13 by Subroutine GRADS. GFACT converts GCON to a difference in head. If simply the difference in head is managed, GFACT* 1.0. If gradient is managed, GFACT * (the distance between the two locations). If velocity is managed, GFACT * (the distance between the two locations) x (effective aquifer porosity) / (hydraulic conductivity between the two locations). See equations
57
(11) and (12). is GCON.
KN goes from 1 to (NCRAD x NPER).
GFACT is ordered as
GRADE(KN) - manageable gradient or manageable velocity for control pair KN. Subroutine OR ADS computes GRADE - HDUS(l) - HDUS(2) - (GCON x GFACT). GRADE(KN) is written in the RHS section of the MPS file for the row corresponding to constraint KN. The vector GRADE is ordered as is GCON. GRATYP(KN) - user-defined type of gradient or velocity constraint for control pair KN. Must be either "L" for "less than or equal to", "G" for "greater than or equal to", or "E" for "equal to". Because constraints are re-formulated in terms of drawdowns, these inequalities are reversed in the MPS file. The GRATYP vector is ordered as is GCON. HD(JN) - heads computed by subroutine TRES. JN goes from 1 to (NCNTR x NNPER). HD is ordered by control locations within pumping periods. HDUS(JN) - unstressed, transient heads computed on first call of subroutine PRE. HDUS contains the heads that would occur over time if no managed wells were stressed. ILOCC(J), JLOCC (J) - row (y-axis) and column (x-axis) location of control node J. Read by subroutine PRE from unit 14. J goes from 1 to NCNTR. ILOCGl(K), JLOCGl(K) - row (y-axis) location and column (x-axis) location of the first node of control pair K. Read by subroutine GRADS from unit 13. Every ILOCG1 must correspond to some entry in the ILOCC vector, and every JLOCG1 must correspond to some entry in the JLOCC vector. K goes from 1 to NGRAD. ILOCG2(K), JLOCG2(K) - row (y-axis) location and column (x-axis) location of the second node of control pair K. Read by subroutine GRADS from unit 13. Every ILOCG2 must correspond to some entry in the ILOCC vector, and every JLOCG2 must correspond to some entry in the JLOCC vector. K goes from 1 to NGRAD. ILOCW(I), JLOCW (I) - row (y-axis) and column (x-axis) location of each managed or unmanaged well I. Read by subroutine PRE from unit 14. I goes from to NWLS. KCALL, KCALLP - counter for number of times AQMAN's main has called subroutine PRE. KDEFHD (J) - toggle (0 if no, 1 if yes) to indicate whether head definition is desired at control location J. Read by subroutine PRE from until 14. J goes from 1 to NCNTR. If KDEFHD (J) - 0, total drawdown from unmanaged conditions is constrained. If KDEFHD(J) - 1, a new decision variable is introduced and defined as unmanaged head minus total drawdown; the user may manually enter constraints on the new variable into the MPS file. KDEFGR(K) - toggle (0 if no, 1 if yes) to indicate whether gradient or velocity definition is desired at control pair K. Read by subroutine PRE from unit 14. K goes from 1 to NGRAD. If KDEFGR(K) - 0, total difference-in-drawdown
58
from unmanaged conditions is constrained. If KDEFGR(K) = 1, a new decision variable is introduced and defined as the unmanaged difference in head minus total difference-in-drawdown; the user may manually enter constraints on the new variable into the MPS file. KEYCOS - toggle (0 if yes, 1 if no) to indicate whether undiscounted pumping cost COSTC is constant for all wells over all periods. Read from unit 13 by subroutine QUAD. Used only with a quadratic objective function. If KEYCOS=0, a single cost factor COSTF is read, discounted on a monthly basis, and entered into the COSTC matrix. If KEYCOS-1, variable COSTC is read and discounted. KEYGRD(J) = toggle (0 if no, 1 if yes) to indicate whether primary control location J is only to be used for gradient or velocity control. Read from unit 14 by subroutine PRE. J goes from 1 to NCNTR. If KEYGRD(J) - 0, either (a) the head or (b) both the head and the gradient or velocity is controlled at location J, so that a drawdown response at J will be written in the MPS file by Subroutine MPSFMT. If KEYGRD(J) * 1, only the gradient or velocity is controlled at J, so that no drawdown response will be written in the MPS file; only a difference in drawdown response for the control pair to which control location J belongs will be written. KEYQ(I) toggle (0 if no, 1 if yes) to denote whether well I is a fixed, unmanaged well. Read by PRE from unit 14. I goes from 1 to NWLS. If there is a quadratic objective function, enter KEYQ=2 for non-quadratic (recharge) managed wells, and KEYQ=0 for quadratic (pumping) managed wells. When reading input data on the wells, all quadratic wells must be listed before any non-quadratic wells. KEYWL(J) = toggle (0 if no, 1 if yes) to indicate whether control node J also contains a well, so that head at the well radius is needed. Read by Subroutine PRE from unit 14. J goes from 1 to NCNTR. The number of non-zero KEYWLs must equal the value of NW read by subroutine TRES from unit 15. For each non-zero value of KEYWL, XRAD at that node must be positive. For each zero value of KEYWL, XRAD must be zero. KPER * pumping period counter. KPER is increased by 1 in subroutine TRES at line $2-730, after the new pumping period begins but before the SOLVE subroutines are called. KPER counts from 1 to NNPER. MNGDRD(JN) = manageable drawdown at each control location during each period. Computed as MNGDRD(JN) « HDUS(JN) - CONHD(JN). MNGDRD is written by subroutine MPSFMT into the RHS section of the MPS file. NNAME = the alphanumeric name given to the MPS data set. PRE from unit 14. May contain up to 64 characters.
Read by subroutine
NCNTR = number of control locations. Read by Subroutine PRE from unit 14. Current maximum value (for storage of ILOCC, JLOCC, KEYWL) is 500. NGRAD - number of gradient control pairs. Read by Subroutine PRE from unit 14. Each gradient pair consists of two control locations that have each been previously read as one of the NCNTR primary control nodes.
59
NKEYQ m the number of fixed (unmanaged) wells. unit 14.
Read by Subroutine PRE from
NNPER - number of pumping periods. Read by Subroutine PRE from unit 14. The Trescott variable NPER is set equal to NNPER. The current maximum value of NNPER (for storage of TIMING) is 50. NWLS * total number of wells (managed plus unmanaged). Read by subroutine PRE from unit 14. NWLS is read instead of the Trescott variable NWEL. Current maximum value (for storage of XRAD, ILOCW, JLOCW) is 200. QWELL(IN) - pumpage and recharge rates. IN goes from 1 to (NWEL x NNPER). QWELL is used instead of the Trescott variable WELL. The current maximum value for (NWEL x NNPER) is 500. QWELL is ordered by well numbers within pumping periods. RDIF(KN) control in the control
the difference in drawdown response between the two locations of a pair. KN goes from 1 to (NGRAD x NNPER). RDIF(KN) is written column section of the MPS file for the constraint corresponding to pair KN.
SURF(IQ) * the elevation of the land surface at each quadratic (pumping) managed well. Read from unit 13 by subroutine QUAD. IQ goes from 1 to (number of quadratic decision wells). SURF is used to compute unmanaged lift required at these decision wells. TIMINC(N) - number of hours in initial time step for each pumping period. Read by subroutine PRE from unit 14. N goes from 1 to NNPER. TIMING is read instead of the Trescott variable DELT. TIMPER - number of days in each pumping period. Read by subroutine PRE from unit 14. TIMPER is read instead of the Trescott variable TMAX. UNITQ(I) * unit pumpage or recharge stress. Read by subroutine PRE from unit 14. UNITQ is negative for pumping, positive for recharge. If a problem requires scaling, the UNITQ vector can vary accordingly (eg., -1.0, 0.1, -0.001). All cost coefficients in the objective function will be automatically scaled (multiplied) by UNITQ at the appropriate well. The user must be careful to re-scale the final optimization results. XHEAD(JN) * computed head at control locations. JN goes from 1 to (NCNTR x NNPER). XHEAD is ordered by locations within pumping periods. XRAD(I) - well radius. Read by subroutine PRE from unit 14. I goes from 1 to NWLS. XRAD is read instead of the Trescott variable RADIUS. Non-zero values must be entered for any well that is also a control location, and zero values entered for any well that is not a control location.
60
APPENDIX II-DATA FILE INSTRUCTIONS
Two input files are always required for AQMAN. A third is needed if the problem involves gradients or velocities or if a quadratic objective function is desired. English or metric units can be used, as long as all input data are consistent. 1. Logical unit 15 contains the usual Trescott data set. "Group IV" data may be included, but will be ignored by AQMAN. "Group IV" contains the pumping period parameters and the well locations, pumpages, and radii (Trescott and others, 1976, pp. 49-55). 2. Logical unit 14 contains input read by subroutine PRE and Main:
Data Set 1
Number of Lines Columns 1
Format
Variable
Definition
1-4
A4
CASE
The type of objective function in a linear problem. LINE for linear function, QUAD for quadratic.
7-70
16A4
NNAME
Any title the user wishes to print on the first line of the MPS file.
1-10
110
NWLS
Total number of wells (managed plus unmanaged) in the system. NWLS must be constant for all pumping periods.
11-20
110
NCNTR
Number of control locations, constant for all pumping periods. HD and XHEAD will contain the computed head at these nodal locations.
21-30
110
NNPER
Number of pumping periods to be simulated.
31-40
G10.0
CDELT
Multiplying factor for DELT, constant for all pumping periods. Used instead of the Trescott variable CDLT.
41-50
110
NGRAD
Number of gradient controls. Each control consists of two locations, specified by ILOCG1, JLOCG1, ILOCG2, and JLOCG2. If there are no gradients, velocities, or headdifferences to control, enter 0 for NGRAD.
1-80
8G10.0
TIMPER
Number of days in each time period.
61
Data Set
Number of Lines Columns
NWLS
Format
Variable
1-80
8G10.0
TIMINC(N) Number of hours in initial time step for each period. TIMING is a vector containing NPER elements; if NPER exceeds 8, more than one line will be needed. See discussion of time parameters in text.
1-10
110
NKEYQ
Number of fixed (unmanaged) wells. Cannot be greater than NWLS.
1-10
110
ILOCW(I)
Row (y-axis) location of well I. ILOCW is a vector containing NWLS elements.
11-20
110
JLOCW(I)
Column (x-ais) location of well I. JLOCW is a vector containing NWLS elements.
21-40
G10.0
XRAD(I)
Radius [L] of well I. XRAD is a vector containing NWLS elements.
31-40
110
KEYQ(I)
Switch (0=no, l=yes) to indicate whether I is an unmanaged well. For all cases, if KEYQ(I)=1 pumpage at well I is not a decision variable, and no drawdown response is computed for it. For a quadratic objective, KEYQ(I)=2 if I is a nonquadratic, managed well, and KEYQ(I)=0 if I is a quadratic, managed well.
41-50
F10.0
UNITQ(I)
The unit pumping [L 8 /T] rate used at well I obtain drawdown responses. A negative value indicates a pumping well; a positive value indicates a recharge well. **Use care if UNITQ is not constant for all decision wells. See discussion on scaling in text.
Definition
Note-If a KEYQ=1 is read for well I, the reading of the above five variables is interrupted, and FIXQ is read for each period at well I. NNPER lines are required at each interruption.
62
Data Set 6
Number of Lines Columns
Format
Variable
NNPER
1-10
G10.0
FIXQ(I,N)
Pumpage or recharge [L*/T] at the unmanaged well I during period N. There must be NNPER values for FIXQ following a KEYQ=1.
NCNTR
1-10
110
ILOCC(J)
Row (y-axis) location of control node J. ILOCC is a vector containing NCNTR elements.
11-20
110
JLOCC(J)
Column (x-axis) location of control node J. JLOCC is a vector containing NCNTR elements.
21-30
110
KEYWL(J)
Switch to indicate whether control location J also contains a well. If KEYWL(J) does not equal zero, a well exists at J, and XRAD is used to compute head at the well, rather than a cell-averaged head.
Definition
Note The number of non-zero KEYWLs must equal the value of NW read by the TRESCOTT code from unit 15. For each non-zero value of KEYWL, XRAD at that node must be positive. 31-40
110
KEYGRD(J) Switch to indicate whether control location J is to be used only for gradient or velocity control. If KEYGRD(J)-0, J will be used for head control and may be used for gradient or velocity control. If KEYGRD(J)-!, J will not be used for head control: no constraint row and no response coefficient for J will be written in the MPS file.
63
Data Set
Number of Lines Columns 41-50
8
NNPER x NCNTR
1-10
15
Format
Variable
Definition
110
KDEFHD(J) Switch to indicate whether head definition is desired at location J If KDEFHD(J)-0, total drawdown is constrained. If KDEFHD(J)-!, head is defined and any contraint must be manually added to the MPS file.
G10.0
CONHD(JN) Desired upper or lower limit [L] on average cell head or head at a well radius at each control location during each pumping period. The first NCNTR lines are for period 1, the second NCNTR lines are for period 2, etc. Read dummy values for locations where head is not constrained.
Al
CONTYP(JN) Type of constraint on head at each control location. Must be either "L" for , or, "E" for -
3. Logical unit 13 is used only if NCR AD is positive or CASE equals "QUAD". It contains input read by subroutines QUAD and GRADS. If the problem is not quadratic, omit the lines containing ANNDIS, COSTF, KEYCOS, COSTC, and SURF. 1
NNPER +
1-10
G10.3
ANNDIS
Annual discount rate [L ], applied to pumping costs in each period on a monthly basis.
11-20
G10.0
COSTF
Undiscounted pumping cost [$], constant for all wells in all periods. Used only if KEYCOS -0
21-30
110
KEYCOS
Switch to indicate whether pumping costs are constant (0) or variable (1). If KEYCOS-0, COSTC-COSTF. If KEYCOS-1, variable COSTC is read.
1-80
8G10.0
COSTC(IQ.N) Undiscounted pumping cost [$] at quadratic managed well IQ during pumping period N. If IQ exceeds 8, more than one line will be needed for each period. Note-Omit if KEYCOS-0
64
Data Set
Number of Lines Columns 1+
NGRAD
5
NNPER x NGRAD
Format
Variable
1-80
8G10.0
SURF(IQ,N) Land surface elevation [L] at quadratic managed well. IQ goes from 1 to the number of managed wells included in the quadratic objective (usually, pumping wells). A new line is needed for every 8 entries.
1-10
110
ILOCGl(K)
Row (y-axis) location of the first node of control pair K. Must correspond to some ILOCC, i.e., must already be specified as a head control location.
11-20
110
JLOCGl(K)
Column (x-axis) location of the first node of control pair K. Must correspond to some JLOCC, i.e., must already be specified as a head control location.
21-30
110
ILOCG2(K)
Row (y-axis) location of the second node of control pair K. Must correspond to some ILOCC, i.e., must already be specified as a head control location.
31-40
110
JLOCG2(K) Column (x-axis) location of the second node of control pair K. Must correspond to some JLOCC, i.e., must already be specified as head control location.
41-50
110
KDEFGR(K) Switch to indicate whether head definition is desired at control pair K. If KDEFGR(K) = 0 total difference-in-drawdown is constrained. If KDEFGR(K) = 1, difference in head is defined and any constraint must be manually added to the MPS file.
1-15
G15.6
GFACT(KN) Factor by which GCON is multiplied. Used to control velocities or gradients rather than head differences.
65
Definition
Data Set
Number of Lines Columns 16-30
35
Format
Variable
Definition
G15.6
GCON(KN)
Al
GRATYP(KN) The type of gradient or velocity constraint at a control pair. Must be either "L" for , or "E" for «.
Constraint on gradient [L/L] or or velocity [L/T] between the two locations of a control pair. Direction defined as (value at 1) (value at 2).
Three output files must always be open for program execution. Unit 16 will contain error and warning messages. Unit 17 will contain the user-defined limits on head and the unmanaged heads for all control locations, and pumping or recharge rates at all wells. Unit 18 is the MPS file, to be used as input for a mathematical programming package. A fourth output file is needed for quadratic problems. AQMAN writes to unit 19 the drawdown responses at all pumping (quadratic) managed wells. (These are recognized as control locations at which KEYWL=1 and KEYGRD=1). Unit 19 will be used by the optimization model to compute the value and gradient of the quadratic objective function for a given set of decisions. See Appendix III.
66
APPENDIX III - QUADRATIC OBJECTIVE: SUBROUTINE FUNOBJ
In order to execute an optimization code that solves a quadratic objective, the user must supply to the code a subroutine that evaluates the value and the gradient of the quadratic objective function for a given set of decisions. The quadratic portion of the objective is given by: N (AD
J," QU< e U,(n-k) Where
J = number of pumping managed wells, I = number of managed (pumping + recharge) wells, N = number of management periods, C = unit cost of pumping per unit pumping rate per unit lift [$L~4 T ], Q = pumping or recharge rate at managed wells [ LS /T], 6 = response coefficient between the head at well j and pumping or recharge at well i separated by (n-k) management periods [L° ]
The gradient is the partial derivative with respect to each of the decision variables Q: N
8F 6Q w,p
I I, i=l
n=k
n I, k=l
j,n Qj,n B i,j,(n-l
for i=w k-p
for j=w n=p
Cj,n Qi,k
w P
(A2)
This appendix contains two versions of a subroutine that calculates (Al) and (A2). The subroutine, FUNOBJ, was written for use by the mathematical programming package MINOS (Murtagh and Saunders, 1983), but should be easily adaptable to other optimization codes. The two versions differ only in the amount of computer CPU time and storage required. The first version operates faster, and is recommended for most problems. This version reads all input data once, and needs CPU core storage space at least as large as the input files. The second version of FUNOBJ should only be used for very large problems. It reads input data repeatedly, requiring less storage but much more input/output time. The definition of a "large" problem depends on the computer facilities available; if the CPU can easily store all input files, the first version of FUNOBJ should be used. For example, if the input file that requires the most storage needs 0.5 megabyte of core and the problem is to be run on an 8.0 megabyte machine, the problem is not large and the fast FUNOBJ should be used.
67
In addition to the MPS file, two other input files are needed to execute a quadratic programming code. One of these is the quadratic response file, which is written by AQMAN as unit 19. It contains the drawdown response at "response wells" to a unit stress applied at all managed wells. "Response wells" consist of all pumping managed wells plus all recharge managed wells where head is controlled. Usually, head is controlled at all recharge wells to remain below some level, such as the land surface. In this case, all managed wells are response wells. There may be some exceptional problems in which head is not controlled at all recharge decision wells. If this is specified in the input files for AQMAN (units 14 and 13), the number of response wells written to unit 19 will be less than the number of decision wells. During execution of the optimization code combined with Subroutine FUNOBJ, the quadratic response file will require more storage than any other input file. (The MPS file will be larger, but most optimization codes store it in a compact form.) The size of the quadratic response file determines whether the fast version of FUNOBJ can be used. The number of lines in the file equals the number of decision wells times the number of response wells times the number of management periods. The variable RBETA in FUNOBJ must be dimensioned large enough to store these numbers. For instance, say that a problem contains 50 managed wells and 25 periods, and that all of the managed wells are response wells. The file will contain 62,500 lines, and RBETA should be dimensioned 50 by 50 by 25. Since RBETA is double precision, this would reserve 0.5 megabytes of core. If the computer has a core memory of 8.0 megabytes, the fast FUNOBJ can be used. In order for the data in the MPS file and the quadratic response file to be properly organized for the optimization code and for FUNOBJ, two precautions must be taken before execution of AQMAN. (1) Pumping wells, which all appear in the quadratic terms of the pumping cost objective, must be included as control locations (part of NCNTR) in order to obtain the well heads needed to compute induced lifts and cost coefficients. At each of these wells, if head-control is not desired, enter KEYGRD-1. This will prevent the writing of a constraint row for these wells to the MPS file. Remember that for each managed well at control locations, XRAD must be positive and KEYWL set equal to 1. (2) When entering well information into unit 14, all quadratic managed wells (usually, pumping wells) must be listed before nonquadratic managed wells (usually, recharge wells). This is needed for proper ordering of the responses written to unit 19. For non-quadratic managed wells, enter KEYQ-2. For quadratic managed wells, enter KEYQ-0. As always, enter KEYQ-1 for unmanaged wells. The other input file needed by FUNOBJ is created by the user. It is unit number 12. Definitions and format instructions are given below. A listing of the two versions of Subroutine FUNOBJ follows.
68
Data Set 1
Number of Lines Columns 1
Format
Variable
Definition
I-10
110
NDWLS
The number of decision wells.
II-20
110
NRES
The number of response wells. This is all pumping managed wells (quadratics) plus all recharge managed wells where head is controlled. Usually, NRES equals NDWLS.
21-30
110
NPWLS
The number of pumping managed wells, where quadratic pumping costs are being minimized.
***Note~NPWLS cannot be greater than NRES, and NRES cannot be greater than NDWLS. 31-40
110
NPER
The number of management (pumping) periods.
1-80
G10.2
TIMPER
Number of days in each management period. TIMPER is used here for discounting future costs.
1-10
G10.3
ANNDIS
Annual discount rate [L], applied to pumping costs in each period.
11-20
G10.3
COSTF
Undiscounted pumping cost [$], constant for all wells in all periods. Used only if KEYCOS - 0.
21-30
110
KEYCOS
Switch to indicate whether pumping costs are constant (0) or spatially variable (1). If KEYCOS=0, COSTC-COSTF. If KEYCOS-1, variable COSTC is read.
o
4
NNPER +
1-80
8G10.2
COSTC(IQ,N) Undiscounted pumping cost [$] at quadratic managed well IQ during pumping period N. If I>8, more than one line needed for each period. ** Note-Omit if KEYCOS-0
5
NPWLS
1-10
G10.2
UNITQ(IP)
69
The unit pumping rate [-L /T] applied by AQMAN at each well IP. Used to scale cost coefficients in the quadratic objective.
C---Subroutine FUNOBJ for MINOS with quadratic objective function. C---Calculates value and gradient of the objective function. C---This version requires more storage, but runs must faster. SUBROUTINE FUNOBJ(MODE,NN,X,F,G,NSTATE,NPROB,Z,NWCORE) IMPLICIT REAL*8 (A-H.O-Z) DIMENSION X(NN),G(NN),Z(NWCORE) C*** Check dimensions!! Be sure that RBETA(I,K,N), COSTC(I,N), and C*** Q(I,N) are large enough for the problem: C I-number of decision (managed) wells, NDWLS C K-number of response wells, NRES C N-number of management periods, NPER COMMON /QUADAQ/ RBETA(30,30,4),COSTC(30,4),Q(30,4),UNITQ(30) C---Read data only if first call by MINOS. IF(NSTATE.NE.l) GO TO 170 C---Read number of decision (managed) wells, response (observation) C----wells, pumping (quadratic) wells, and pumping periods. C**** NOTE *** In ordering decision vector, all response wells must C be first decision wells, and all pumping wells must be C first response wells. READ(12,10)NDWLS,NRES,NPWLS,NPER 10 FORMAT(4I10) C---Read length (in days) of pumping periods READ(12,20)TIMPER 20 FORMAT(G10.2) C--Read annual discount rate, constant pumping cost, and key to C----indicate whether costs are constant (0) or variable (1): READ(12,25)ANNDIS,COSTF,KEYCOS 25 FORMAT(2G10.3,I10) DISMON-ANNDIS/12.0 NDAYS-0 DO 140 N-l.NPER NDAYS-NDAYS+TIMPER NMONTH-NDAYS/30 DISFAC-1./((1.+DISMON)**NMONTH) IF(KEYCOS.EQ.O) GO TO 120 C--Read variable pumping costs into cost vector and discount according C----to time period lengths by months: READ(12,30)(COSTC(I,N),I-1,NPWLS) 30 FORMAT(8G10.2) DO 110 1-1, NPWLS 110 COSTC(I,N)-DISFAC*COSTC(I,N) GO TO 140 C--Put constant pumping costs into costs vector and discount by time C--.period: 120 DO 130 1-1, NPWLS 130 COSTC(I,N)-COSTF*DISFAC 140 CONTINUE C--Read unit pumping rates used to obtain responses. Be sure that each C---unit rate corresponds to correct pumping well! Remember: NEGATIVE C---for pumping. DO 145 1-1,NPWLS 145 READ(12,20)UNITQ(I) C--Scale cost coefficients according to unit pumping rates. 70
FUNa FUNa FUNa FUNa FUNa FUNa FUNa FUNa FUNa FUNa FUNa FUNa FUNa FUNa FUNa FUNa FUNa FUNa FUNa FUNa FUNa FUNa FUNa FUNa FUNa FUNa FUNa FUNa FUNa FUNa FUNa FUNa FUNa FUNa FUNa FUNa FUNa FUNa FUNa FUNa FUNa FUNa FUNa FUNa FUNa FUNa FUNa FUNa FUNa FUNa FUNa FUNa FUNa FUNa
10 20 30 40 50 60 70 80 90 100 110 120 130 140 150 160 170 180 190 200 210 220 230 240 250 260 270 280 290 300 310 320 330 340 350 360 370 380 390 400 410 420 430 440 450 460 470 480 490 500 510 520 530 540
DO 150 N-l.NPER DO 150 I-l.NPWLS 150 COSTC(I,N)-COSTC(I,N)*(-UNITQ(I)) C--Read matrix of responses between well I and well L for separated by C----(NPER-l) pumping periods. DO 160 I-l.NDWLS DO 160 N-l.NPER DO 160 I^l.NRES READ(19,50)RBETA(I,L,N) 50 FORMAT(20X,F15.7) 160 CONTINUE C--Convert pumpage vector into two dimensional matrix: 170 DO 180 I-l.NDWLS DO 180 N-1,NPER KPUMP-N+(I-1)*NPER Q(I,N)-X(KPUMP) 180 CONTINUE C--Compute value of objective function. F-0.0 DO 200 I^l.NPWLS DO 200 N-l.NPER FTEMP-0.0 DO 190 I-l.NDWLS DO 190 K-l.N KT-N-K+1 FTEMP-FTEMP+(Q(I,K)*RBETA(I,L,KT)) 190 CONTINUE F-F+(FTEMP*COSTC(L,N)*Q(L,N)) 200 CONTINUE C-Compute value of gradient at each decision (managed) well during each C---management period. DO 230 IWIXL.NDWLS DO 230 IPER-l.NPER KG-IPER+(IWL-1)*NPER G(KG)-0.0 DO 225 I-1,NDWLS DO 225 K-1,NPER IF(I.NE.IWL .OR. K.NE.IPER)GO TO 225 DO 220 I^l.NPWLS DO 220 N-K.NPER KT-N-K+1 G(KG)-G(KG)+(COSTC(L,N)*Q(L,N)*RBETA(IWL,L,KT)) 220 CONTINUE GO TO 230 225 CONTINUE 230 CONTINUE DO 300 LWIXL.NPWLS DO 300 IPER-l.NPER G2-0.0 DO 280 IXL.NPWLS DO 270 N-l.NPER IF(L.NE.LWL .OR. N.NE.IPER)GO TO 270 DO 260 I-l.NDWLS DO 260 K-l.N
71
FUNa 550 FUNa 560 FUNa 570 FUNa 580 FUNa 590 FUNa 600 FUNa 610 FUNa 620 FUNa 630 FUNa 640 FUNa 650 FUNa 660 FUNa 670 FUNa 680 FUNa 690 FUNa 700 FUNa 710 FUNa 720 FUNa 730 FUNa 740 FUNa 750 FUNa 760 FUNa 770 FUNa 780 FUNa 790 FUNa 800 FUNa 810 FUNa 820 FUNa 830 FUNa 840 FUNa 850 FUNa 860 FUNa 870 FUNa 880 FUNa 890 FUNa 900 FUNa 910 FUNa 920 FUNa 930 FUNa 940 FUNa 950 FUNa 960 FUNa 970 FUNa 980 FUNa 990 FUNalOOO FUNalOlO FUNal020 FUNal030 FUNal040 FUNalOSO FUNal060 FUNal070 FUNalOSO
260
270 280 300
KT-N-K+1 G2-^2+(COSTC(L,N)*Q(I,K)*RBETA(I,LWL,KT)) CONTINUE KG-IPER+(LWL-1)*NPER G(KG)-G(KG)+G2 GO TO 300 CONTINUE CONTINUE CONTINUE RETURN END
72
FUNal090 FUNallOO FUNalllO FUNall20 FUNall30 FUNall40 FUNallSO FUNall60 FUNall70 FUNallSO FUNall90
220 225 230
235 240
245 250
260
270 280 300
CONTINUE GO TO 230 CONTINUE CONTINUE DO 300 LWL-l.NPWLS REWIND 19 IF(LWL.EQ.1)GO TO 240 LSKIP-LWL-1 DO 235 ISKIP-l.LSKIP READ(19,50)DUMMY DO 250 I-l.NDWLS DO 250 N-l.NPER IF(I.EQ.l .AND. N.EQ.1)GO TO 250 NSKIP-NRES-1 DO 245 ISKIP-l.NSKIP READ(19,50)DUMMY READ(19,50)RBETA(I,N) DO 300 IPER-l.NPER G2-0.0 DO 280 L-l.NPWLS DO 270 N-l.NPER IF(L.NE.LWL .OR. N.NE.IPER)GO TO 270 DO 260 I-l.NDWLS DO 260 K-l.N KT-N-K+1 G2-G2+(COSTC(L,N)*Q(I,K)*RBETA(I,KT)) CONTINUE KG-IPER+(LWL-1)*NPER G(KG)-G(KG)+G2 GO TO 300 CONTINUE CONTINUE CONTINUE RETURN END
75
FUNblOSO FUNbl090 FUNbllOO FUNblllO FUNbll20 FUNbll30 FUNbll40 FUNbllSO FUNbll60 FUNbll70 FUNbllSO FUNbll90 FUNbl200 FUNbl210 FUNbl220 FUNbl230 FUNbl240 FUNbl250 FUNbl260 FUNbl270 FUNbl280 FUNbl290 FUNbl300 FUNbl310 FUNbl320 FUNbl330 FUNbl340 FUNbl350 FUNbl360 FUNbl370 FUNbl380 FUNbl390 FUNbl400 FUNbl410 FUNbl420
T£
1*7
LZ
0£
*?l
91
T
0*T
T OT
6


![Linear and Quadratic Inequalities [PDF]](https://m.moam.info/img/260x300/linear-and-quadratic-inequalities-pdf_64849792098a9e0c378b45e3.jpg)