sensors Article
Arbitrarily Accessible 3D Microfluidic Device for Combinatorial High-Throughput Drug Screening Zhuofa Chen 1 , Weizhi Li 2 , Gihoon Choi 1 , Xiaonan Yang 1 , Jun Miao 2 , Liwang Cui 2 and Weihua Guan 1,3, * 1 2 3
*
Department of Electrical Engineering, Pennsylvania State University, University Park, PA 16802, USA;
[email protected] (Z.C.);
[email protected] (G.C.);
[email protected] (X.Y.) Department of Entomology, Pennsylvania State University, University Park, PA 16802, USA;
[email protected] (W.L.);
[email protected] (J.M.);
[email protected] (L.C.) Department of Biomedical Engineering, Pennsylvania State University, University Park, PA 16802, USA Correspondence:
[email protected]; Tel.: +1-814-867-5748
Academic Editors: Amine Miled and Jesse Greener Received: 26 August 2016; Accepted: 23 September 2016; Published: 29 September 2016
Abstract: Microfluidics-based drug-screening systems have enabled efficient and high-throughput drug screening, but their routine uses in ordinary labs are limited due to the complexity involved in device fabrication and system setup. In this work, we report an easy-to-use and low-cost arbitrarily accessible 3D microfluidic device that can be easily adopted by various labs to perform combinatorial assays for high-throughput drug screening. The device is capable of precisely performing automatic and simultaneous reagent loading and aliquoting tasks and performing multistep assays with arbitrary sequences. The device is not intended to compete with other microfluidic technologies regarding ultra-low reaction volume. Instead, its freedom from tubing or pumping systems and easy operation makes it an ideal platform for routine high-throughput drug screening outside traditional microfluidic labs. The functionality and quantitative reliability of the 3D microfluidic device were demonstrated with a histone acetyltransferase-based drug-screening assay using the recombinant Plasmodium falciparum GCN5 enzyme, benchmarked with a traditional microtiter plate-based method. This arbitrarily accessible, multistep capable, low-cost, and easy-to-use device can be widely adopted in various combinatorial assays beyond high-throughput drug screening. Keywords: microfluidic; high-throughput; combinatorial; multiplex; drug screening
1. Introduction High-throughput techniques are critically needed for efficient screening of pharmaceutically valuable lead compounds. The rapid progress of high-throughput screening (HTS) has enabled parallel analysis of thousands of reactions in order to identify effective compounds for a particular biological process. Most of the current HTS technologies involve robotics for automatic liquid and plate handling (96-, 384-, and 1536-well) [1–5]). Although the throughput has been increased tremendously by robotic technology as compared to manual operations [6], the high cost associated with the instrument has restricted many researchers from performing HTS independently. In addition, the volume required in the microtiter plate (100 µL and above) translates into a high cost for biological samples and drug libraries. As a result, there is a strong desire to develop low-cost technologies that require less sample and reagent consumption. To that end, the microfluidics-based drug-screening platform has been proposed due to its reduced reagent consumption, low cost, and high throughput [7–10]. In the past few years, significant progress has been achieved in developing microfluidics-based drug-screening components and systems. For example, the valve-based high-content microfluidic chamber arrays for a cell-based drug screening assay have been demonstrated [11–15]. The flow
Sensors 2016, 16, 1616; doi:10.3390/s16101616
www.mdpi.com/journal/sensors
Sensors 2016, 16, 1616
2 of 12
diffusive mixing-based systems provided a versatile method to generate on-chip concentration gradients [16–21]. The droplet-based microfluidics has shown nanoliter to picoliter compartmentalization in a high-throughput manner [22–26]. In addition, a low-cost slip chip provided a facile and economic method for performing microfluidic reactions without pumps or valves [10]. Recently, low-cost and easy-to-use 3D microfluidic chips have been introduced for high-throughput screening [27,28]. Despite impressive progress in microfluidics-based drug screening, challenges still remain. First, performing a multistep (>2 steps) combinatorial assay is a big challenge for most existing systems due to the difficulty in fluidic control. Second, microfluidic systems that require peripheral tubing and pumping system are too complex to operate by non-microfluidic researchers. Third, though there are commercial microwell plates in the volume range of a few microliters (e.g., Corning, Labcyte etc.), the reagent loading and aliquoting schemes are still labor-intensive due to its serial nature. As a result, there is a strong desire to develop an easy-to-use, low-cost, and multistep-assay-compatible microfluidic system that can be used by ordinary labs to perform HTS. In this study, we describe an arbitrarily accessible, tubing-and-pumping-system-free, and multistep-assay-compatible 3D microfluidic device for HTS that can be routinely adopted by ordinary labs. Our microfluidic devices use a few hundred nanoliters to microliter to avoid the evaporation challenges common in nanoliter- to picoliter-scale multistep assays [29,30]. The device consists of sample-loading chips and auto-aliquoting chips for rapid, precise, automatic, and simultaneous heterogeneous/homogeneous reagent array formation. As a proof of concept, the device was validated with a recombinant Plasmodium falciparum GCN5 (Pf GCN5) enzyme-based drug-screening assay. The Pf GCN5 enzyme plays an important role in the regulation of chromatin structure and thus gene transcription in malaria parasites [31,32]; inhibition of Pf GCN5 activity is believed to be a potential target for novel chemotherapies of malaria [33–35]. The excellent quantitative agreement between the arbitrarily accessible 3D microfluidic device and the gold-standard 96-well microtiter plate demonstrates the reliability, robustness, and accuracy of the 3D microfluidic device. As the tubing-and-pumping-system-free 3D microfluidic device capable of performing multistep combinatorial assays with arbitrary sequences, we believe it offers unprecedented opportunities for low-cost and high-throughput drug screening in various laboratory settings. 2. Materials and Methods 2.1. Materials and Chemicals Polymethylmethacrylate (PMMA) sheets were from ePlastics. Food dye was from AmeriColor. HAT Activity Fluorometric Assay Kit was obtained from Biovision (Biovision Incorporated, Milpitas, CA, USA). Calcein and histone acetyltransferase (HAT) inhibitors (curcumin, cyclopentylidene[4-(40 -chlorophenyl) thiazol-2-yl] hydrazine (CPTH-2), and (2R, 3S)-rel-4-methylene-5-oxo-2propyltetrahydrofuran-3-carboxylic acid (MB-3)) were obtained from Sigma-Aldrich (St. Louis, MO, USA). 2.2. Device Design and Fabrication The 3D microfluidic device consists of (1) a sample-loading chip; and (2) an auto-aliquoting chip (Figure S1). Both chip patterns were designed in AutoCAD 2015 (Autodesk Inc., San Rafael, CA, USA). The chips were fabricated with PMMA, which was patterned by the CO2 laser cutting machine (Epilog Laser Inc., Golden, CO, USA) with a power of 100%, a speed of 25% (for sample-loading chip of 1.6 mm thick), 30% (for auto-aliquoting chip of 1 mm thick), 60% (for spacer of 0.8 mm thick), and a frequency of 5000 Hz. After laser cutting, both chips were thoroughly cleaned in distilled water and isopropyl alcohol for 10 min. Both chips were then sandwiched between two metal plates and annealed in the oven for 24 h at 90 ◦ C for stress relief. The sample-loading chip was then used as it is, whereas the auto-aliquoting chip was surface-coated with a thin layer of hydrophobic wax by
Sensors 2016, 16, 1616
3 of 12
◦ laminating with a 12 sealed Sensors 2016, 16,the 1616wax paper at 120 C (Apache AL13P). The fabricated chips were kept in 3 of package before use. More detailed fabrication information can be found in Supplementary Materials.
the wax paper at 120 °C (Apache AL13P). The fabricated chips were kept in a sealed package before
2.3. Device Operation use. More detailed fabrication information can be found in Supplementary Materials. The arbitrarily accessible 3D microfluidic device starts in a high-throughput manner to form 2.3. Device Operation heterogeneous or homogeneous reagent arrays. (1) For heterogeneous array formation (Figure 1a), The arbitrarily accessible 3D microfluidic device starts in a high-throughput manner to form reagents with various concentrations were prepared and diluted in a 96-well plate and then dispensed heterogeneous or homogeneous reagent arrays. (1) For heterogeneous array formation (Figure 1a), onto the sample-loading chip with an HTS-compatible pipetting system (left illustration in Figure 1a). reagents with various concentrations were prepared and diluted in a 96-well plate and then Afterward, the auto-aliquoting chip was simply on top of thepipetting sample-loading chip, with a spacer dispensed onto the sample-loading chip with placed an HTS-compatible system (left illustration of 0.8inmm height (middle illustration in Figure 1a). The auto-aliquoting chip was then Figure 1a). Afterward, the auto-aliquoting chip was simply placed on top of the sample-loadingseparated chip, from with the sample-loading chip. Due to the illustration capillary force, the1a). auto-aliquoting chip efficiently formed a spacer of 0.8 mm height (middle in Figure The auto-aliquoting chip was then a uniform andfrom heterogeneous reagentchip. array, each ofcapillary a volume of ~2 (right illustration in Figure 1a); separated the sample-loading Due to the force, theµL auto-aliquoting chip efficiently formed a uniform and heterogeneous of a scraping volume of process ~2 μL (right illustrationtoinform (2) For homogeneous array formation reagent (Figurearray, 1b), each a facile is sufficient Figurearray 1a). (2) For the homogeneous formation (Figure a facilevarious scraping processheterogeneous is sufficient to and a uniform with help of thearray capillary force. After1b), forming desired form a uniform array with the help of the capillary force. After forming various homogeneous reagents arrays, a combinatorial assay can be performed by aligning anddesired arbitrarily heterogeneous and homogeneous reagents arrays, a combinatorial assay can be performed by combining these microarrays (Figure 1c). Figure 1d shows the photograph of the device with the aligning and arbitrarily combining these microarrays (Figure 1c). Figure 1d shows the photograph of auto-aliquoting chip placed on top of the sample-loading chip. We did not find any liquid evaporation the device with the auto-aliquoting chip placed on top of the sample-loading chip. We did not find issuesany during time course of during the experiment. liquidthe evaporation issues the time course of the experiment.
Figure 1. Schematic demonstration and photograph of the 3D microfluidic device. (a) Heterogeneous
Figure 1. Schematic demonstration and photograph of the 3D microfluidic device. (a) Heterogeneous array formation. Heterogeneous reagents were loaded by high-throughput pipetting system onto the arraysample-loading formation. Heterogeneous were high-throughput pipetting system onto chip. The pinningreagents effect holds the loaded liquid onby each sample-loading island. By combining the sample-loading chip. The pinning effect holds the liquid on each sample-loading and separating the auto-aliquoting chip with the sample-loading chip (with a 0.8 mm high spacer), island. a By combining and separating auto-aliquoting chip(b) with the sample-loading chip (with a 0.8 mm high heterogeneous reagent arraythe is automatically formed; Homogeneous array formation. Homogeneous spacer), a heterogeneous is automatically formed; Homogeneous array formation. reagent (e.g., enzyme reagent solution array or histone acetyltransferase (HAT)(b) reaction mixture solution) was simply scraped over (e.g., the wax-treated auto-aliquoting chip;acetyltransferase (c) Exemplary arbitrary combination of Homogeneous reagent enzyme solution or histone (HAT) reaction mixture three was auto-aliquoting chips. The mixing of various reagents is achieved by the (c) diffusion process;arbitrary (d) solution) simply scraped over the wax-treated auto-aliquoting chip; Exemplary Photograph of theauto-aliquoting device with thechips. auto-aliquoting chip top of the sample-loading combination of three The mixing of placed variousonreagents is achieved by thechip. diffusion Note the schematic is not drawn to scale. The scale bar in the photograph is 1 cm. process; (d) Photograph of the device with the auto-aliquoting chip placed on top of the sample-loading chip. Note the schematic is not drawn to scale. The scale bar in the photograph is 1 cm.
Sensors 2016, 16, 1616
4 of 12
2.4. Device Validation To evaluate the uniformity and reaction performance of the 3D microfluidic device, we carried out validation experiments using the plain food dyes as well as the fluorescent calcein dye. For the food dye experiment, different colored food dyes were loaded and aliquoted to form a heterogeneous array and a homogenous array, using the methods mentioned above. For the fluorescent calcein dye experiment, calcein with concentrations ranging from 0.02 µM to 2.5 µM was used to form a heterogeneous array. A homogeneous array was formed with 1.25 µM calcein using the scraping method. The homogeneous and heterogeneous chips were then aligned and combined to evaluate the uniformity and accuracy of the device after mixing. 2.5. PfGCN5 Enzyme Purification To purify the Pf GCN5 HAT from the malaria parasite Plasmodium falciparum, a PTP (ProtC-TEV-ProtA) tag was added to the C-terminus of the endogenous Pf GCN5 gene in the malaria parasite as described before [36,37]. Briefly, ~1 kb fragment from the C-terminus end (without the stop codon) of Pf GCN5 was amplified and fused to the PTP tag and 30 UTR region of the P. berghei dhfr-ts gene and cloned into the transfection vector pHD22Y with the human DHFR resistance cassette. Parasite transfection, drug selection, and cloning were performed as described [36,38]. Positive clones were verified by integration-specific PCR. The malaria parasites with PTP-tagged Pf GCN5 were cultured using a standard procedure [39] and the Pf GCN5 was purified by IgG beads under the native condition as described previously [36]. The purified protein was stored at −80 ◦ C until enzymatic analysis. 2.6. HAT Assay for PfGCN5-Based Drug Screening The 3D microfluidic device was applied in the HAT-based drug-screening assay to evaluate various drugs (inhibitors) against the purified Pf GCN5. In this assay, Pf GCN5 catalyzes the transfer of the acetyl group from acetyl–CoA to an H3 histone peptide, generating acetylated peptide and CoA–SH. The CoA–SH reacts with the developer to produce signaling fluorophore that is detected at Ex/Em = 535/587 nm. We first performed the reference experiment to investigate the compatibility of the 3D microfluidic device to the HAT-based assay and to establish the standard curve for the end-product (CoA–SH) according to the manual of HAT Activity Fluorometric Assay Kit. In addition, a pilot HAT-based drug-screening assay using positive controls (Pf GCN5 enzyme and HAT reaction mixture) and negative controls (buffer and HAT reaction mixture) was carried out on the 3D microfluidic device to determine the Z0 -factor and thus the HTS potential of the assay [40]. Finally, several established inhibitors against the Pf GCN5 enzyme, including MB-3, CPTH-2, and curcumin [34,41,42], were used as reference drugs on the 3D microfluidic device and compared with the gold-standard 96-well microtiter plate method. The Pf GCN5 inhibitors were loaded onto the auto-aliquoting chip by the heterogeneous array formation process as described above, whereas Pf GCN5 and the HAT reaction mixture solution were loaded by the homogeneous array formation process. Detailed information of the experiment and the determination of the Z0 -factor and the half maximal inhibitory concentration (IC50 ) are provided in the Supplementary Materials. The inhibitor chip, Pf GCN5 chip, and the HAT reaction mixture solution chip were then aligned and combined with an adaptor and incubated in a custom-built box at room temperature for 40 min in the dark. The combined chips were put on the homemade adapter and analyzed by the Typhoon scanner (GE 9410). With the adapter, the combined plates are 2 mm away from the surface of the scanner to prevent contaminating the scanner. We choose the 3 mm height mode for scanning with Ex/Em = 532/580 nm. The images were analyzed by ImageJ (NIH).
Sensors 2016, 16, 1616 Sensors 2016, 16, 1616
5 of 12 5 of 12
3. Results Resultsand andDiscussion Discussion 3. 3.1. Device Device Design Design Theoretical Theoretical Considerations Considerations 3.1. The sample-loading sample-loading chip chip relies relies on on the the pinning pinning effect effect to to operate. operate. For For aa liquid liquid of of an an equilibrium equilibrium The contact angle θ on a solid surface moving towards a three-phase (liquid/vapor/solid) edge, droplet contact angle θ on a solid surface moving towards a three-phase (liquid/vapor/solid) the edge, the will be pinned at the edge due to the increased liquid/vapor interface area and the increased activation droplet will be pinned at the edge due to the increased liquid/vapor interface area and the increased barrier to move. contact on angle the edge willedge increase from θ to θ +θ α to and droplet cannot activation barrier The to move. Theangle contact on the will increase from θ +the α and the droplet move over the edge until the contact angle exceeds θ + α, as shown in Figure 2a, where α is the surface cannot move over the edge until the contact angle exceeds θ + α, as shown in Figure 2a, where α is bending angle [43–45].angle Our sample-loading chip was fabricated through the surface bending [43–45]. Our sample-loading chip by wascutting fabricated by rectangle-shaped cutting through ◦ , thus the maximum contact angle of a droplet on the sample-loading island windows with α = 90 rectangle-shaped windows with α = 90°, thus the maximum contact angle of a droplet on the sample◦ . As shown in Figure 2b,c, the as-fabricated PMMA chip has a contact angle of 60◦ and the is θ + 90island loading is θ + 90°. As shown in Figure 2b,c, the as-fabricated PMMA chip has a contact angle ◦ , corresponding well to the measured contact anglecontact on the edge island is 150island of 60° and the measured angleof onthe thesample-loading edge of the sample-loading is 150°, corresponding theoretical prediction. This tremendously increased the contact angle and activation and energy helped well to the theoretical prediction. This tremendously increased the contact angle andenergy activation prevent reagent leaking and mixing during the operation of the sample-loading chip. and helped prevent reagent leaking and mixing during the operation of the sample-loading chip.
Figure effectand andchip chipsurface surface treatment. A droplet a solid surface a contact Figure 2. Pinning effect treatment. (a)(a) A droplet on aon solid surface with with a contact angle angle of θ, which be increased θ + αmoving when moving a three-phase (b) The asof θ, which will bewill increased up to θ up + αto when towardstowards a three-phase edge; (b) edge; The as-fabricated ◦ ; (c) The fabricated PMMA showsangle a contact of 60°; (c) The droplet pinned on the sample-loading PMMA chip showschip a contact of 60angle droplet pinned on the sample-loading chip shows ◦ chip a 150° contact angle; (d) Theauto-aliquoting wax treated auto-aliquoting chip shows angle of a 150shows contact angle; (d) The wax treated chip shows a contact angleaofcontact 110◦ . The scale bars in the images are 3 mm. 110°. The scale bars in the images are 3 mm.
Another Another important important aspect aspect of of the the device device operation operation is is the the surface surface wettability. wettability. For For an an as-fabricated as-fabricated PMMA chip without hydrophobic treatment, the observable liquid trace would be PMMA chip without hydrophobic treatment, the observable liquid trace would be left left on on the the chip chip surface. As a result, a hydrophobic surface is desirable. Accordingly, we performed wax treatment surface. As a result, a hydrophobic surface is desirable. Accordingly, we performed wax treatment on on auto-aliquoting chip obtain hydrophobicsurface. surface.As Asshown shownin inFigure Figure 2d, 2d, the the contact thethe auto-aliquoting chip toto obtain a ahydrophobic contact angle angle on the wax-treated auto-aliquoting chip increased to 110°. The wax on the device surface ◦ on the wax-treated auto-aliquoting chip increased to 110 . The wax on the device surface reduces reduces the the surface free energy and thus increases the liquid contact angle, consistent with the previous report surface free energy and thus increases the liquid contact angle, consistent with the previous report [46]. [46]. The hydrophobic property of auto-aliquoting the auto-aliquoting made subsequent operations of the The hydrophobic property of the chipchip made the the subsequent operations of the 3D 3D device more reliable. First, it minimized the liquid trace left on the chip surface during the device more reliable. First, it minimized the liquid trace left on the chip surface during the array array formation formation processes. processes. Second, Second, itit prevented prevented the the liquid liquid from from leaking leaking out out when when several several auto-aliquoting auto-aliquoting chips were combined for reagent mixing and reaction. chips were combined for reagent mixing and reaction. The is achieved by by the the capillary force. Once Once the autoThe heterogeneous heterogeneousarray arrayformation formationprocess process is achieved capillary force. the aliquoting chip is in contact with the sample-loading chip, the capillary force automatically auto-aliquoting chip is in contact with the sample-loading chip, the capillary force automaticallydrives drives the is in a2πaγ LV cos cosθ the liquid liquid into intothe theauto-aliquoting auto-aliquotingchip chiparray. array.At Atequilibrium, equilibrium,the theupward upwardforce forceFupF 2= up
LV
balance with with the downward gravity forceforce , where is theγsurface is in balance the downward gravity ρghπa2,LVwhere surfacebetween tension Fdown Fdown gha2 = LV is thetension between liquid/vapor, a and h are the radius and the depth of the well, respectively, θ is the angle liquid/vapor, a and h are the radius and the depth of the well, respectively, is the contactcontact angle of liquid the surface, solid surface, ρ is the liquid density, g isacceleration the acceleration of gravity of liquid on theon solid liquid density, and gand is the of gravity [47]. [47]. For is the For effective liquid loading, the capillary force needs to overcome the gravity force, which requires effective liquid loading, the capillary force needs to overcome the gravity force, which requires a ≤ 2γ LV cosθ/ρgh. Each well in the auto-aliquoting chip used in the experiment has a radius of a 2LV cos / gh . Each well in the auto-aliquoting chip used in the experiment has a radius of 750 μm 750 µm and height of 1000 µm. This results in a capillary force of 171 µN, much larger than the gravity and height of 1000 μm. This results in a capillary force of 171 μN, much larger than the gravity barrier barrier of 17.3 µN, and thus an efficient sample auto-aliquoting process is guaranteed (Figure 1a). of 17.3 μN, and thus an efficient sample auto-aliquoting process is guaranteed (Figure 1a).
Sensors 2016, 16, 1616 Sensors 2016, 16, 1616
6 of 12 6 of 12
3.2. Quantitative Performances of the 3D Device 3.2. Quantitative Performances of the 3D Device To ofof concept forfor thethe proposed device, we we tested the the 3D microfluidic device with Toestablish establishthe theproof proof concept proposed device, tested 3D microfluidic device plain food dyes and a fluorescent calcein dye. We assessed the 3D microfluidic device by evaluating the with plain food dyes and a fluorescent calcein dye. We assessed the 3D microfluidic device by loading efficiency, uniformity, and accuracy. Figure showsFigure the testing the food dyes. evaluating the loading efficiency, uniformity, and 3a–c accuracy. 3a–c results shows with the testing results Awith heterogeneous array was generated with food dyes of different colors by a heterogeneous array the food dyes. A heterogeneous array was generated with food dyes of different colors by a formation process (Figure 3a). No observable dye3a). trace left overdye thetrace auto-aliquoting chip heterogeneous array formation process (Figure Nowas observable was left over thesurface autoafter combining/separating with the sample-loading chip, indicating a highly efficient and effective aliquoting chip surface after combining/separating with the sample-loading chip, indicating a highly array formation process. The homogeneous array a single dye was formed bydye a homogeneous efficient and effective array formation process. The with homogeneous array with a single was formed array formation process (Figure 3b). Due to the strong hydrophobicity of the chip surface, scraping by a homogeneous array formation process (Figure 3b). Due to the strong hydrophobicitythe of the chip process filled theprocess wells without leaving a liquid traceleaving on the achip surface. By the combining these surface,only the scraping only filled the wells without liquid trace on chip surface. two arrays, a mixing process occurs through the diffusion processthe (Figure 3c). process The color gradients By combining these two arrays, a mixing process occurs through diffusion (Figure 3c). indicated effectiveindicated mixing process. Leaking wasprocess. not observed between two arrays, indicating no The coloran gradients an effective mixing Leaking was notthe observed between the two cross-contamination the combiningduring process. result with theThe foodresult dyeswith validated the arrays, indicating noduring cross-contamination the The combining process. the food operating principle of the 3D microfluidic device. dyes validated the operating principle of the 3D microfluidic device.
Figure3.3.Validation Validationof ofthe the 3D 3D microfluidic microfluidic device with plain Figure plain food food dyes dyesand andfluorescent fluorescentcalcein calceindye. dye. (a–c)Food Fooddye dye validation. The image shows heterogeneous array consisting of different (a–c) validation. The image shows the the heterogeneous array chip chip consisting of different colors colors (a); homogeneous array of acolor single(b); color the chips mixed(c); chips (c).Fluorescent (d–f) Fluorescent (a); homogeneous array chip of chip a single and(b); theand mixed (d–f) calcein calcein dye validation. The scanning images show the heterogeneous array chip (d); homogeneous dye validation. The scanning images show the heterogeneous array chip (d); homogeneous array array chip (e);the and the mixed (f); (g–i) Measured fluorescence intensityfor forthe the heterogeneous heterogeneous array chip (e); and mixed chipschips (f); (g–i) Measured fluorescence intensity array (g);homogeneous homogeneous array chip (i);(i); corresponding to images in (d–f); respectively. The (g); array (h); (h);and andthe themixed mixed chip corresponding to images in (d–f); respectively. fluorescence variation (σ/μ)(σ/µ) within a homogeneous arrayarray is ~2.3% for 120 wells.wells. The The fluorescence variation within a homogeneous is ~2.3% forrepresentative 120 representative excellent agreement between the measured and the fluorescence intensity in thein mixed chip The excellent agreement between the measured andexpected the expected fluorescence intensity the mixed shows that the mixing is reliable and thorough. Error bars correspond to 15 replicates. The scale chip shows that the mixing is reliable and thorough. Error bars correspond to 15 replicates. The bars scale in the are 10 bars in images the images aremm. 10 mm.
Sensors 2016, 16, 1616
7 of 12
To further characterize the quantitative performance of the 3D microfluidic device, we carried 16, 1616 7 of 12 out theSensors test2016, with the fluorescent calcein dye. A heterogeneous array was formed with different concentrations of calcein dye (0.02, 0.04, 0.08, 0.16, 0.31, 0.63, 1.25, and 2.50 μM) using the heterogeneous arraycharacterize formation the process, while performance a homogeneous was formed withwe 1.25 μM of To further quantitative of thearray 3D microfluidic device, carried calceinout using the with homogeneous array formation (Figurearray 3d,e).was Again, nowith dye different trace was the test the fluorescent calcein dye. Aprocess heterogeneous formed detected on the array surfaces. Figure 3f 0.08, shows image of the chips combining the concentrations of calcein dye (0.02, 0.04, 0.16,the 0.31, 0.63, 1.25, andmixed 2.50 µM) usingafter the heterogeneous array formation process, while aarrays. homogeneous array was formed with 1.25 µM using the heterogeneous and homogeneous The quantitative performance can ofbecalcein evaluated from homogeneous array formation process (Figure 3d,e). Again, no dye trace was detected on the array images of Figure 3d–f. First, Figure 3g shows the measurement of the fluorescence intensities of the surfaces. array. Figure The 3f shows the image mixed chips after range combining heterogeneous and 2 =the heterogeneous excellent fit (Rof 0.98) in the linear and the small variations among homogeneous arrays. The quantitative performance can be evaluated from images of Figure 3d–f. replicates demonstrate that the heterogeneous array formation process is successful and reliable. First, Figure 3g shows the measurement of the fluorescence intensities of the heterogeneous array. Second, Figure 3h shows the measurement of the fluorescence intensities of the homogeneous array The excellent fit (R2 = 0.98) in the linear range and small variations among replicates demonstrate that formed by scraping method. The fluorescence intensity variation of each array well was less than the heterogeneous array formation process is successful and reliable. Second, Figure 3h shows the 2.3%, indicating a uniform homogeneous array of formation process. Figure 3i shows the measured and measurement of the fluorescence intensities the homogeneous array formed by scraping method. the expected fluorescence intensity for the combined chip from Figure 3d,e. The excellent quantitative The fluorescence intensity variation of each array well was less than 2.3%, indicating a uniform agreement confirmsarray a thorough reaction mixing achieved. homogeneous formation process. Figurewas 3i shows the measured and the expected fluorescence intensity for the combined chip from Figure 3d,e. The excellent quantitative agreement confirms
3.3. PfGCN5-Based Malaria Drugwas Screening a thorough reaction mixing achieved. After validation ofMalaria the device using dyes, we performed drug screening using the 3.3. PfGCN5-Based Drugperformance Screening PfGCN5 HAT on the 3D microfluidic device. We first performed a control experiment to investigate After validation of the device performance using dyes, we performed drug screening using the the suitability of the 3D microfluidic device for the HAT-based assay and to establish a standard Pf GCN5 HAT on the 3D microfluidic device. We first performed a control experiment to investigate curve for the end-product (CoA–SH) according to the manual of HAT Activity Fluorometric Assay the suitability of the 3D microfluidic device for the HAT-based assay and to establish a standard Kit. The result compared with that of the 96-well microtiter the gold standard. curve for was the end-product (CoA–SH) according to the manual ofplate HATmethod Activity as Fluorometric Assay FigureKit. 4a The illustrates thecompared reaction associated the HAT-based assay [48]. The enzyme result was with that of with the 96-well microtiter plate method as thePfGCN5 gold standard. catalyzes the 4a acetylation thatassociated generateswith CoA–SH. The CoA–SH with the developer Figure illustrates reaction the reaction the HAT-based assay reacts [48]. The Pf GCN5 enzyme to catalyzes the acetylation reaction that4b,c generates CoA–SH. The CoA–SH reacts the developer to produce a signaling fluorophore. Figure show the fluorescence intensity aswith a function of CoA–SH produce areacting signalingwith fluorophore. Figure 4b,c show fluorescencedevice intensity as athe function of CoA–SH concentration the developer in the 3Dthe microfluidic and 96-well microtiter concentration reacting with the developer in the 3D microfluidic device and the 96-well microtiter plate, respectively. The plots show the standard curve of CoA–SH with a good fit for plate, the 3D respectively. show the standard of CoA–SH good respectively. fit for the 3D microfluidic microfluidic deviceThe (R2plots = 0.93) and the 96-wellcurve microtiter plate with (R2 =a0.98), While the 3D device (R2 = 0.93) and the 96-well microtiter plate (R2 = 0.98), respectively. While the 3D microfluidic microfluidic device consumes only 2 μL of reagents per reaction (a 50 times reduction as compared device consumes only 2 µL of reagents per reaction (a 50 times reduction as compared to the volume to the volume of 100 μL in a 96-well microtiter plate), the quantitative performance of the 3D of 100 µL in a 96-well microtiter plate), the quantitative performance of the 3D microfluidic device and microfluidic device and the 96-well microtiter plate remained the same (Figure 4b,c). This confirmed the 96-well microtiter plate remained the same (Figure 4b,c). This confirmed the compatibility of the the compatibility of the 3D microfluidic device for the HAT-based 3D microfluidic device for the HAT-based drug-screening assay. drug-screening assay.
Figure 4. Cont.
Sensors 2016, 16, 1616 Sensors 2016, 16, 1616
8 of 12 8 of 12
Figure 4. (a) Schematic illustration of HAT-based assay reaction. The PfGCN5 enzyme catalyzes the acetylation and generates CoA–SH. The CoA–SH then reacts with the developer to produce signaling fluorophore; (b,c) the fluorescence intensity as a function of CoA–SH concentration on the 3D microfluidic device (b) and the 96-well microtiter plate (c). The insets show the scanning images Figure HAT-based assay reaction. TheThe PfGCN5 enzyme catalyzes the Figure 4. 4. (a) (a)Schematic Schematicillustration illustrationofof HAT-based assay reaction. Pf GCN5 enzyme catalyzes corresponding to the plots in (b,c). The reaction volume in the 3D microfluidic device is 2 μL, 50 times acetylation and generates CoA–SH. The CoA–SH then reacts thewith developer to produce the acetylation and generates CoA–SH. The CoA–SH thenwith reacts the developer tosignaling produce less thanfluorophore; the 100 fluorophore; μL(b,c) in the Theasred line is fitting for the linear range, the 96-well fluorescence intensityplate. as a function of CoA–SH concentration on the 3D signaling (b,c) themicrotiter fluorescence intensity a function of CoA–SH concentration on which 2 (b) and the 96-well microtiter plate (c).plate The insets show theshow scanning images and(b) 0.98 for 3D microfluidic device and the 96-well plate, shows a microfluidic good ofdevice R = 0.93 the 3D fit microfluidic device and thethe 96-well microtiter (c). The insets the microtiter scanning corresponding to the plots in (b,c). The reaction volume in the 3D microfluidic device is 2 μL, 50 times images corresponding to indicated the plots inthe (b,c). The reaction volume thedetection, 3D microfluidic device is respectively. The dashed line optical scanner’s limitinof which is determined less than the 100 μLthan in the plate. The red plate. line is The fitting the 2 µL, 50 times less the96-well 100 µL microtiter in the 96-well microtiter redfor line is linear fittingrange, for thewhich linear as two standard deviations2 above the background from the negative control (buffer and HAT reaction 0.93 and the and 3D microfluidic device and the 96-well plate, shows good shows fit of R a=good range, awhich fit of0.98 R2 for = 0.93 0.98 for the 3D microfluidic devicemicrotiter and the 96-well mixture).respectively. Error barsThe correspond to three replicates. dashed lineThe indicated scanner’s limitscanner’s of detection, is determined microtiter plate, respectively. dashedthe lineoptical indicated the optical limitwhich of detection, which is determined as two standard deviations above thefrom background fromcontrol the negative (buffer and as two standard deviations above the background the negative (buffercontrol and HAT reaction
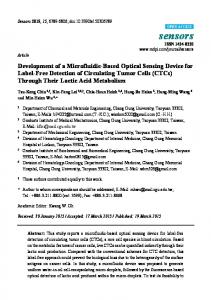
Pilot HAT-based drug-screening assays using positive HAT reaction mixture). Error bars to three replicates.and negative controls were carried out mixture). Error bars correspond to correspond three replicates. on the 3D microfluidic device to determine the Z′-factor, an indicator of the HTS potential of the assay Pilot HAT-based drug-screening assays using positive and negative controls were out HAT-based drug-screening assays of using negative controls were carried carried out [40]. Figure 5Pilot shows the fluorescence intensity the positive positiveand and negative controls of the HAT-based on the 3D microfluidic device to determine the Z′-factor, an indicator of the HTS potential of the assay 0 on the 3D microfluidic device to determine the Z -factor, an indicator of the HTS potential of the drug-screening assay. Thethepositive controls have a mean value of 35,576 and of a standard deviation of [40]. shows fluorescence intensity of the positive and negative controls the HAT-based assayFigure [40]. 5Figure 5 shows the fluorescence intensity of the positive and negative controls of the 613. Thedrug-screening negative controls a mean value of controls 28,149 aa of standard deviation of 608. The assay. have The positive controls have a meanand value 35,576 and standard ofZ′-factor HAT-based drug-screening assay. The positive have mean value ofa 35,576 anddeviation a standard 613. The negative controls have a mean value of 28,149 and a standard deviation of 608. The Z′-factor determined fromof120 in three independent experiments on athe 3D microfluidic device was deviation 613.replicates The negative controls have a mean value of 28,149 and standard deviation of 608. determined from 120 replicates in three independent experiments on the 3D microfluidic device was 0 0.507, suggesting that it is suitable forreplicates HTS [40]. The small variation of positive and negative The Z -factor determined from 120 in three independent experiments on thecontrols 3D microfluidic 0.507, suggesting that it is suitable for HTS [40].for TheHTS small variation of positive controls and negative device was 0.507, suggesting that it is suitable [40]. The small variation of positive controls controls from different experiments also indicates the stability and reproducibility of the 3D controls fromcontrols different experiments also indicates the stability and reproducibility of theof 3D and negative from different experiments also indicates the stability and reproducibility the microfluidic device.device. microfluidic 3D microfluidic device.
4.0 4.0
Positive control Positive control Negative controlcontrol Negative
pp p p
RFU ( 104 )
RFU ( 104 )
3.6
3.6
3.2
'-factor=0.507 nn
3.2
2.8
'-factor=0.507
nn
2.8 0
20
40 60 80 Sample Number
100
120
0 40 60 80 100 Figure 5. Z′-factor determination of20 the HAT-based drug-screening assay120 on the 3D microfluidic Sample Number device. The solid horizontal lines show the mean values of the positive control and negative control. and dashdetermination lines display of standard deviations (σ) from the mean value of positive control 0 -factor Figure 5. Zred the HAT-based drug-screening assay on assay the 3D microfluidic Figure 5.Black Z′-factor determination of3 the HAT-based drug-screening on the 3Ddevice. microfluidic and negative control data set. The Z′-factor is determined to be 0.507 according to The solid horizontal lines show the mean values of the positive control and negative control. Black and device. The solid horizontal lines show the mean values of the positive controlthat and negative control. . A Z′-factor in the range between 0.5 and 1 indicates the assay is Z ' 1 (3 3 )/ | | red dash lines display p n p 3 nstandard deviations (σ) from the mean value of positive control and negative
Black and red dash lines display 3 standard deviations (σ) from the mean value of positive control control data set. The Z0 -factor is determined to be 0.507 according to Z 0 = 1 − (3σ p + 3σn )/|µ p − µn |. suitable for HTS. and negative control data set. 0.5The isthedetermined A Z0 -factor in the range between and 1Z′-factor indicates that assay is suitabletofor be HTS. 0.507 according to . A Z′-factor in the range between 0.5 and 1 indicates that the assay is Z ' 1 (3After p 3confirming n )/ | p the n | compatibility of the HAT-based assay with the 3D microfluidic device, MB-3, CPTH-2, and curcumin were used as reference compounds on the 3D microfluidic device and
suitable for HTS.
After confirming the compatibility of the HAT-based assay with the 3D microfluidic device, MB-3, CPTH-2, and curcumin were used as reference compounds on the 3D microfluidic device and
Sensors 2016, 16, 1616
9 of 12
Sensors 2016, 16, 1616
9 of 12
After confirming the compatibility of the HAT-based assay with the 3D microfluidic device, MB-3, compared with the 96-well microtiter platecompounds method. Figure that device MB-3, and CPTH-2, and CPTH-2, and curcumin were used as reference on the 63Dshowed microfluidic compared curcumin are strong inhibitors of the PfGCN5 HAT, consistent with previous reports [34,41,42]. with the 96-well microtiter plate method. Figure 6 showed that MB-3, CPTH-2, and curcumin are strong Higher concentrations of HAT, theseconsistent compounds inhibited PfGCN5 enzyme andconcentrations resulted in less inhibitors of the Pf GCN5 with previousmore reports [34,41,42]. Higher of CoA–SH (Figure 4a), leading to lower fluorescence intensity. IC50CoA–SH values determined the 3D these compounds inhibited more Pf GCN5 enzyme and resultedThe in less (Figure 4a), on leading to microfluidic device intensity. and in the The 96-well plate were on comparable, with a variation smaller lower fluorescence IC50microtiter values determined the 3D microfluidic device and inthan the 11% (120 and 134 plate μM for MB-3, 127 and with 116 μM for CPTH-2, 3.85 and 3.38 μMand for134 curcumin using 96-well microtiter were comparable, a variation smaller than 11% (120 µM for MB-3, the and 3D microfluidic device and microtiter plate,using respectively). The excellent agreement 127 116 µM for CPTH-2, 3.85the and96-well 3.38 µM for curcumin the 3D microfluidic device and the betweenmicrotiter the two results demonstrates The the reliability, robustness, and accuracy the 3Ddemonstrates microfluidic 96-well plate, respectively). excellent agreement between the twoofresults device. the reliability, robustness, and accuracy of the 3D microfluidic device. 3D device 96-well plate
0.0
1.0
Normalized RFU
0.5
3D device 96-well plate
1.0
Normalized RFU
Normalized RFU
1.0
0.5
0.0 10
120 134 100 MB-3 concentration (M)
(a)
1000
3D device 96-well plate
0.5
0.0 10
116 127 100 CPTH-2 concentration (M)
(b)
1000
3.38 3.85 1 10 100 Curcumin concentration (M)
(c)
Figure 6. Drug response curves of the Pf GCN5 enzyme to (a) MB-3; (b) CPTH-2 and (c) curcumin on PfGCN5 the 3D microfluidic GCN5 was tested under serial microfluidic device device (black) (black) and and 96-well 96-well microtiter microtiter plate plate (red). (red). Pf PfGCN5 concentrations of drugs. The The plots plots show show the the normalized normalized relative relative fluorescence fluorescence unit as a function of drug concentration, where IC50 is the drug concentration at which normalized relative fluorescence 50 is units (RFU) is 0.5, 50 are indicated on the plot. Error bars 0.5, indicating indicating 50% 50% inhibition. inhibition. The extracted extracted IC IC50 correspond to three replicates. replicates.
Device 3.4. Versatility and Adaptability of the 3D Microfluidic Device It is worth noting that we do not envision the 3D microfluidic device to compete with picoliter to nanoliter technologies (e.g., droplet microfluidics [22,25]). The advantages of our 3D microfluidic the following: following: (1) High-throughput. High-throughput. By adopting the heterogeneous and homogeneous homogeneous device are the array formation processes, the 3D microfluidic device allows parallel reagent loading and aliquoting in a much faster method (a few seconds) than the serial loading process using a pipetting system hours). (2) Multiplexity. (minutes to hours); Multiplexity. With the automatic heterogeneous array formation process from libraryofofreagents, reagents,various various reagents be simultaneously arrayed 3D microfluidic a library reagents cancan be simultaneously arrayed usingusing the 3Dthe microfluidic device. device. It is noteworthy that reagents from different auto-aliquoting chips can be in mixed in parallel It is noteworthy that reagents from different auto-aliquoting chips can be mixed parallel by the by the combinatorial process, ensuring simultaneous incubation for each individual reactions. (3) combinatorial process, ensuring simultaneous incubation for each individual reactions; (3) Versatility. Versatility. The combinatorial of the 3D device microfluidic for any multistep assay The combinatorial nature of thenature 3D microfluidic allowsdevice for anyallows multistep assay with arbitrary with arbitrary incubation sequence. A device capable the of performing the multistep is highly incubation sequence. A device capable of performing multistep assay is highly assay desirable since since a variety of biological require a series ofreactions. combinatorial reactions. Besides, the adesirable variety of biological assays require aassays series of combinatorial Besides, the 3D microfluidic 3D microfluidic is versatile withmethods, various as readout methods, detection cantobevarious easily device is versatiledevice with various readout the detection canasbethe easily extended extendedsetups; to various imaging setups. Both the device materials (PMMA, 0.04and dollars imaging (4) Low-Cost. Both (4) theLow-Cost. device materials (PMMA, 0.04 dollars per chip) the per chip) and the fabrication processis(laser cutting) is cost-effective. The device operation requiresand no fabrication process (laser cutting) cost-effective. The device operation requires no tubing tubing and pumping instruments and can be easily adapted other labs without microfluidics pumping instruments and thus can be thus easily adapted to other labstowithout microfluidics experience experience and microfluidics infrastructures. and microfluidics infrastructures. 4. Conclusions Conclusions We We report report an an easy-to-use, easy-to-use, scalable, scalable, and cost-effective cost-effective 3D arbitrary microfluidic microfluidic device device for an HTS purpose. Using Using an an HAT-based malaria drug-screening assay as a model system, we evaluated the
drug-screening performance and benchmarked it with the gold-standard 96-well microtiter plate method. The demonstrated 3D arbitrary microfluidic device is capable of easily performing automatic and simultaneous reagent aliquoting due to its parallel nature, as well as performing an
Sensors 2016, 16, 1616
10 of 12
drug-screening performance and benchmarked it with the gold-standard 96-well microtiter plate method. The demonstrated 3D arbitrary microfluidic device is capable of easily performing automatic and simultaneous reagent aliquoting due to its parallel nature, as well as performing an arbitrary sequence of assay steps. The device is not intended to compete with other microfluidic technologies regarding ultra-low reaction volumes (e.g., pL–nL in droplet microfluidics [22,25]). Instead, the operation of the device does not require any peripheral tubing or pumping systems, which makes it an ideal platform for ordinary labs to perform high-throughout, multistep drug-screening assays. The current device can be easily scaled up to an array size of 1056 with reagent consumption of ~100 nL per reaction. A thorough screening of a small chemical library against Pf GCN5 is currently underway. We believe that the 3D arbitrary microfluidic device is not only valuable as a general platform for high-throughput drug-screening, but could also be widely extended to various other bioassays. Supplementary Materials: The supplementary materials are available online at http://www.mdpi.com/14248220/16/10/1616/s1. Supplementary text includes the design and fabrication of the 3D microfluidic device and the experiment operation of the HAT-based assay. Figure S1 shows the design schematic and images of (a) the sample-loading chip and (b) auto-aliquoting chip. Figure S2 shows the PfGCN5 activity in HAT assay. Acknowledgments: This project was partly supported by the Penn State CTSI Grant (UL Tr000127) from the National Center for Advancing Translational Sciences, National Institutes of Health. The content is solely the responsibility of the authors and does not necessarily represent the official views of the NIH. This project was also supported by Penn State Startup Fund (Guan). Author Contributions: Zhuofa Chen conceived and performed the research; Weihua Guan supervised the study; Zhuofa Chen and Weizhi Li performed the drug-screening assay; Jun Miao extracted the Pf GCN5; Zhuofa Chen, Xiaonan Yang, and Gihoon Choi analyzed the data; Zhuofa Chen wrote the manuscript and discussed with Weihua Guan, Liwang Cui, and Jun Mao. Conflicts of Interest: The authors declare no conflict of interest.
References 1.
2. 3.
4.
5.
6.
7. 8.
9. 10.
Shi, X.X.; Sha, S.S.; Liu, L.K.; Li, X.; Ma, Y.F. A 96-well microtiter plate assay for high-throughput screening of Mycobacterium tuberculosis dTDP-D-glucose 4,6-dehydratase inhibitors. Anal. Biochem. 2016, 498, 53–58. [CrossRef] [PubMed] Semedo, M.C.; Karmali, A.; Fonseca, L. A novel colorimetric assay of beta-D-glucans in basidiomycete strains by alcian blue dye in a 96-well microtiter plate. Biotechnol. Prog. 2015, 31, 1526–1535. [CrossRef] [PubMed] Booij, P.; Vethaak, A.D.; Leonards, P.E.G.; Sjollema, S.B.; Kool, J.; de Voogt, P.; Lamoree, M.H. Identification of photosynthesis inhibitors of pelagic marine algae using 96-well plate microfractionation for enhanced throughput in effect-directed analysis. Environ. Sci. Technol. 2014, 48, 8003–8011. [CrossRef] [PubMed] Judson, R.; Kavlock, R.; Martin, M.; Reif, D.; Houck, K.; Knudsen, T.; Richard, A.; Tice, R.R.; Whelan, M.; Xia, M.H.; et al. Perspectives on validation of high-throughput assays supporting 21st century toxicity testing. ALTEX 2013, 30, 51–66. [CrossRef] [PubMed] Attene-Ramos, M.S.; Miller, N.; Huang, R.L.; Michael, S.; Itkin, M.; Kavlock, R.J.; Austin, C.P.; Shinn, P.; Simeonov, A.; Tice, R.R.; et al. The Tox21 robotic platform for the assessment of environmental chemicals—From vision to reality. Drug Discov. Today 2013, 18, 716–723. [CrossRef] [PubMed] Conway, M.K.; Gerger, M.J.; Balay, E.E.; O’Connell, R.; Hanson, S.; Daily, N.J.; Wakatsuki, T. Scalable 96-well plate based iPSC culture and production using a robotic liquid handling system. J. Vis. Exp. 2015, 99, e52755. [CrossRef] [PubMed] Du, G.; Fang, Q.; den Toonder, J.M. Microfluidics for cell-based high throughput screening platforms—A review. Anal. Chim. Acta 2016, 903, 36–50. [CrossRef] [PubMed] Li, X.; Zhang, X.; Zhao, S.; Wang, J.; Liu, G.; Du, Y. Micro-scaffold array chip for upgrading cell-based high-throughput drug testing to 3D using benchtop equipment. Lab Chip 2014, 14, 471–481. [CrossRef] [PubMed] Neuzi, P.; Giselbrecht, S.; Lange, K.; Huang, T.J.; Manz, A. Revisiting lab-on-a-chip technology for drug discovery. Nat. Rev. Drug Discov. 2012, 11, 620–632. [CrossRef] [PubMed] Du, W.; Li, L.; Nichols, K.P.; Ismagilov, R.F. SlipChip. Lab Chip 2009, 9, 2286–2292. [CrossRef] [PubMed]
Sensors 2016, 16, 1616
11. 12.
13. 14. 15. 16. 17.
18. 19. 20. 21. 22. 23. 24.
25.
26.
27.
28. 29. 30.
31. 32.
11 of 12
Kim, J.; Taylor, D.; Agrawal, N.; Wang, H.; Kim, H.; Han, A.; Rege, K.; Jayaraman, A. A programmable microfluidic cell array for combinatorial drug screening. Lab Chip 2012, 12, 1813–1822. [CrossRef] [PubMed] Park, E.S.; Brown, A.C.; DiFeo, M.A.; Barker, T.H.; Lu, H. Continuously perfused, non-cross-contaminating microfluidic chamber array for studying cellular responses to orthogonal combinations of matrix and soluble signals. Lab Chip 2010, 10, 571–580. [CrossRef] [PubMed] Wang, Z.H.; Kim, M.C.; Marquez, M.; Thorsen, T. High-density microfluidic arrays for cell cytotoxicity analysis. Lab Chip 2007, 7, 740–745. [CrossRef] [PubMed] Kane, B.J.; Zinner, M.J.; Yarmush, M.L.; Toner, M. Liver-specific functional studies in a microfluidic array of primary mammalian hepatocytes. Anal. Chem. 2006, 78, 4291–4298. [CrossRef] [PubMed] Unger, M.A.; Chou, H.P.; Thorsen, T.; Scherer, A.; Quake, S.R. Monolithic microfabricated valves and pumps by multilayer soft lithography. Science 2000, 288, 113–116. [CrossRef] [PubMed] Yang, C.G.; Wu, Y.F.; Xu, Z.R.; Wang, J.H. A radial microfluidic concentration gradient generator with high-density channels for cell apoptosis assay. Lab Chip 2011, 11, 3305–3312. [CrossRef] [PubMed] Selimovic, S.; Sim, W.Y.; Kirn, S.B.; Jang, Y.H.; Lee, W.G.; Khabiry, M.; Bae, H.; Jambovane, S.; Hong, J.W.; Khademhosseini, A. Generating nonlinear concentration gradients in microfluidic devices for cell studies. Anal. Chem. 2011, 83, 2020–2028. [CrossRef] [PubMed] Sugiura, S.; Hattori, K.; Kanamori, T. Microfluidic serial dilution cell-based assay for analyzing drug dose response over a wide concentration range. Anal. Chem. 2010, 82, 8278–8282. [CrossRef] [PubMed] Ye, N.N.; Qin, J.H.; Shi, W.W.; Liu, X.; Lin, B.C. Cell-based high content screening using an integrated microfluidic device. Lab Chip 2007, 7, 1696–1704. [CrossRef] [PubMed] Qin, J.H.; Ye, N.N.; Liu, X.; Lin, B.C. Microfluidic devices for the analysis of apoptosis. Electrophoresis 2005, 26, 3780–3788. [CrossRef] [PubMed] Jeon, N.L.; Dertinger, S.K.W.; Chiu, D.T.; Choi, I.S.; Stroock, A.D.; Whitesides, G.M. Generation of solution and surface gradients using microfluidic systems. Langmuir 2000, 16, 8311–8316. [CrossRef] Guo, M.T.; Rotem, A.; Heyman, J.A.; Weitz, D.A. Droplet microfluidics for high-throughput biological assays. Lab Chip 2012, 12, 2146–2155. [CrossRef] [PubMed] Baraban, L.; Bertholle, F.; Salverda, M.L.M.; Bremond, N.; Panizza, P.; Baudry, J.; de Visser, J.A.G.M.; Bibette, J. Millifluidic droplet analyser for microbiology. Lab Chip 2011, 11, 4057–4062. [CrossRef] [PubMed] Trivedi, V.; Doshi, A.; Kurup, G.K.; Ereifej, E.; Vandevord, P.J.; Basu, A.S. A modular approach for the generation, storage, mixing, and detection of droplet libraries for high throughput screening. Lab Chip 2010, 10, 2433–2442. [CrossRef] [PubMed] Brouzes, E.; Medkova, M.; Savenelli, N.; Marran, D.; Twardowski, M.; Hutchison, J.B.; Rothberg, J.M.; Link, D.R.; Perrimon, N.; Samuels, M.L. Droplet microfluidic technology for single-cell high-throughput screening. Proc. Natl. Acad. Sci. USA 2009, 106, 14195–14200. [CrossRef] [PubMed] Clausell-Tormos, J.; Lieber, D.; Baret, J.C.; El-Harrak, A.; Miller, O.J.; Frenz, L.; Blouwolff, J.; Humphry, K.J.; Koster, S.; Duan, H.; et al. Droplet-based microfluidic platforms for the encapsulation and screening of mammalian cells and multicellular organisms. Chem. Biol. 2008, 15, 875. [CrossRef] Yan, X.; Wang, J.; Zhu, L.; Lowrey, J.J.; Zhang, Y.; Hou, W.; Dong, J.; Du, Y. A ready-to-use, versatile, multiplex-able three-dimensional scaffold-based immunoassay chip for high throughput hepatotoxicity evaluation. Lab Chip 2015, 15, 2634–2646. [CrossRef] [PubMed] Gong, X.Q.; Yi, X.; Xiao, K.; Li, S.; Kodzius, R.; Qin, J.H.; Wen, W.J. Wax-bonding 3D microfluidic chips. Lab Chip 2010, 10, 2622–2627. [CrossRef] [PubMed] Sun, Y.N.; Chen, X.D.; Zhou, X.G.; Zhu, J.B.; Yu, Y.D. Droplet-in-oil array for picoliter-scale analysis based on sequential inkjet printing. Lab Chip 2015, 15, 2429–2436. [CrossRef] [PubMed] Neugebauer, S.; Evans, S.R.; Aguilar, Z.P.; Mosbach, M.; Fritsch, I.; Schuhmann, W. Analysis in ultrasmall volumes: Microdispensing of picoliter droplets and analysis without protection from evaporation. Anal. Chem. 2004, 76, 458–463. [CrossRef] [PubMed] Cui, L.W.; Miao, J. Chromatin-mediated epigenetic regulation in the malaria parasite plasmodium falciparum. Eukaryot. Cell 2010, 9, 1138–1149. [CrossRef] [PubMed] LaCount, D.J.; Vignali, M.; Chettier, R.; Phansalkar, A.; Bell, R.; Hesselberth, J.R.; Schoenfeld, L.W.; Ota, I.; Sahasrabudhe, S.; Kurschner, C.; et al. A protein interaction network of the malaria parasite Plasmodium falciparum. Nature 2005, 438, 103–107. [CrossRef] [PubMed]
Sensors 2016, 16, 1616
33.
34.
35.
36.
37.
38.
39. 40. 41.
42.
43. 44. 45. 46. 47. 48.
12 of 12
Dekker, F.J.; van den Bosch, T.; Martin, N.I. Small molecule inhibitors of histone acetyltransferases and deacetylases are potential drugs for inflammatory diseases. Drug Discov. Today 2014, 19, 654–660. [CrossRef] [PubMed] Chimenti, F.; Bizzarri, B.; Maccioni, E.; Secci, D.; Bolasco, A.; Chimenti, P.; Fioravanti, R.; Granese, A.; Carradori, S.; Tosi, F.; et al. A novel histone acetyltransferase inhibitor modulating Gcn5 Network: Cyclopentylidene-[4-(40 -chlorophenyl)thiazol-2-yl)hydrazone. J. Med. Chem. 2009, 52, 530–536. [CrossRef] [PubMed] Cui, L.; Miao, J.; Furuya, T.; Fan, Q.; Li, X.; Rathod, P.K.; Su, X.Z.; Cui, L. Histone acetyltransferase inhibitor anacardic acid causes changes in global gene expression during in vitro Plasmodium falciparum development. Eukaryot. Cell 2008, 7, 1200–1210. [CrossRef] [PubMed] Miao, J.; Fan, Q.; Cui, L.; Li, X.L.; Wang, H.Y.; Ning, G.; Reese, J.C.; Cui, L.W. The MYST family histone acetyltransferase regulates gene expression and cell cycle in malaria parasite Plasmodium falciparum. Mol. Microbiol. 2010, 78, 883–902. [CrossRef] [PubMed] Fidock, D.A.; Wellems, T.E. Transformation with human dihydrofolate reductase renders malaria parasites insensitive to WR99210 but does not affect the intrinsic activity of proguanil. Proc. Natl. Acad. Sci. USA 1997, 94, 10931–10936. [CrossRef] [PubMed] Miao, J.; Li, J.F.; Fan, Q.; Li, X.L.; Li, X.Y.; Cui, L.W. The Puf-family RNA-binding protein PfPuf2 regulates sexual development and sex differentiation in the malaria parasite Plasmodium falciparum. J. Cell. Sci. 2010, 123, 1039–1049. [CrossRef] [PubMed] Trager, W.; Jensen, J.B. Human malaria parasites in continuous culture. Science 1976, 193, 673–675. [CrossRef] [PubMed] Zhang, J.H.; Chung, T.D.Y.; Oldenburg, K.R. A simple statistical parameter for use in evaluation and validation of high throughput screening assays. J. Biomol. Screen. 1999, 4, 67–73. [CrossRef] [PubMed] Secci, D.; Carradori, S.; Bizzarri, B.; Bolasco, A.; Ballario, P.; Patramani, Z.; Fragapane, P.; Vernarecci, S.; Canzonetta, C.; Filetici, P. Synthesis of a novel series of thiazole-based histone acetyltransferase inhibitors. Bioorgan. Med. Chem. 2014, 22, 1680–1689. [CrossRef] [PubMed] Shukla, A.; Singh, A.; Singh, A.; Pathak, L.P.; Shrivastava, N.; Tripathi, P.K.; Singh, M.P.; Singh, K. Inhibition of P. falciparum PFATP6 by curcumin and its derivatives: A bioinformatic study. Cell Mol. Biol. 2012, 58, 182–186. [PubMed] Kurogi, K.; Yan, H.; Tsujii, K. Importance of pinning effect of wetting in super water-repellent surfaces. Colloid Surface A 2008, 317, 592–597. [CrossRef] Gao, L.C.; McCarthy, T.J. Contact angle hysteresis explained. Langmuir 2006, 22, 6234–6237. [CrossRef] [PubMed] Oliver, J.F.; Huh, C.; Mason, S.G. Resistance to spreading of liquids by sharp edges. J. Colloid Interface Sci. 1977, 59, 568–581. [CrossRef] Fowkes, F.M.; Harkins, W.D. The state of monolayers adsorbed at the interface solid-aqueous solution. J. Am. Chem. Soc. 1940, 62, 3377–3386. [CrossRef] Rodriguez-Valverde, M.A.; Tirado Miranda, M. Derivation of Jurin’s law revisited. Eur. J. Phys. 2011, 32, 49–54. [CrossRef] You, L.Y.; Nie, J.Y.; Sun, W.J.; Zheng, Z.Q.; Yang, X.J. Lysine acetylation: Enzymes, bromodomains and links to different diseases. Essays Biochem. 2012, 52, 1–12. [CrossRef] [PubMed] © 2016 by the authors; licensee MDPI, Basel, Switzerland. This article is an open access article distributed under the terms and conditions of the Creative Commons Attribution (CC-BY) license (http://creativecommons.org/licenses/by/4.0/).