applied sciences Article
A Microfluidic Device for Hydrodynamic Trapping and Manipulation Platform of a Single Biological Cell Amelia Ahmad Khalili 1 , Mohd Ridzuan Ahmad 1, *, Masaru Takeuchi 2 , Masahiro Nakajima 2 , Yasuhisa Hasegawa 2 and Razauden Mohamed Zulkifli 3 1 2
3
*
Department of Control and Mechatronic Engineering, Faculty of Electrical Engineering, Universiti Teknologi Malaysia, Skudai, Johor 81310, Malaysia;
[email protected] Department of Micro-Nano Systems Engineering, Nagoya University, Furo-cho, Chikusa-ku, Nagoya 464-8603, Aichi, Japan;
[email protected] (M.T.);
[email protected] (M.N.);
[email protected] (Y.H.) Department of Bioscience and Health Sciences, Faculty of Biosciences and Medical Engineering, Universiti Teknologi Malaysia (UTM), Skudai, Johor 81310, Malaysia;
[email protected] Correspondence:
[email protected]; Tel.: +607-553-6333; Fax: +607-556-6272
Academic Editor: Fan-Gang Tseng Received: 17 November 2015; Accepted: 5 January 2016; Published: 1 February 2016
Abstract: To perform specific analysis for the single cell, individual cells have to be captured and separated from each other before further treatments and analysis can be carried out. This paper presents the design, simulation, fabrication, and testing of a microfluidic device for trapping a single cell/particle based on a hydrodynamic technique. A T-channel trapping chip has been proposed to provide single-cell trapping and consequently could be a platform for cell treatments and manipulations. A finite element T-channel trapping model was developed using Abaqus FEA™ software to observe it’s trapping ability by optimizing the channel’s geometry and RhMain /RhTrap ratio. A proof of concept demonstration for cell trapping in the T-channel model was presented in the simulation analysis and experimental work using HUVEC cell aggregate. The T-channel was found to be able to trap a single cell via the hydrodynamic trapping concept using an appropriate channel geometry and RhMain /RhTrap ratio. The proposed T-channel single-cell trapping has potential application for single cell characterization and single 3D cell aggregates treatments and analysis. Keywords: single cell; 3D cell aggregate; hydrodynamic trapping
1. Introduction The focus of cell studies at the single cell level has emerged and expanded to further explore and understand the properties and specific responses of individual cells towards environmental conditions and treatment. Most of the methods available for cell analysis involve experiments performed in an array of culture media and treatments. The responses of single cells to the culture treatments are measured as the average response of a single cell population. Therefore, the heterogeneity of individual cells could be neglected, thus hiding the important signals or responses representing important individual or single cell properties. An individual manipulation platform is needed to perform analysis on a specific single cell. Previous single-cell mechanical and electrical characterization studies have been carried out by probing the single cells using an Atomic Force Microscopy (AFM) probe [1–6], the micropipette aspiration technique [7–9], a red blood cell (RBC) biomembrane probe [6,10,11], optical tweezers [6,12–14], and a microfluidic channel [15–19] to characterize single cell stiffness, adhesion, and electrical properties. AFM probe, micropipette aspiration, and biomembrane probe techniques require a single cell to be isolated and manipulated manually by a skilled operator using the micromanipulator system. The advancement of microfluidic technology has made single cell capturing Appl. Sci. 2016, 6, 40; doi:10.3390/app6020040
www.mdpi.com/journal/applsci
Appl. Sci. 2016, 6, 40
2 of 17
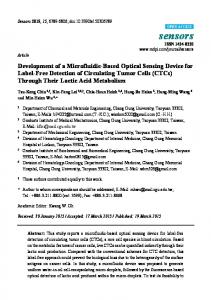
possible by controlling the fluid flow. Additionally, the channels could be utilized as the individual platform for cell manipulations in microscale. A variety of techniques have been employed to trap an individual cell within a microfluidic device. For example, microwell-based [20–24], dielectrophoresis-based [25–29], and hydrodynamic-based [30–42] microfluidic devices for single-cell trapping have been developed in response to an increasing demand for simple yet reliable tools for high-throughput cell manipulation at the single cell level. In microwell-based platforms, a precise geometry design is required to achieve high trapping efficiency [22]. Dielectrophoresis-based cell trapping applied a non-uniform AC field to manipulate polarized particles in suspension and is an effective technique to efficiently manipulate a single cell. However, this technique appears to damage the trapped cells, thus affecting the cell proliferation. Hydrodynamic trapping uses the altered fluidic resistance created by microstructures on a fluid path, such as sieve-like traps [41–43] or small trapping sites [30–35,44,45], to control the movement of cells in a microchannel. For straight or serpentine-shaped channels with trapping sites, the fluidic resistances of these channels are carefully calculated so that the fluid and cells in the main channel will be directed into the trapping sites when the channels are empty, but bypass them when they are occupied with a cell. The main challenge in hydrodynamic trapping is that it requires a precise microfluidic control of multiple streams and further investigation and optimization of cell trapping efficiencies are still required. Current microfluidic devices used for cell/3D cell culture face some drawbacks that limit their practical usage, such as the difficulty of accessing the trapped cells/3D cells in their trapping sites and the complexity of harvesting the cultured/treated cells for further analysis [46–48]. In this paper, we develop a T-channel single cell trap to capture a single cell and provide a platform for individual cell characterization. This T-channel provides a trapping site that allows for manipulation of a single cell using the trap channel’s outlet port via a syringe pump. Furthermore, the trapping site is not limited to the application of single cell study, but could be used for single 3D cell analysis for drug treatments, single spheroid tumor metastasis investigation, and protein study. A finite element T-channel trapping model was developed by designing and optimizing the channel’s geometry to produce an efficient single cell trapping system. The model is developed based on the hydrodynamic flow resistance (Rh) manipulation between the main channel and trap channel to achieve successful trapping. A proof of concept demonstration for cell trapping in the T-channel model is presented in the simulation analysis and experimental work using HUVEC cell aggregate. The developed finite element T-channel trapping model could be used for designing and optimizing the trapping of various types of cells of different sizes. Numerical simulations were carried out to evaluate the channel’s trapping efficiencies for different trap hole sizes and Rh of the main channel to Rh of the trap channel (RhMain /RhTrap ) ratios. Cell aggregate trapping has been performed experimentally to support the simulation findings. 2. Idea and Concept The available hydrodynamic trapping techniques inside a microfluidic chip have improved and enhanced research study involving cells, moving from the population batch experiment towards individual cell analysis. The trapping method has been widely used [30–35,44,45,49,50] as it enables high-throughput single cell trapping. However, currently available hydrodynamic trapping channels have limited capacity in providing a platform for individual cell manipulations for mechanical or electrical characterization. Realizing this need, researchers developed the idea to design T-channel single-cell trapping system with a microfluidic channel that could provide individual trapping site, thus enabling further single-cell characterization to be carried out. The T-channel trapping site is designed with two channels, a main and a trap channel. Figure 1 shows a schematic illustration of the hydrodynamic trapping concept with RhTrap and RhMain representing the flow resistance of the trap and the main channel, respectively. The RhTrap consists of the sum of three hydrodynamic resistances (RhT1 +RhT2 +RhT3 ). The yellow circle denotes a particle/cell to be trapped. For calculating the flow resistance of each channel, an analogous electrical circuit is considered, where the flow rate (Q) and
Appl. Sci. 2016, 6, 40
3 of 17
the Rh are analogs of electric current and resistance, respectively. The main channel and trap channel’s Appl. Sci. 2016, 6, 40 3 of 17 length are represented by LMain and LTrap , respectively. W Trap and W Hole are the trap channel’s and main channel and trap channel’s lengthrate are represented by LMain andinlet LTrap, respectively. WTrap andas Wan Hole electric trap hole’s width, respectively. The flow of whole fluid at the could be assumed are the trap channel’s and trap hole’s width, respectively. The flow rate of whole fluid at the inlet current source. The outlets could be assumed as grounds because they are at atmospheric pressure. could be assumed as an electric current source. The outlets could be assumed as grounds because This T-channel is a unique trapping site that allows single-cell manipulation to be performed using the they are at atmospheric pressure. This T-channel is a unique trapping site that allows single-cell Appl. Sci. 2016, 6, 40port via a syringe pump. 3 of 17 trap channel’s outlet manipulation to be performed using the trap channel’s outlet port via a syringe pump. main channel and trap channel’s length are represented by LMain and LTrap, respectively. WTrap and WHole are the trap channel’s and trap hole’s width, respectively. The flow rate of whole fluid at the inlet could be assumed as an electric current source. The outlets could be assumed as grounds because they are at atmospheric pressure. This T-channel is a unique trapping site that allows single-cell manipulation to be performed using the trap channel’s outlet port via a syringe pump.
Figure 1. Schematic illustration of single cell T-channel trapping model and the hydrodynamic resistance.
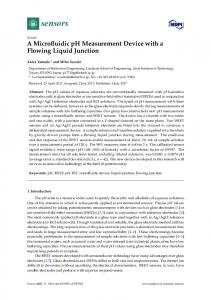
Figure 1. Schematic illustration of single cell T-channel trapping model and the hydrodynamic resistance. The hydrodynamic trapping concept can be summarized as follows: (a) the trapping channel has Rh than the main channel when a can trapping site is empty (Figure 2A); this(a) will make the cellschannel Thea lower hydrodynamic trapping concept be summarized as follows: the trapping flow into the trapping stream and directed into the trap; (b) when a cell is trapped, it will a has a lower Rh than the main channel when a trapping site is empty (Figure 2A); this act willasmake the plug and increase the Rh along the trap channel (Figure 2B) drastically; and (c) the main flow will cells flow Figure into the trapping streamofand directed into trapping the trap; (b) and when a cell is trapped, it will act as 1. Schematic illustration single cell T-channel model the hydrodynamic resistance. change from the trap channel to the bypass channel (main channel) and the next particles/cells will a plug and increase the Rh along the trap channel (Figure 2B) drastically; and (c) the main flow will be directed to the bypasstrapping stream, passing trappingassite [49]. (a) the trapping channel has The hydrodynamic concept by canthe be filled summarized follows: change fromThe theDarcy-Weisbach trap channel to the bypass channel (mainthe channel) and the next particles/cells equation is used to determine pressure drop orthis pressure difference in will be a lower Rh than the main channel when a trapping site is empty (Figure 2A); will make the cells directedaflow to the bypass stream, passing by the filled trapping site [49]. microchannel to solve the continuity and momentum equations for the Hagen-Poiseuille flow problem. into the trapping stream and directed into the trap; (b) when a cell is trapped, it will act as a the Hagen-Poiseuille equation, the flow rate(Figure (Q) can 2B) be defined by the following equation: TheFrom Darcy-Weisbach is used to determine the pressure drop pressure difference in plug and increase theequation Rh along the trap channel drastically; and (c)orthe main flow will a microchannel to solve the channel continuity and momentum equations for and the Hagen-Poiseuille flow change from the trap to the bypass channel (main channel) the next particles/cells will (1)problem. ∆ = × ℎ= × , beHagen-Poiseuille directed to the bypass stream, passing by rate the filled trapping site [49].by the following equation: From the equation, the flow (Q) can be defined where ∆PDarcy-Weisbach is the pressure drop, Rh isisthe flow resistance of rectangular C is a constant The equation used to determine thethe pressure drop channels, or pressure difference in ˙channel), ˆ 2 the that depends onto thesolve aspect (ratio between height and width offor the μ is the fluid’s a microchannel theratio continuity and momentum equations Hagen-Poiseuille flowviscosity, problem. CµLP ∆P “the Qand ˆ Rh “Q From Hagen-Poiseuille equation, flow rate (Q)ˆcan bearea defined the following equation: and L,the P, and A are the length, perimeter, cross-sectional channel, respectively. 3 of theby
A
∆ =
× ℎ=
×
(1)
(1)
,
where ∆P is the pressure drop, Rh is the flow resistance of the rectangular channels, C is a constant that ∆Paspect is the pressure drop,between Rh is the flow resistance of theof rectangular channels, is afluid’s constant dependswhere on the ratio (ratio height and width the channel), µ is Cthe viscosity, that depends on the aspect ratio (ratio between height and width of the channel), μ is the fluid’s viscosity, and L, P, and A are the length, perimeter, and cross-sectional area of the channel, respectively. and L, P, and A are the length, perimeter, and cross-sectional area of the channel, respectively.
Figure 2. Schematic illustration of the fluid’s hydrodynamic resistance in the microchannels for two different conditions; (A) empty trap channel (before cell trapping occurs); (B) after cells have been trapped.
From Equation (1), by estimating that the pressure drop across the trap and the main channel are the same (∆PTrap = ∆PMain), the flow rate ratio (QTrap/QMain) or flow resistance ratio (RhMain/RhTrap) Figure 2. Schematic illustration of the fluid’s hydrodynamic resistance in the microchannels for two between the trap channel and theofmain can be given as follows [50]: in the microchannels for Figure 2. Schematic illustration the channel fluid’s hydrodynamic resistance different conditions; (A) empty trap channel (before cell trapping occurs); (B) after cells have
been trapped. two different conditions; (A) empty trap channel (before cell trapping occurs); (B) after cells have = = . (2) been trapped.
From Equation (1), by estimating that the pressure drop across the trap and the main channel By using a relationship of A = W × H and P = 2 (W + H), where W and H are the width and height are the same (∆PTrap = ∆PMain), the flow rate ratio (QTrap/QMain) or flow resistance ratio (RhMain/RhTrap) of the channel, respectively, Equation (2) can be defined as: From Equation (1),channel by estimating thatchannel the pressure dropas across the trap and the main channel are between the trap and the main can be given follows [50]:
the same (∆PTrap = ∆PMain ), the flow rate ratio (QTrap /QMain ) or flow resistance ratio (RhMain /RhTrap ) = channel = (2) between the trap channel and the main can be given as follows. [50]: ˜ W and ¸2 H By using a relationship of A = W ˜ × H and P¸= ˜ 2 (W + H),¸where width and height ˆ are the ˙ ATrap 3 RhMain CMain LMainas: PMain Trap of the channel,Q respectively, Equation (2) can be defined QMain
“
RhTrap
“
CTrap
LTrap
PTrap
AMain
(2)
Appl. Sci. 2016, 6, 40
4 of 17
By using a relationship of A = W ˆ H and P = 2 (W + H), where W and H are the width and height of the channel, respectively, Equation (2) can be defined as: QTrap RhMain “ “ QMain RhTrap
˜
CMain CTrap
¸˜
LMain LTrap
¸˜
WMain ` HMain WTrap ` HTrap
¸2 ˆ
WTrap HTrap WMain HMain
˙3 (3)
From Equations (2) and (3), it is noted that the flow rates of the trap channel (QTrap ) and the main channel (QMain ) are distributed depending on the corresponding Rh. For the trap to work, the flow rate along the trap channel must be greater than the main channel (QTrap > QMain ). In other words, the flow resistance along the main channel must be greater than the trap channel (RhMain > RhTrap ). Therefore, a single cell can be trapped by manipulating the flow resistance ratio (RhMain /RhTrap ), which is determined by the geometric parameters of the channels. A single-cell trapping model is developed to produce a finite element single-cell trapping system in which the optimization of a channel’s geometry and adjustment of desired cell size could be performed. The geometry of the trapping channel is a variable for optimization (see Equation (3)) and subject to the size of cells and the application that will be carried out in the channel after the cells are trapped. An example of a channel’s geometry optimization was presented in this paper using a 5-µm yeast cell model. For other cell sizes, some guidelines in designing and optimizing the cell trapping channel are discussed. Firstly the diameter of the viable cells/particle in suspension should be determined to estimate the range of suitable W Hole sizes. The trap channel’s geometry size is dependent on the trapped cells’/particles’ applications. For example, if adherence cells are used and need to be cultured inside the trapping platform, the W Trap should be bigger than the diameter of the cell (viable cells in suspension before adhesion) because suspended cells will need space for cell adhesion, spreading and growing in time. In different applications, an individual ciliate protozoan, Tetrahymena thermophila [30], needs to be trapped and maintained in the trap channel for long-term monitoring of cell behavior. Therefore, no expansion in size is expected after the trapping process and the trap channel’s width does not require space for expansion. In summary, the geometry of channels is a variable (L, H, and W; see Equation (3)) for optimization, subject to the size, type and the application performed to the trapped cells. For the T-channel single particle/cell trapping system, particles/cells are introduced into the device through the inlet with an appropriate flow rate and directed to the trap channel by optimizing the channel’s geometry. Trap hole and trap channel geometry are optimized and the main channel’s length (LMain ) is manipulated to produce an appropriate Rh ratio that leads to successful trapping (see Equation (3)). The excess and remaining particles/cells will be directed out through the channel’s outlet by injecting the cell’s culture medium. 3. Methodology 3.1. Simulation Setup Finite element analysis is carried out using ABAQUS-FEA™ (Dassault Systems, RI, USA). The single-cell trapping simulation model consists of fluid channels (the Eulerian part) and a yeast cell, modeled as a 3D deformable elastic sphere (Figure 3A,B). The fluid part was represented by two microchannels the main channel and the trap channel, which were modeled as a 3D Eulerian explicit EC3DR and an eight-node linear Eulerian brick, assigned with water properties (density, equation of state, and viscosity). The yeast cell was modeled as a sphere-shaped elastic 3D standard solid deformable C3D8R and an eight-node linear brick 3D part with yeast cell properties (Young’s modulus, Poisson’s ratio, and density) obtained from the literature [51–57]. The appropriate channel’s geometry to trap a 5µm, single-particle yeast cell in the specified design was studied. The finite element single-cell trapping model is focused on a single trap channel for geometry optimization due to the complexity and high processing time required for the analysis.
Appl. Sci. 2016, 6, 40
5 of 17
The parts assembly is demonstrated in Figure 3C, showing the initial position of the yeast cell before simulation. The fluid channel and yeast cell model were assembled to develop the single cell trapping model. The initial position of the yeast cell in the channel was fixed (the distance between the cell and the trap channel) throughout all simulations. The interaction for cell and water was defined as general contact with rough tangential behavior. Both the fluid channel and the cell were meshed using hexahedron mesh type and total mesh elements for the cell trapping model ranged from 28,043 Appl. Sci. 2016, 6, 40 5 of 17 to 100,803 elements. Eulerian boundary conditions applied to the channel’s wall were defined as no-inflow non-reflecting outflow.boundary A constant fluid inflow of 1.0 wall µm¨ were s´1 was applied to 28,043 and to 100,803 elements. Eulerian conditions appliedvelocity to the channel’s defined as −1 the inlet and the channel outlets were defined as free outflow. no-inflow and non-reflecting outflow. A constant fluid inflow velocity of 1.0 μm·s was applied to the The simulation analysis could divided intooutflow. two parts: T-channel single particle/cell trapping inlet and the channel outlets were be defined as free The simulation could be divided two parts: T-channel single particle/cell trapping ability and the effects ofanalysis different RhMain /RhTrapinto ratio and W Hole . A T-channel model with a trap hole effects Main/RhTrap ratio and Hole. A T-channel model a trap widthability of 3.0and µmthe was usedoftodifferent analyzeRh trapping ability via W a simulation analysis. Towith study the hole effects of width 3.0ratio μm was used to on analyze trapping ability viaLa simulation analysis. To study the effects RhMain /Rhof and W cell trapping, various values ranging from 50 to 580 µm and Trap Main Hole of RhMain/RhTrap ratio and WHole on cell trapping, various LMain values ranging from 50 to 580 μm and W Hole values ranging from 1 to 5 were analyzed. The height of the main channel, trap channel, and WHole values ranging from 1 to 5 were analyzed. The height of the main channel, trap channel, and trap hole were uniform (HChannel ) at 7 µm throughout the analysis. trap hole were uniform (HChannel) at 7 μm throughout the analysis.
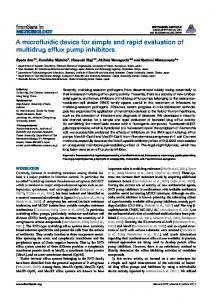
Figure 3. Development of a finite element model for a single-cell trapping system: (A) Eulerian part
Figure 3. Development a finite element model forchannel a single-cell trapping system: (fluid channel’s top of view) represented by main and trap channel (T1 +(A) T2Eulerian + T3); (B)part 3D(fluid channel’s top view) represented by main channel showing and trapthe channel (T1 + T2 T3); (B) simulation. 3D deformable deformable part (yeast cell model); parts assembly initial position of + cell before part (yeast cell model); (C) parts assembly showing the initial position of cell before simulation. 3.2. Microfluidic Chip Fabrication
3.2. Microfluidic Chip Fabrication Microchannel design was transferred to the glass chrome mask by direct lithography. A 2.5-inch AZ-coated glass chrome mask AZP1350 (ULCOAT, Saitama, Japan) and a positive photoresist were Microchannel design was transferred to the glass chrome mask by direct lithography. A 2.5-inch exposed with the channel design in a mask aligner with ultraviolet (UV) power of 12 mW (μPGUV-N, AZ-coated glass chrome mask AZP1350 (ULCOAT, Saitama, Japan) and a positive photoresist were Heidelberg Instruments, Heidelberg, Germany). The design-exposed masks were developed by exposed withthe the channel in a etchant mask aligner with (UV) of 12water mW(dH (µPGUV-N, dipping masks into design the chrome for 1 min andultraviolet rinsing them withpower deionized 2O) Heidelberg Instruments, Heidelberg, Germany). The design-exposed masks were developed to wash away the chrome etchant, followed by dipping into 70% ethanol for 1 min to remove the AZ by dipping the masks intomasks the chrome etchant for 1 in min and rinsing (dH2 O) layer. The chrome were further cleaned 70% ethanol forthem 2 minwith in andeionized ultrasonicwater cleaning to wash awaySix-inch-diameter the chrome etchant, followed by dipping into 70% for The 1 min to remove the AZ machine. silicon wafers were cleaned with dH2Oethanol and dried. wafers (SUMCO were used as the cleaned substratein for70% mold development. SU8-3005 spin coated layer.Corp., The Tokyo, chromeJapan) masks were further ethanol for 2 min in an was ultrasonic cleaning onto the wafers at 5000 rpm for 10 s to get a thickness 15 μm a reduced spin speed at machine. Six-inch-diameter silicon wafers were cleanedofwith dHfollowed 2 O and dried. The wafers (SUMCO 1000 rpm for 30 s. The SU8-coated silicon wafers were soft baked at 95 °C for 10 min. The was wafers were Corp., Tokyo, Japan) were used as the substrate for mold development. SU8-3005 spin coated then exposed to UV light (μPGUV-N, Heidelberg Instruments, Heidelberg, Germany)using a mask onto the wafers at 5000 rpm for 10 s to get a thickness of 15 µm followed a reduced spin speed at aligner for 8 s at 200 mJ/cm, post-baked at 95 °C for 6 min, developed using SU8 developer for 6 min, 1000 rpm for 30 s. The SU8-coated silicon wafers were soft baked at 95 ˝ C for 10 min. The wafers were dipped into fresh SU8 developer, and dried using an air blower. The developed microchannel pattern then was exposed UVaslight (µPGUV-N, Heidelberg Instruments, Germany) using a mask then to used a mold to develop the microfluidic devices.Heidelberg, The polymethylsiloxane (PDMS) ˝ C for 6 min, developed using SU8 developer for 6 min, aligner for 8 s at 200 mJ/cm, post-baked at 95 (Dow corning, Midland MI, USA) microfluidic devices are fabricated by replica molding using the dipped into fresh SU8wafer. developer, dried using blower. developed pattern patterned silicon PDMSand prepolymer andan a air curing agentThe were mixed inmicrochannel the ratio of 9:1, degassed, on the mold inside 10 cm petri and cured in a convection was then usedpoured as a mold topatterned-channel develop the microfluidic devices. The dishes, polymethylsiloxane (PDMS) (Dow ovenMidland, at 65 °C for to complete the cross-linking. cured PDMS was peeled from the mold and corning, MI,2 h USA) microfluidic devices areThe fabricated by replica molding using the patterned cut into individual devices. The holes for inlets and outlets were punched with a hollow needle 1 mm silicon wafer. PDMS prepolymer and a curing agent were mixed in the ratio of 9:1, degassed, poured in patterned-channel diameter. Plasma oxidation (20 mA, min) wasdishes, used toand activate of PDMS andatglass on the mold inside 10 3cm petri curedthe insurfaces a convection oven 65 ˝ C for slides, followed by heating on a hot plate at 95 °C for 1 h to seal the PDMS and glass. Figure 4 shows a summary of the microchip fabrication steps.
Appl. Sci. 2016, 6, 40
6 of 17
2 h to complete the cross-linking. The cured PDMS was peeled from the mold and cut into individual devices. The holes for inlets and outlets were punched with a hollow needle 1 mm in diameter. Plasma oxidation (20 mA, 3 min) was used to activate the surfaces of PDMS and glass slides, followed by heating on a hot plate at 95 ˝ C for 1 h to seal the PDMS and glass. Figure 4 shows a summary of the microchip steps. Appl. Sci.fabrication 2016, 6, 40 6 of 17
(A)
(B)
(C)
(D)
Figure 4. Fabrication steps for the development of (A) microchannel mask; (B) mold or microchannel
Figure 4. Fabrication for(D) themicrochip development of (A) microchannel mask; (B) mold or microchannel pattern; (C) PDMS steps channel; assembly. pattern; (C) PDMS channel; (D) microchip assembly. 3.3. Cell Culture and Cell Aggregates Formation
3.3. Cell Culture and(frozen Cell Aggregates Formation HUVECs stock) were commercially obtained from Clonetics (Cambrex, Inc., Walkersville, MD, USA). defrosted, obtained thawed, and grown in endothelial growth HUVECs (frozen stock)Cells werewere commercially from Clonetics (Cambrex, Inc.,medium Walkersville, (EGM-2 BulletKit, Lonza, Basel, Switzerland) supplemented with 2% fetal bovine serum, antibiotics MD, USA). Cells were defrosted, thawed, and grown in endothelial growth medium (EGM-2 (gentamicin sulfate/amphotericin B), 0.4% human fibroblast growth factor-B, 0.04% hydrocortisone, BulletKit, Lonza, Basel, Switzerland) supplemented with 2% fetal bovine serum, antibiotics (gentamicin 0.1% human epidermal growth factor, ascorbic acid, heparin, vascular endothelial growth factor, and sulfate/amphotericin B), 0.4% human fibroblast growth factor-B, 0.04% hydrocortisone, 0.1% human insulin-like growth factor (R3-IGF-1). Cultures were maintained at 37 °C in a humidified atmosphere epidermal growth factor, ascorbic acid, heparin, vascular endothelial growth factor, andcultures insulin-like with 5% CO2. Media were changed at 24 h after thawing and every 48 h onwards. When the ˝ C in a humidified atmosphere with 5% growth factor (R3-IGF-1). Cultures were maintained at 37 reached 80%–90% confluence, cells were subcultured and washed with phosphate-buffered saline CO2 .(PBS) Media were changed at124 h after thawing and every 48were h onwards. the cultures reached and detached using mL of trypsin-EDTA. Once cells detached,When the trypsin effect was neutralized with 2 mL of were EGM-2subcultured medium andand cellswashed were centrifuged at 220× g for 5 min atsaline 25 °C. (PBS) Cells and 80%–90% confluence, cells with phosphate-buffered 2 in culture flasks or plates. For cell aggregates were using seeded1atmL a minimum density ofOnce 103 cells/cm detached of trypsin-EDTA. cells were detached, the trypsin effect was neutralized 6 formation, 1 × 10 HUVEC cells in passage 10 were harvested by centrifugation re-suspended ˝ C. Cells were with 2 mL of EGM-2 medium and cells were centrifuged at 220ˆ g for 5 minand at 25 with 1 mL EGM-2 medium in 15-mL prolypropylene centrifuge tubes. Cells were incubated for 1 h 3 2 seeded at a minimum density of 10 cells/cm in culture flasks or plates. For cell aggregates formation, and the tubes’ caps were loosened to allow oxygen supply to the cells during culture/incubation. Cell 1 ˆ 106 HUVEC cells in passage 10 were harvested by centrifugation and re-suspended with 1 mL aggregates with diameter in the range of 30–60 μm formed spontaneously during incubation.
EGM-2 medium in 15-mL prolypropylene centrifuge tubes. Cells were incubated for 1 h and the tubes’ caps 3.4. were loosenedSetup to allow oxygen supply to the cells during culture/incubation. Cell aggregates Experimental with diameter in the range of 30–60 µm formed spontaneously during incubation. The microfluidic chip consists of two inlets (medium and cell aggregates suspension) and two outlets (from the trap channel and the main channel) with the T-channel trapping site positioned in the middle of the microchip (Figure 5B). The inlets were connected to 1 mm diameter polyethylene tubing as inlets and outlet ports, for fluid and cell aggregates injection and withdrawal (Figure 5A,D).
Appl. Sci. 2016, 6, 40
7 of 17
3.4. Experimental Setup The microfluidic chip consists of two inlets (medium and cell aggregates suspension) and two outlets (from the trap channel and the main channel) with the T-channel trapping site positioned in the middle of the microchip (Figure 5B). The inlets were connected to 1 mm diameter polyethylene tubing as Sci. inlets 5A,D). Appl. 2016,and 6, 40 outlet ports, for fluid and cell aggregates injection and withdrawal (Figure 7 of 17 The length of polyethylene tubing for both outlets should be the same to ensure the appropriate The length of both polyethylene tubing should be tubing the same ensure the appropriate RhMain /Rh the main andfor theboth trapoutlets channel. The fortothe outlets was connected Trap of Rh Main /Rh Trap of both the main and the trap channel. The tubing for the outlets was connected the to to the waste reservoir (Figure 5A,C). A microfluidic chip was connected through thetoinlets (Figure 5A,C). A microfluidic chip wasMA, connected the with inlets 3-mL to legato 180 legatowaste 180 reservoir syringe pumps (KD Scientific™, Holliston, USA)through equipped disposable syringe pumps (KD Scientific™, Holliston, MA, USA) equipped with 3-mL disposable syringes syringes (Terumo Medical Corp., Tokyo, Japan). The chip was perfused with EGM-2 medium (Lonza, (Terumo Medical Corp., Tokyo, Japan). The chip was perfused with EGM-2 medium (Lonza, Walkersville, MD, USA) through inlet 1 at a flow rate 50 µL/min to remove air bubbles and the flow Walkersville, MD, USA) through inlet 1 at a flow rate 50 μL/min to remove air bubbles and the flow was reduced to 10 analyses.Cell Cell aggregates suspensions were diluted was reduced to µL/min 10 μL/minfor forsubsequent subsequent analyses. aggregates suspensions were diluted to 10 to 10 cells per µm medium before being injected into the microfluidic chip at the flow rate of 50 µL/min. cells per μm medium before being injected into the microfluidic chip at the flow rate of 50 μL/min. The cell aggregates were monitored in real time, using inverted microscope IX71 (Olympus, Tokyo The cell aggregates were monitored in real time, using inverted microscope IX71 (Olympus, Tokyo Japan) withwith 40ˆ40× magnification. Japan) magnification.
Figure 5. (A) Schematic diagram setup;(B) (B)a aclose-up close-up image of the trapping Figure 5. (A) Schematic diagramofofthe theexperimental experimental setup; image of the trapping channel; (C) experimental a close-up real image the T channel microfluidic chip channel; (C) experimental setup;setup; (D) a(D) close-up real image of the of T channel microfluidic chip positioned under the inverted microscope. underpositioned the inverted microscope.
4. Results and Discussions
4. Results and Discussions
4.1. T-Channel Trapping Ability
4.1. T-Channel Trapping Ability
The finite element model for the T-channel trapping was developed to evaluate the channel’s
The finite element for the T-channel trapping was developed evaluate ability to trap single model cells depending on the desired cell size. The model wasto designed to the havechannel’s two ability to trap single cells depending on the desired cell size. The model was designed outlets that lead to the waste reservoir and to be operated by fluid infusion through the inlets. In to thehave two outlets thatanalyses, lead to the reservoir andmodel to bewas operated by fluid infusion theAinlets. simulation the waste T-channel trapping developed to trap a 5-μmthrough yeast cell. trapping model a trap trapping hole width (WHolewas ) of developed 3.0 μm wasto used the cell. In theT-channel simulation analyses, thewith T-channel model traptoa observe 5-µm yeast appropriate flow resistance ratio of the main channel to the trap channel (RhMain/RhTrap) for single particle/cell trapping. The main channel’s length (LMain) was manipulated to create an RhMain/RhTrap ratio ranging from 0.5 to 5. Increasing the RhMain/RhTrap ratio is proportional with the increase in the main channel’s (main path) length. Figure 6 represents the result of cell trapping for a model with an
Appl. Sci. 2016, 6, 40
8 of 17
A T-channel trapping model with a trap hole width (W Hole ) of 3.0 µm was used to observe the appropriate flow resistance ratio of the main channel to the trap channel (RhMain /RhTrap ) for single particle/cell trapping. The main channel’s length (LMain ) was manipulated to create an RhMain /RhTrap ratio ranging from 0.5 to 5. Increasing the RhMain /RhTrap ratio is proportional with the increase in the main channel’s (main path) length. Figure 6 represents the result of cell trapping for a model with an RhMain /RhTrap ratio ranging from 1 to 6 at the 25 s point of the simulation time. A yeast cell model was trapped when a RhMain /RhTrap ratio of 2 or higher was used with various cell positions in the trap channel during a simulation time of 25 s (Figure 6B–E). A higher RhMain /RhTrap ratio produced faster Appl. Sci.Models 2016, 6, 40 with an Rh of 17 cell trapping. the Main /RhTrap ratio of 1 or less were not able to trap the cell,8 causing cell to bypass the trap channel to enter the main channel (Figure 6A). RhMain/RhTrap ratio ranging from 1 to 6 at the 25 s point of the simulation time. A yeast cell model was The simulation show that an Rh higher /Rh ratio of 2various or above is able tointrap single cells Trap trapped when aresults RhMain/Rh Trap ratio of 2 or Main was used with cell positions the trap using the hydrodynamic trapping concept. The fluid’s velocity inside the main channel and trap channel during a simulation time of 25 s (Figure 6B–E). A higher RhMain/RhTrap ratio produced faster trapping. with an Rh /RhTrap ratio of 1 or less were not able to the cell, causing channelcell were furtherModels investigated to Main analyze the fluid’s velocity profile in trap the channels beforethe and after cell to bypass the trap channel to enter the main channel (Figure 6A). cell trapping occurred. A T-channel model with a W Hole 3 and RhMain /RhTrap ratio of 3 was chosen for simulation results show that an RhMain/RhTrap ratio of 2 or above is able to trap single cells the analysis.The Figure 7A represents the fluid’s velocity position in the trap and main channel and the using the hydrodynamic trapping concept. The fluid’s velocity inside the main channel and trap graph in Figure 7B presents the fluid’s velocity measurement in the trap and main channel before and channel were further investigated to analyze the fluid’s velocity profile in the channels before and after trapping. Before cell trapping occurred, thewith fluid’s velocity the trap was higher than in after cell trapping occurred. A T-channel model a WHole 3 and Rhinside Main/RhTrap ratio of 3 was chosen the main channel; conversely, after the cell was trapped, the fluid’s velocity the trap for the analysis. Figure 7A represents the fluid’s velocity position in the trap and inside main channel andchannel the graph in Figure 7B presents the fluid’s velocity measurement in the trap and main channel before decreased dramatically while the fluid’s velocity in the main channel increased instantly. When the after trapping. Before cell trapping occurred, themain, fluid’sitvelocity inside the trap was higher than velocityand of fluid in the trap channel is higher than the leads to a lower hydrodynamic resistance in the main channel; conversely, after the cell was trapped, the fluid’s velocity inside the trap channel in the trapping site, which creates a trapping stream directing the cell into the trap channel. further decreased dramatically while the fluid’s velocity in the main channel increased instantly. When the blocks the trap of hole and decreases the than fluid’s trap channel. This finding velocity fluid in drastically the trap channel is higher thevelocity main, it inside leads tothe a lower hydrodynamic supports the principle of hydrodynamic trapping in which, when the trapping site is empty, resistance in the trapping site, which creates a trapping stream directing the cell into the trap channel.the trap channelfurther will have flow compared main channel. direction fluid flow blockslower the trap holeresistance and drastically decreasesto thethe fluid’s velocity insideThe the trap channel.ofThis finding principle hydrodynamic in which, when the trapping site is empty, diverges fromsupports the trapthe channel toofthe main path trapping (main channel); therefore, subsequent cells will be will have lower flow resistance compared to channel. The direction of fluid directedthe totrap the channel main path. These findings were supported bythe themain simulation outcome using three cells flow diverges from the trap channel to the main path (main channel); therefore, subsequent cells will and a T-channel model with an RhMain /RhTrap ratio of 3 and a W Hole width of 3 µm. The analyses were be directed to the main path. These findings were supported by the simulation outcome using three carried cells out to investigate movement ofMain subsequent cells after occurred. Results obtained and a T-channelthe model with an Rh /RhTrap ratio of 3 and a Wtrapping Hole width of 3 μm. The analyses show that first out celltomoved intothe themovement trap channel (Figure cells 8B) and cells Results bypassed the werethe carried investigate of subsequent after subsequent trapping occurred. obtained show 8C). that the cell moved into theplots trap channel (Figure cellsdirected trap channel (Figure Thefirst velocity streamlines illustrate how 8B) the and fluidsubsequent stream was bypassed the trap channel 8C). The velocity plots illustrate how the streamchannel to the trap channel during cell(Figure trapping (Figure 8B)streamlines but the direction changed to fluid the main to the trap channel during cell trapping (Figure 8B) but the direction changed to the after thewas celldirected trapping (Figure 2C). Subsequent analysis showed the effects of RhMain /RhTrap in the main channel after the cell trapping (Figure 2C). Subsequent analysis showed the effects of T-channel trapping. RhMain/RhTrap in the T-channel trapping.
Figure 6. Model’s trapping ability at different RhMain/RhTrap ratios ranging from (A) 1; (B) 2; (C) 3; (D)
Figure 6. Model’s trapping ability at different RhMain /RhTrap ratios ranging from (A) 1; (B) 2; (C) 3; 4; (E) 5; (F) 6. (D) 4; (E) 5; (F) 6.
Appl. Sci. 2016, 6, 40
9 of 17
Appl. Sci. 2016, 6, 40
9 of 17
Appl. Sci. 2016, 6, 40
9 of 17
Figure 7. (A) Points representing velocity of fluid in the trap channel (left side) and main channel
Figure 7. (A) Points representing velocity of fluid in the trap channel (left side) and main channel (right side); (B) graph representing velocity of fluid in trap channel and main channel for T-channel Figure 7. (A) Points representingvelocity velocity of fluid trap channel (left side)channel and main (righttrapping side); (B) graph representing fluid in in the trap channel and main forchannel T-channel model with RhMain/RhTrap ratio of 3.0 before and after cell trapping. (right side);with (B) graph representing velocity fluid inand trapafter channel main channel for T-channel trapping model RhMain /RhTrap ratio of 3.0ofbefore cell and trapping. trapping model with RhMain/RhTrap ratio of 3.0 before and after cell trapping.
Figure 8. Simulation findings of fluid’s velocity streamline plots for model with WHole of 3 μm and RhMain/RhTrap ratio of 3 during: (A) the initial position of cells; (B) cell trapping; and (C) after cell trapping. Figure 8. Simulation findings of fluid’s velocity streamline plots for model with WHole of 3 μm and Figure 8. Simulation findings of fluid’s velocity streamline plots for model with W Hole of 3 µm RhMain/RhTrap ratio of 3 during: (A) the initial position of cells; (B) cell trapping; and (C) after cell trapping.
4.2. Rh Effects of Different RhMain/RhTrap Ratio and WHole and Main /RhTrap ratio of 3 during: (A) the initial position of cells; (B) cell trapping; and (C) after cell Further simulation analyses carried 4.2.trapping. Effects of Different RhMain /RhTrap were Ratio and WHoleout to examine the effects of different RhMain/RhTrap ratios ranging from 0.5 to 5.0 on the T-channel trapping with a WHole of 3 μm. LMain was manipulated Further simulation analyses were carried out to examine the effects of different RhMain/RhTrap to comply with the desired RhMain /RhTrap The hydrodynamic trapping concept was found to 4.2. Effects Different Rh0.5 Ratio andratio. WHole Main ratiosof ranging from to/Rh 5.0Trap on the T-channel trapping with a WHole of 3 μm. LMain was manipulated work accordingly for a T-channel with an RhMain/RhTrap ratio of 2.0 and above as the yeast cell model to comply with the desired Rhwere Main/RhTrap ratio. The hydrodynamic trapping concept was found to Further simulation to examine theineffects ofchannel different RhMain /RhTrap was directed into the analyses trap channel by carried the fluid out stream and trapped the trap (Figures 9,10). work accordingly for a T-channel with an Rh Main/RhTrap ratio of 2.0 and above as the yeast cell model ratiosThe ranging from 0.5profile to 5.0 and on the T-channel trapping with a W Hole of 3were µm.analyzed LMain was manipulated to fluid velocity streamline field of the cell trapping model to understand was directed into the trap channel by the fluid stream and trapped in the trap channel (Figures 9,10). comply the desired RhMainmechanism. /RhTrap ratio. The hydrodynamic concept was found thewith hydrodynamic trapping Fluid velocity streamlinestrapping presented the direction where to thework The fluid velocity profile and streamline field of the cell trapping model were analyzed to understand accordingly for a T-channel with an RhMainFluid /RhTrap ratio of 2.0 and above as the yeast cell model was the hydrodynamic trapping mechanism. velocity streamlines presented the direction where the
directed into the trap channel by the fluid stream and trapped in the trap channel (Figures 9 and 10). The fluid velocity profile and streamline field of the cell trapping model were analyzed to understand
Appl. Sci. 2016, 6, 40
10 of 17
the hydrodynamic trapping mechanism. Fluid velocity streamlines presented the direction where the fluid stream was heading, while velocity profiles represented the velocity value in the channel by the contour color. The velocity streamlines produced by the cell trapping model with an RhMain /RhTrap ratio of 1.0 and less were found to deviate from most of the streamlines headed to the main channel instead of the trap channel (Figure 9A). Therefore, the stream was unable to lead the cell into the trap Sci. 2016, 6, 40 17 channel.Appl. This finding is in agreement with the fluid’s velocity distribution produced 10 byof the same model (Figure 10A). Results show that the main channel’s fluid velocity for the single-cell trapping fluid stream was heading, while velocity profiles represented the velocity value in the channel by the model with an color. RhMain /Rh of 1.0 was higher compared to the trapwith channel’s contour The velocity streamlines produced by the cell trapping model an RhMainfluid /RhTrapvelocity. Trap ratio ratio 1.0 and less were deviate of the streamlines to thepath mainand channel Therefore theoffluid stream willfound directtothe yeastfrom cellmost to flow into the mainheaded channel’s bypass the instead of the trap channel (Figure 9A). Therefore, the stream was unable to lead the cell into the trap trap channel. finding is in agreement with the fluid’s velocity distribution produced by the same In channel. contrastThis with the cell trapping model with an RhMain /RhTrap ratio of 2.0 and above model (Figure 10A). Results show that the main channel’s fluid velocity for the single-cell trapping (Figure 9B–D), the streamline profiles show the fluid flow diverging from the main channel into the trap model with an RhMain/RhTrap ratio of 1.0 was higher compared to the trap channel’s fluid velocity. channel;Therefore most streamlines were directed towards thetotrap For models Main /RhTrap the fluid stream will direct the yeast cell flowchannel. into the main channel’swith path an andRh bypass ratio of the 2.0trap (Figure 10B–D), the fluid’s velocity in the trap hole was higher compared to the fluid’s channel. In main contrast with the cell results trapping model an Rh Main/RhTrap ratio of lower 2.0 and above velocity in the channel. These show thatwith the trap channel produces hydrodynamic (Figure 9B–D), the streamline profiles show the fluid flow diverging from the main channel into thechannel. resistance than the main channel and the mainstream will direct the yeast cell into the trap trap channel; most streamlines were directed towards the trap channel. For models with an Models with an RhMain /RhTrap ratio of 2.0–4.0 (Figure 10B–D) had similar fluid velocity patterns to RhMain/RhTrap ratio of 2.0 (Figure 10B–D), the fluid’s velocity in the trap hole was higher compared to providethe an fluid’s appropriate drop for cell trapping. However, are variations velocity pressure in the main channel. These results show that thethere trap channel produces found lower in cell trappinghydrodynamic time between different Rhthe /Rhchannel A mainstream higher RhMain a shorter resistance than main and the will /Rh direct theratio yeast requires cell into the Main Trap ratios. Trap Models withcompared an RhMain/Rhto Trap a ratio of 2.0–4.0 10B–D)inhad similar velocity time fortrap thechannel. trapping process lower ratio. (Figure The graph Figure 11fluid shows the results patterns to for provide appropriate pressure drop for cellof trapping. there are variations of trapping time cell an trapping models with aW 3.0 andHowever, an‘RhMain /Rh Trap ratio ranging Hole found in cell trapping time between different RhMain/RhTrap ratios. A higher RhMain/RhTrap ratio requires from 1.0 to 6.0. The graph shows that the trapping time decreases with increasing RhMain /RhTrap . a shorter time for the trapping process compared to a lower ratio. The graph in Figure 11 shows the This was probably due to a higher RhMain /RhTrap ratio that enables velocity distribution in a shorter results of trapping time for cell trapping models with a WHole of 3.0 and an RhMain/RhTrap ratio ranging time compared the /Rhthe . A greater RhMain with /RhTrap ratio Rh could produce lower Mainthat Trap from 1.0 toto 6.0. Thelower graph Rh shows trapping time decreases increasing Main/RhTrap. This hydrodynamic resistance the trap and fluid atinaa faster was probably due to ainhigher RhMainchannel /RhTrap ratio thatcould enablestransfer velocity the distribution shorter rate time [58,59]. compared to the lowerproduced RhMain/RhTrapdifferent . A greater pressure RhMain/RhTrap ratio could produce lower hydrodynamic The velocity distribution inside the main channel and trap channel, in stream the trap to channel and could transfer fluid at a faster rate the [58,59]. causingresistance the fluid’s be directed to the trap the channel and bringing cellThe intovelocity a lower flow distribution produced different pressure inside the main channel and trap channel, causing the fluid’s resistance area for trapping. stream to be directed to the trap channel and bringing the cell into a lower flow resistance area for trapping.
Figure 9. Velocity streamlines before cell trapping (top view) for cell trapping model with a WHole of
Figure 9.3 μm Velocity streamlines before cell trapping (top view) for cell trapping model with a W of Trap ratios of (A) 1.0; (B) 2.0; (C) 3.0; and (D) 4.0. V represents the fluid’s Hole for different RhMain/Rh −1 3 µm forvelocity different RhMain . /RhTrap ratios of (A) 1.0; (B) 2.0; (C) 3.0; and (D) 4.0. V represents the fluid’s in μm·s velocity in µm¨ s´1 .
Appl. Sci. 2016, 6, 40
11 of 17
Appl. Sci. 2016, 6, 40
11 of 17
Appl. Sci. 2016, 6, 40
11 of 17
Figure 10. Velocity of fluid before cell trapping for single-cell trapping model with a WHole width of
Figure 10. Velocity of fluid before cell trapping for single-cell trapping model with a W Hole width of Main/RhTrap ratios of of (A) 1.0; (B) 2.0; (C) 3.0; and (D) 4.0. V represents the fluid’s velocity 3Figure μm for10. RhVelocity of fluid before cell trapping for single-cell trapping model with a WHole width of 3 µm in forμm·s RhMain /RhTrap ratios of of (A) 1.0; (B) 2.0; (C) 3.0; and (D) 4.0. V represents the fluid’s velocity −1. 3 μm for RhMain/RhTrap ratios of of (A) 1.0; (B) 2.0; (C) 3.0; and (D) 4.0. V represents the fluid’s velocity ´1 in µm¨ s . −1 in μm·s .
Figure 11. Cell trapping time for model with different RhMain/RhTrap ranging from 1.0 to 6.0 for of 3 μm. T-channel model time with afor WHole Figure 11.trapping Cell trapping model with different RhMain/RhTrap ranging from 1.0 to 6.0 for Figure 11. Cell trapping time for model with different RhMain /RhTrap ranging from 1.0 to 6.0 for T-channel trapping model with a WHole of 3 μm.
T-channel trapping model were with aundertaken W Hole of 3 µm. Simulation analyses to observe the effects of WHole in the T-channel model’s values the ranging to 5.0 was examined with trapping ability. A T-channel model with W Simulation analyses were undertaken toHoleobserve effectsfrom of W1.0 Hole in the T-channel model’s different Rh Main/RhTrap ratios between 2.0 and 6.0. For T-channel trapping models with a WHole width of valuesthe ranging from 1.0Hole to 5.0 examined with trapping ability. A T-channel model with to WHole Simulation analyses were undertaken observe effects of W in was the T-channel model’s 2.0 μm orRh less, theTrap cellratios was between unable to2.0 beand trapped and bypassed the trap channel to aenter the main different Main 6.0. For T-channel trapping models with W Hole width ofwith trapping ability. A/Rh T-channel model with W values ranging from 1.0 to 5.0 was examined Hole channel. The velocity streamlines produced show that the fluid stream waschannel not fullytofocused into the 2.0 μm or less, the cell was unable to be trapped and bypassed the trap enter the main different RhMain /RhTrap ratios between 2.0 and 6.0. For T-channel trapping models with a W Hole trap channel (Figure 12A). Additionally, theshow fluid’s velocity instream the present main channel was high channel. Theor velocity streamlines produced that the and fluid wasthe not fully focused into the the width(Figure of 2.0 13A) µm less, the cell was unable to beHole trapped bypassed trap channel to fluid enter compared to the models with a W of 2μm and above (Figure 13B–D). The high trap channel (Figure 12A). Additionally, the fluid’s velocity in the present main channel was high mainstream channel.the The velocity streamlines produced show the fluid stream was not fullyfrom focused main channel directed cells to bypass trapthat channel and prevented cell The trapping (Figurein13A) compared to the models with a WHole the of 2μm and above (Figure 13B–D). high fluid into the trap channel (Figure 12A). the fluid’s velocity insuitable the present channel occurring (Figure Thisdirected result Additionally, shows a WHole 2 μm or less is not fortrapping themain specified stream in the main13A). channel cells tothat bypass the of trap channel and prevented cell from was high (Figure 13A) compared to the models with a W of 2µm and above (Figure 13B–D). trap channel dimension (7 μm width, height, and length). The small W Hole probably caused a very Hole occurring (Figure 13A). This result shows that a WHole of 2 μm or less is not suitable for the specified low fluid velocity distribution and produced a pressure drop that prevented cells’ movement into The high stream in the (7 main directed to bypass the W trap prevented trap fluid channel dimension μm channel width, height, andcells length). The small Hole channel probablyand caused a very cell the channel [28]. The hydrodynamic trapping concept is found be ineffective formovement a cell trapping from occurring (Figure 13A). This result shows drop that athat WtoHole of 2 µm or less istrapping not into suitable lowtrap fluid velocity distribution and produced a pressure prevented cells’ model atrap WHole ofThe 2.0 μm or less. A (7 simulation study performed by et al. [59] showed the the trapwith channel [28]. hydrodynamic trapping concept is found be Khalili ineffective for a cell trapping for the specified channel dimension µm width, height, andtolength). The small W probably Hole same very Hole/WTrap value was used. However, for a T-channel model with a modeltrend with when a WHolea of 2.0 small μm orWless. A simulation study performed by Khalili et al. [59] showed the
caused a very low fluid velocity distribution and produced a pressure drop that prevented cells’ same trend when a very small[28]. WHoleThe /WTrap value was used.trapping However, for a T-channel with a movement into the trap channel hydrodynamic concept is foundmodel to be ineffective for a cell trapping model with a W Hole of 2.0 µm or less. A simulation study performed by Khalili et al. [59] showed the same trend when a very small W Hole /W Trap value was used. However, for
Appl. Sci. 2016, 6, 40 Appl. Sci. 2016, 6, 40
12 of 17 12 of 17
a T-channel model with a W Hole of 3 µm or higher, the yeast cell model was directed into the trap Appl. Sci. 2016, 6, 40 12 of 17 channel 12 and the 13).yeast The cell streamlines produced focused in the direction ofand the 13). trap WHole of (Figures 3 μm or higher, model was directed were into the trap channel (Figures 12 channel the fluid’s velocity was found to be higher in the trap compared the The produced focused in the direction ofinto the trap channel (Figure 12B–D) andto13). the W Holestreamlines of(Figure 3 μm or12B–D) higher,and thewere yeast cell model was directed the trap channel (Figures 12 and main channel (Figure 13B–D). A bigger W value was found to produce higher fluid velocity inside fluid’s velocity was found to be higher compared totrap the main channel (Figure 13B–D). A The streamlines produced were focusedinHole inthe thetrap direction of the channel (Figure 12B–D) and the the trapW channel (Figure 13B–D) and required shorter trapping timemain compared to(Figure the(Figure smaller W Hole bigger Hole value was found to produce fluid velocity inside the trap channel 13B–D) fluid’s velocity was found to be higher inhigher the trap compared to the channel 13B–D). A (data Table summarizes simulation for aW single-cell trapping model’s ability and not required shorter trapping timethe compared to findings the smaller Hole (datachannel not shown). Table 1 bigger Wshown). Hole value was 1found to produce higher fluid velocity inside the trap (Figure 13B–D) atand different values of W and various Rh /Rh ratios. The T-channel trapping model was able Trapthe Hole summarizes simulation findings aMain single-cell trapping model’s at different requiredthe shorter trapping timefor compared to smaller WHole ability (data not shown).values Table of 1 tosummarizes cellthe trapping W of 3 µm and higher were usedability with /Rh Maincell Trap ratio Wperform Hole and various RhMainwhen /RhTrap ratios. The trapping model was able to an perform trapping simulation findings for aT-channel single-cell trapping model’s at Rh different values of Hole values ofW 2Hole and when Wabove. Hole valuesRh ofMain 3 μm andratios. higher were used with an RhMain /RhTrap ratio and above. and various /RhTrap The T-channel trapping model was ableofto2perform cell trapping when WHole values of 3 μm and higher were used with an RhMain/RhTrap ratio of 2 and above.
Figure 12. Velocity streamlines before cell trapping (top view) for a cell trapping model with Figure 12. Velocity streamlines before cell trapping (top view) for a cell trapping model with TrapVelocity ratios of streamlines 3 for different WHole of 2 μm; (B)(top 3 μm; (C) 4for μm; 5 μm. V represents RhMain/Rh Figure 12. before cell(A) trapping view) a and cell (D) trapping model with RhMain /RhTrap ratios of 3 for−1different W Hole of (A) 2 µm; (B) 3 µm; (C) 4 µm; and (D) 5 µm. V represents theMain fluid’s velocity in 3μm·s . /RhTrap ratios of for different W Hole of (A) 2 μm; (B) 3 μm; (C) 4 μm; and (D) 5 μm. V represents Rh the fluid’s velocity in µm¨ s´1 . the fluid’s velocity in μm·s−1.
Figure 13. Velocity of fluid before cell trapping for a single-cell trapping model with RhMain/RhTrap of (A) 2cell μm; (B) 3 μm; 4 μm; and trapping (D) 5 μm.model V represents ratios of13. 3 for different WHole before Figure Velocity of fluid trapping for(C) a single-cell with Rhthe Mainfluid’s /RhTrap Figure 13. Velocity −1. of fluid before cell trapping for a single-cell trapping model with RhMain /RhTrap velocity μm·s ratios of in 3 for different WHole of (A) 2 μm; (B) 3 μm; (C) 4 μm; and (D) 5 μm. V represents the fluid’s ratios of 3 for different W Hole of (A) 2 µm; (B) 3 µm; (C) 4 µm; and (D) 5 µm. V represents the fluid’s velocity in μm·s−1. ´1 velocity in µm¨ s .
Appl. Sci. 2016, 6, 40
13 of 17
Table 1. Summary of the simulation results for a single-cell trapping model’s ability for different values of W Hole and various RhMain /RhTrap ratios. W Hole /RhMain / RhTrap Ratio
1.0 µm
1.5 µm
2.0 µm
2.5 µm
3.0 µm
3.5 µm
4.0 µm
4.5 µm
5.0 µm
0.5 1.0 1.5 2.0 2.5 3.0 3.5 4.0 4.5 5.0 5.5 6.0
no no no no no no no no no no no no
no no no no no no no no no no no no
no no no no no no no no no no no no
no no no no no no no no no no no no
no no yes yes yes yes yes yes yes yes yes yes
no no yes yes yes yes yes yes yes yes yes yes
no no yes yes yes yes yes yes yes yes yes yes
no no yes yes yes yes yes yes yes yes yes yes
no no yes yes yes yes yes yes yes yes yes yes
4.3. Experimental Verification After analyzing the T-channel’s trapping ability by simulation, five microchips were fabricated with a trap channel size appropriate to trap a cell aggregate with a diameter of 25–35 µm. The trap channel’s size was designed to be W Trap 25 µm, W Hole 15 µm, LTrap 25 µm, and HChannel 15 µm with an RhMain /RhTrap ratio of 3. The computational prediction for - channel trapping was further validated experimentally using fabricated microfluidic devices and HUVEC cell aggregates. A single HUVEC cell aggregate was found to be directed by the fluid flow to enter the trap channel and trapped. Consistent results were obtained using all five fabricated microchips. Figure 14A–F demonstrate the movement of cell aggregates inside the T-channel from the channel’s inlet (right side) before and after trapping, sequentially. The single-cell aggregate moved from the inlet into the main channel (Figure 14A), reached the junction between the trap and main path (Figure 14B), entered the trap channel (Figure 14C), and was captured in the trap channel (Figure 14D). Results show that the fluid stream produced inside the T-channel was able to direct and lead the cell aggregate to enter the trap channel. In addition, the subsequent cell aggregate moved to bypass the trap channel (Figure 14E) and passed through the main channel (Figure 14F). This finding demonstrated that a change of hydrodynamic resistance between the channels occurred after the cell aggregate was trapped. This caused the increase of RhTrap and prevented subsequent cell aggregates from entering the trap channel. This result was in agreement with the simulation data and hydrodynamic trapping concept. This T-channel trapping could be applied to trapping other cell types and sizes. For example, for the purpose of trapping a smaller single cell, W Trap , W Hole , LTrap , and HChannel dimensions should be reduced, while for single spheroid capture, the dimension should be increased appropriately for the target cell. The proposed T-channel trapping is an approach to trap a single cell with a platform for single-cell analysis plus access for further manipulation through the W Hole and its outlet. This T-channel could be upgraded by increasing its throughput ability through applying more parallel trapping channels in a single microfluidic chip. Therefore, many single cells/3D cells could be cultured and applied with treatments at a time. The treated cells/3D cells could be further analyzed by applying mechanical or electrical characterization (e.g., stiffness, adhesion, or electrical measurements) in the manipulation platform and can be harvested from the microfluidic chip for further analysis.
Appl. Sci. 2016, 6, 40
14 of 17
Appl. Sci. 2016, 6, 40
14 of 17
Figure 14. Experimental results using a fabricated T-channel chip demonstrating the sequential of
Figure 14. Experimental results using a fabricated T-channel chip demonstrating the sequential HUVEC cell aggregate trapping: (A) cell aggregate movement from inlet to the main channel; (B) cell of HUVEC cellbefore aggregate trapping: (A) cell movement from the main channel; aggregate reaching trap channel; (C) aggregate cell aggregate movement intoinlet trap to channel; (D) cell (B) cell aggregate before reaching trap channel; (C) cell aggregate movement into trap aggregate trapped into trap channel; (E) subsequent cell aggregate approaching trap channel; channel; (F) (D) cell aggregate into trap channel; (E) subsequent cell aggregate approaching trap channel; subsequent celltrapped aggregate bypassed trap channel. (F) subsequent cell aggregate bypassed trap channel. 5. Conclusions
5. Conclusions This study presents a T-channel single particle/cell hydrodynamic trap that provides a platform and access for further single particle/cell characterization. The channel has a unique trapping site that
This study presents a T-channel single particle/cell hydrodynamic trap that provides a platform allows for single particle/cell manipulation to be performed using the trap channel’s outlet port. and access for further single particle/cell characterization. The channel has a unique trapping site A finite element T-channel trapping model has been developed and could be utilized as a guideline that allows for single particle/cell to be performed channel’s outlet port. in designing T-channel trappingmanipulation for other cell/particle types andusing sizes the for trap microchip fabrication. A finite element T-channel trapping model has been developed and could be utilized as a guideline in Trapping ability can be simulated and analyzed using the developed finite element T-channel designing T-channel trapping forvalidated other cell/particle types andHUVEC sizes forcell microchip fabrication. Trapping trapping model and has been by experiment using aggregates. The proposed T-channel has potential applications single-cell characterization, single 3DT-channel cell aggregates drugs ability can be simulated and analyzed in using the developed finite element trapping model treatments, and spheroid tumor and metastasis studies. and has been validated by experiment using HUVEC cell aggregates. The proposed T-channel has potential applicationsThe in single-cell singleof3D cell aggregates drugs treatments, Acknowledgments: research wascharacterization, supported by the Ministry Higher Education of Malaysia (grant Nos. and 4L640tumor and 4F351) Universitistudies. Teknologi Malaysia (grant Nos. 4J148, 02G46, 03H82, and 03H80); we thank spheroid andand metastasis them for funding this project and for their endless support. The authors would like to express their heartiest appreciation to Mohd Basri from the Faculty of Electrical Engineering, Universiti Teknologi(grant Acknowledgments: The Ariffanan research Mohd was supported by the Ministry of Higher Education of Malaysia Malaysia for4F351) his contribution of ideas and valuable discussion during theoretical this study. Nos. 4L640 and and Universiti Teknologi Malaysia (grant Nos.the 4J148, 02G46,development 03H82, and of 03H80); we thank them for funding this project and for their endless support. The authors would like to express their heartiest Author Contributions: Amelia Ahmad Khalili, designed and performed the experiments and appreciation to Mohd Ariffanan Mohd Basri from the Faculty of Electrical Engineering, Universiti Teknologi Mohd Ridzuan Ahmad supervised the project and edited the article. Masaru Takeuchi, Masahiro Nakajima, and Malaysia for his contribution of ideas and valuable discussion during the theoretical development of this study. Yasuhisa
Hasegawa
contributed
to
the
reagents,
materials
and
microchip
fabrication
facilities.
Author Contributions: Khalili, designed and performed the experiments and Mohd Ridzuan Ahmad Razauden MohamedAmelia ZulkifliAhmad contributed to the cells, reagents, and materials for the experimental studies. supervised the project and edited the article. Masaru Takeuchi, Masahiro Nakajima, and Yasuhisa Hasegawa Conflicts of Interest: The authors declare no conflict of interest.facilities. Razauden Mohamed Zulkifli contributed contributed to the reagents, materials and microchip fabrication to the cells, reagents, and materials for the experimental studies. Conflicts of Interest: The authors declare no conflict of interest.
References 1.
Hoffmann, C.S.; Cohnen, A.; Ludwig, T.; Watzl, C. 2B4 engagement mediates rapid LFA-1 and actin-dependent NK cell adhesion to tumor cells as measured by single cell force spectroscopy. J. Immunol. 2011, 186, 2757–2764. [CrossRef] [PubMed]
Appl. Sci. 2016, 6, 40
2.
3. 4. 5. 6. 7.
8.
9. 10. 11.
12. 13. 14.
15.
16. 17.
18. 19. 20. 21. 22. 23. 24.
15 of 17
Beaussart, A.; El-Kirat-Chatel, S.; Sullan, R.M.A.; Alsteens, D.; Herman, P.; Derclaye, S.; Dufrêne, F.Y. Quantifying the forces guiding microbial cell adhesion using single-cell force spectroscopy. Nat. Protoc. 2014, 9, 1049–1055. [CrossRef] [PubMed] Engel, A.; Gaub, E.H. Structure and mechanics of membrane proteins. Annu. Rev. Biochem. 2008, 77, 127–148. [CrossRef] [PubMed] Yang, S.-P.; Yang, C.-Y.; Lee, T.-M.; Lui, T.-S. Effects of calcium-phosphate topography on osteoblast mechanobiology determined using a cytodetacher. Mater. Sci. Eng. C 2012, 32, 254–262. [CrossRef] Muller, J.D. AFM: A Nanotool in Membrane Biology. Biochemistry 2008, 47, 7896–7898. [CrossRef] [PubMed] Khalili, A.A.; Ahmad, R.M. A review of cell adhesion studies for biomedical and biological applications. Int. J. Mol. Sci. 2015, 16, 18149–18184. [CrossRef] [PubMed] Palmer, C.P.; Mycielska, M.E.; Burcu, H.; Osman, K.; Collins, T.; Beckerman, R.; Perrett, R.; Johnson, H.; Aydar, E.; Djamgoz, M.B.A. Single cell adhesion measuring apparatus (SCAMA): Application to cancer cell lines of different metastatic potential and voltage-gated Na+ channel expression. Eur. Biophys. J. 2008, 37, 359–368. [CrossRef] [PubMed] Gao, Z.; Wang, S.; Zhu, H.; Su, C.; Xu, G.; Lian, X. Using selected uniform cells in round shape with a micropipette to measure cell adhesion strength on silk fibroin-based materials. Mater. Sci. Eng. C 2008, 28, 1227–1235. [CrossRef] Hochmuth, R.M. Micropipette aspiration of living cells. J. Biomech. 2000, 33, 15–22. [CrossRef] Gourier, C.; Jegou, A.; Husson, J.; Pincet, F. A nanospring named erythrocyte. The biomembrane force probe. Cell. Mol. Bioeng. 2008, 1, 263–275. [CrossRef] Evans, E.; Heinrich, V.; Leung, A.; Kinoshita, K. Nano- to microscale dynamics of P-selectin detachment from leukocyte interfaces. I. Membrane separation from the cytoskeleton. Biophys. J. 2005, 88, 2288–2298. [CrossRef] [PubMed] Castelain, M.; Rouxhet, P.G.; Pignon, F.; Magnin, A.; Piau, J.-M. Single-cell adhesion probed in-situ using optical tweezers: A case study with Saccharomyces cerevisiae. J. Appl. Phys. 2012, 111. [CrossRef] Schwingel, M.; Bastmeyer, M. Force mapping during the formation and maturation of cell adhesion sites with multiple optical tweezers. PLoS ONE 2013, 8. [CrossRef] [PubMed] Castelain, M.; Pignon, F.; Piau, J.-M.; Magnin, A. The initial single yeast cell adhesion on glass via optical trapping and Derjaguin-Landau-Verwey-Overbeek predictions. J. Chem. Phys. 2008, 128. [CrossRef] [PubMed] Chen, J.; Zheng, Y.; Tan, Q.; Zhang, Y.L.; Li, J.; Geddie, W.R.; Jewett, M.A.S.; Sun, Y. A microfluidic device for simultaneous electrical and mechanical measurements on single cells. Biomicrofluidics 2011, 5. [CrossRef] [PubMed] Mondal, D.; RoyChaudhuri, C.; Das, L.; Chatterjee, J. Microtrap electrode devices for single cell trapping and impedance measurement. Biomed. Microdevices 2012, 14, 955–964. [CrossRef] [PubMed] Gabriele, S.; Versaevel, M.; Preira, P.; Theodoly, O. A simple microfluidic method to select, isolate, and manipulate single-cells in mechanical and biochemical assays. Lab Chip 2010, 10, 1459–1467. [CrossRef] [PubMed] Forsyth, A.M.; Wan, J.; Ristenpart, W.D.; Stone, H.A. The dynamic behavior of chemically “stiffened” red blood cells in microchannel flows. Microvasc. Res. 2010, 80, 37–43. [CrossRef] [PubMed] Cho, Y.; Kim, H.S.; Bruno Frazier, A.; Chen, Z.G.; Shin, D.M.; Han, A. Whole-cell impedance analysis for highly and poorly metastatic cancer cells. J. Microelectromech. Syst. 2009, 18, 808–817. Lee, G.-H.; Kim, S.-H.; Kang, A.; Takayama, S.; Lee, S.-H.; Park, J.Y. Deformable L-shaped microwell array for trapping pairs of heterogeneous cells. J. Micromech. Microeng. 2015, 25. [CrossRef] Sun, T.; Kovac, J.; Voldman, J. Image-based single-cell sorting via dual-photopolymerized microwell arrays. Anal. Chem. 2014, 86, 977–981. [CrossRef] [PubMed] Rettig, J.R.; Folch, A. Large-scale single-cell trapping and imaging using microwell arrays. Anal. Chem. 2005, 77, 5628–5634. [CrossRef] [PubMed] Tang, J.; Peng, R.; Ding, J. The regulation of stem cell differentiation by cell-cell contact on micropatterned material surfaces. Biomaterials 2010, 31, 2470–2476. [CrossRef] [PubMed] Doh, J.; Kim, M.; Krummel, M.F. Cell-laden microwells for the study of multicellularity in lymphocyte fate decisions. Biomaterials 2010, 31, 3422–3428. [CrossRef] [PubMed]
Appl. Sci. 2016, 6, 40
25.
26. 27. 28. 29. 30.
31. 32.
33. 34.
35.
36. 37. 38. 39. 40. 41. 42. 43. 44. 45. 46. 47. 48.
16 of 17
Chen, N.-C.; Chen, C.-H.; Chen, M.-K.; Jang, L.-S.; Wang, M.-H. Single-cell trapping and impedance measurement utilizing dielectrophoresis in a parallel-plate microfluidic device. Sens. Actuators B Chem. 2014, 190, 570–577. [CrossRef] Sen, M.; Ino, K.; Ramon-Azcon, J.; Shiku, H.; Matsue, T. Cell pairing using a dielectrophoresis-based device with interdigitated array electrodes. Lab Chip 2013, 13, 3650–3652. [CrossRef] [PubMed] Voldman, J.; Gray, M.L.; Toner, M.; Schmidt, M.A. A microfabrication-based dynamic array cytometer. Anal. Chem. 2002, 74, 3984–3990. [CrossRef] [PubMed] Thomas, R.S.; Morgan, H.; Green, N.G. Negative DEP traps for single cell immobilisation. Lab Chip 2009, 9, 1534–1540. [CrossRef] Gray, D.S.; Tan, J.L.; Voldman, J.; Chen, C.S. Dielectrophoretic registration of living cells to a microelectrode array. Biosens. Bioelectron. 2004, 19, 771–780. [CrossRef] [PubMed] Chen, Y.-C.; Allen, S.G.; Ingram, P.N.; Buckanovich, R.; Merajver, S.D.; Yoon, E. Single-cell migration chip for chemotaxis-based microfluidic selection of heterogeneous cell populations. Sci. Rep. 2015, 5, 1–13. [CrossRef] [PubMed] Jin, D.; Deng, B.; Li, J.X.; Cai, W.; Tu, L.; Chen, J.; Wu, Q.; Wang, W.H. A microfluidic device enabling high-efficiency single cell trapping. Biomicrofluidics 2015, 9. [CrossRef] [PubMed] Benavente-Babace, A.; Gallego-Pérez, D.; Hansford, D.J.; Arana, S.; Pérez-Lorenzo, E.; Mujika, M. Single-cell trapping and selective treatment via co-flow within a microfluidic platform. Biosens. Bioelectron. 2014, 61, 298–305. [CrossRef] [PubMed] Kim, J.; Erath, J.; Rodriguez, A.; Yang, C. A high-efficiency microfluidic device for size-selective trapping and sorting. Lab Chip 2014, 14, 2480–2490. [CrossRef] [PubMed] Lee, P.J.; Hung, P.J.; Shaw, R.; Jan, L.; Lee, L.P. Microfluidic application-specific integrated device for monitoring direct cell-cell communication via gap junctions between individual cell pairs. Appl. Phys. Lett. 2005, 86. [CrossRef] Frimat, J.-P.; Becker, M.; Chiang, Y.-Y.; Marggraf, U.; Janasek, D.; Hengstler, J.G.; Franzke, J.; West, J. A microfluidic array with cellular valving for single cell co-culture. Lab Chip 2011, 11, 231–237. [CrossRef] [PubMed] Kim, H.; Lee, S.; Kim, J. Hydrodynamic trap-and-release of single particles using dual-function elastomeric valves: design, fabrication, characterization. Microfluid. Nanofluid. 2012, 13, 835–844. [CrossRef] Arakawa, T.; Noguchi, M.; Sumitomo, K.; Yamaguchi, Y.; Shoji, S. High-throughput single-cell manipulation system for a large number of target cells. Biomicrofluidics 2011, 5. [CrossRef] [PubMed] Kobel, S.; Valero, A.; Latt, J.; Renaud, P.; Lutolf, M. Optimization of microfluidic single cell trapping for long-term on-chip culture. Lab Chip 2010, 10, 857–863. [CrossRef] [PubMed] Hong, S.; Pan, Q.; Lee, L.P. Single-cell level co-culture platform for intercellular communication. Integr. Biol. 2012, 4, 374–380. [CrossRef] [PubMed] Shi, W.; Qin, J.; Ye, N.; Lin, B. Droplet-based microfluidic system for individual Caenorhabditis elegans assay. Lab Chip 2008, 8, 1432–1435. [CrossRef] [PubMed] Di Carlo, D.; Aghdam, N.; Lee, L.P. Single-cell enzyme concentrations, kinetics, and inhibition analysis using high-density hydrodynamic cell isolation arrays. Anal. Chem. 2006, 78, 4925–4930. [CrossRef] [PubMed] Skelley, A.M.; Kirak, O.; Suh, H.; Jaenisch, R.; Voldman, J. Microfluidic control of cell pairing and fusion. Nat. Meth. 2009, 6, 147–152. [CrossRef] [PubMed] Di Carlo, D.; Wu, L.Y.; Lee, L.P. Dynamic single cell culture array. Lab Chip 2006, 6, 1445–1449. [CrossRef] [PubMed] Tan, W.-H.; Takeuchi, S. A trap-and-release integrated microfluidic system for dynamic microarray applications. Proc. Natl. Acad. Sci. USA 2007, 104, 1146–1151. [CrossRef] [PubMed] Chung, K.; Rivet, C.A.; Kemp, M.L.; Lu, H.; States, U. Imaging single-cell signaling dynamics with a deterministic high-density single-cell trap array. Anal. Chem. 2011, 83, 7044–7052. [CrossRef] [PubMed] Jin, H.-J.; Cho, Y.-H.; Gu, J.-M.; Kim, J.; Oh, Y.-S. A multicellular spheroid formation and extraction chip using removable cell trapping barriers. Lab Chip 2011, 11, 115–119. [CrossRef] [PubMed] Kangsun, L.; Choong, K.; Jae, Y.Y.; Hun, L.; Byungwook, A.; Linfeng, X.; Ji, Y.K.; Oh, K.W. Gravity-oriented microfluidic device for uniform and massive cell spheroid formation. Biomicrofluidics 2012, 6, 14114–141147. Li, X.; Valadez, A.V.; Zuo, P.; Nie, Z. Microfluidic 3D cell culture: potential application for tissue-based bioassays. Bioanalysis 2012, 4, 1509–1525. [CrossRef] [PubMed]
Appl. Sci. 2016, 6, 40
49. 50.
51. 52. 53. 54. 55. 56.
57. 58. 59.
17 of 17
Teshima, T.; Ishihara, H.; Iwai, K.; Adachi, A.; Takeuchi, S. A dynamic microarray device for paired bead-based analysis. Lab Chip 2010, 10, 2443–2448. [CrossRef] [PubMed] Kumano, I.; Hosoda, K.; Suzuki, H.; Hirata, K.; Yomo, T. Hydrodynamic trapping of Tetrahymena thermophila for the long-term monitoring of cell behaviors. Lab Chip 2012, 12, 3451–3457. [CrossRef] [PubMed] Gervais, T.; El-Ali, J.; Günther, A.; Jensen, K.F. Flow-induced deformation of shallow microfluidic channels. Lab Chip 2006, 6, 500–507. [CrossRef] [PubMed] Smith, A.E.; Zhang, Z.; Thomas, C.R.; Moxham, K.E.; Middelberg, A.P. The mechanical properties of saccharomyces cerevisiae. Proc. Natl. Acad. Sci. USA 2000, 97, 9871–9874. [CrossRef] [PubMed] Bryan, A.K.; Goranov, A.; Amon, A.; Manalis, S.R. Measurement of mass, density, and volume during the cell cycle of yeast. Proc. Natl. Acad. Sci. USA 2010, 107, 999–1004. [CrossRef] [PubMed] Stenson, J.D.; Thomas, C.R.; Hartley, P. Modelling the mechanical properties of yeast cells. Chem. Eng. Sci. 2009, 64, 1892–1903. [CrossRef] Stenson, J.D.; Hartley, P.; Wang, C.; Thomas, C.R. Determining the mechanical properties of yeast cell walls. Biotechnol. Prog. 2011, 27, 505–512. [CrossRef] [PubMed] Burg, T.P.; Godin, M.; Knudsen, S.M.; Shen, W.; Carlson, G.; Foster, J.S.; Babcock, K.; Manalis, S.R. Weighing of biomolecules, single cells and single nanoparticles in fluid. Nature 2007, 446, 1066–1069. [CrossRef] [PubMed] Lee, J.; Chunara, R.; Shen, W.; Payer, K.; Babcock, K.; Burg, T.P.; Manalis, S.R. Suspended microchannel resonators with piezoresistive sensors. Lab Chip 2011, 11, 645–651. [CrossRef] [PubMed] Khalili, A.A.; Ahmad, M.R. Numerical analysis of hydrodynamic flow in microfluidic biochip for single-cell trapping application. Int. J. Mol. Sci. 2015, 16, 26770–26785. [CrossRef] [PubMed] Khalili, A.A.; Basri, M.A.M.; Ahmad, M.R. Simulation of single cell trapping via hydrodynamic manipulation. J. Teknol. 2014, 69, 121–126. © 2016 by the authors; licensee MDPI, Basel, Switzerland. This article is an open access article distributed under the terms and conditions of the Creative Commons by Attribution (CC-BY) license (http://creativecommons.org/licenses/by/4.0/).