ically implemented by means of a dedicated buffer1. Data pushing enables ...... in a Linux RedHat server equipped with an Intel Xeon CPU at. 2.00 GHz and 64 ...
This article has been accepted for publication in a future issue of this journal, but has not been fully edited. Content may change prior to final publication. Citation information: DOI 10.1109/TSG.2016.2622725, IEEE Transactions on Smart Grid 1
Architecture and Experimental Validation of a Low-Latency Phasor Data Concentrator Asja Derviˇskadi´c, Member, IEEE, Paolo Romano, Member, IEEE, Marco Pignati, Member, IEEE, Mario Paolone, Senior Member, IEEE .
Abstract—The paper presents the design principles of a Phasor Data Concentrator (PDC) that implements both the absolute and relative time data pushing logics together with a third one that aims at minimizing the latency introduced by the PDC without increasing the data incompleteness, as suggested in the IEEE Guide C37.244-2013. The performance of the aforementioned logics are assessed and compared in terms of reliability, determinism and reduction of the overall latency in two real Phasor Measurement Unit (PMU) installations adopting different telecom infrastructures. The first one is based on optical fiber links that transmit synchrophasor data measured by 15 PMUs installed in the sub-transmission network of the city of Lausanne, Switzerland. The second one adopts a 4G LTE wireless infrastructure to support the data streaming of 10 PMUs installed in a distribution network supplying the city of Huissen, in the Netherlands. The experimental results show that the proposed logic is characterized by the lowest latency, whereas the absolute time logic better mitigates the synchrophasor data latency variations. Index Terms—Phasor Data Concentrator, Phasor Measurement Unit, IEEE Guide C37.244-2013, Data Pushing Logics.
I. I NTRODUCTION
T
HE Phasor Data Concentrator (PDC) is a key element of any synchrophasor network [1], as it is located between the various Phasor Measurement Units (PMUs) [2] and the applications consuming the synchrophasor data (e.g., [3], [4]). If not properly designed, the PDC might represent a “single point of failure” for the associated Wide-Area Monitoring and Control (WAMC) applications and eventually increase their overall latency way above the maximum allowed limits. According to the IEEE Guide C37.244-2013 [1], the most relevant functionalities of a PDC are data aggregation and data pushing, which are meant to mitigate the latency variations introduced by the various components of the synchrophasor network. Data aggregation enables to aggregate data coming from multiple PMUs into a time-aligned dataset and is typically implemented by means of a dedicated buffer1 . Data pushing enables to forward the time-aligned dataset to the subsequent applications and is typically performed by setting the so-called PDC wait time, i.e., the amount of time the ´ The Authors are with the Ecole Polytechnique F´ed´erale de Lausanne EPFL, CH-1015, Lausanne, Switzerland. The Authors would like to thank Services Industriels de Lausanne (SiL) and Alliander for their support and collaboration to carry out this research. The research leading to these results has received funding from the European Community’s Seventh Framework Programme FP7-ICT-2011-8 under grant agreement no 318708 (C-DAX) 1 Time-alignment is not mandatory but is a de-facto standard PDC function that leverage the PMU measurement time-stamps
PDC actively waits for data frames with a given time-stamp. Once the dataset is completely filled, or a maximum wait time has elapsed, the PDC pushes the dataset to the supplied applications. In [1] two logics are defined for setting the PDC wait time: an absolute time logic, where the data pushing is performed once a specific UTC time is reached, and a relative time logic, in which the PDC waits for a specified relative time triggered by an event, that could be the arrival of the first data with a specific time-stamp. Within this context, this paper first presents the architecture of a PDC that implements both the data aggregation and data pushing functions as presented in [1]. Then, it compares the timing performances of the aforementioned logics in terms of reliability, determinism and reduction of the overall latencies, by validating them in two real PMU deployments that adopt different telecom infrastructures. The first one is based on optical fiber links that transmit synchrophasor data measured by 15 PMUs installed in the sub-transmission network of the city of Lausanne, Switzerland. The second one adopts a 4G LTE wireless infrastructure to support the data streaming of 10 PMUs installed in a distribution network supplying the city of Huissen, in the Netherlands. The paper is organized as follows. Section II reviews the existing literature in the field of PDC design and performance assessment. Section III analyzes and decomposes the synchrophasor network latencies in their various contributions to highlight the influence of the PDC latency. Then, Section IV illustrates the proposed PDC architecture. Finally, Section V presents the test bed of the two field trials and the performance assessment. Section VI concludes the paper with final remarks. II. R ELATED W ORKS The functional and performance requirements of a generic PDC are defined in [1]. Nevertheless, this guide does not contain any implementation detail. In this respect, [5] and [6] present two possible PDC designs and highlight the relevant inconsistencies that could arise from an inaccurate PDC implementation and eventually affect the WAMC operation. In [7] and [8] test methodologies for validating core PDC features, together with the functional and communication needs of a generic PDC are proposed. Reference [9] provides the general design for a flexible PDC integrating a relative time data pushing logic, including a database for synchrophasor data and a graphical user interface. Several recent works pay particular attention to the PDC wait time. In [10] an optimal stopping approach to the PDC
1949-3053 (c) 2016 IEEE. Personal use is permitted, but republication/redistribution requires IEEE permission. See http://www.ieee.org/publications_standards/publications/rights/index.html for more information.
This article has been accepted for publication in a future issue of this journal, but has not been fully edited. Content may change prior to final publication. Citation information: DOI 10.1109/TSG.2016.2622725, IEEE Transactions on Smart Grid 2
PMU
Network
App
PDC
• ta
ts PMU latency
Network latency
tp
time
PDC latency
Synchrophasor data latency PDC reporting latency
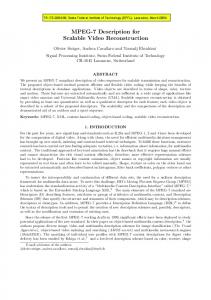
Fig. 1. The PDC reporting latency decomposed in its individual contributions. The synchrophasor time-stamp ts , the data frame arrival time ta and the timealigned dataset push time tp are highlighted.
relative wait time is presented in order to maximize the throughput of synchrophasor data delivery. In [11] and [12] a similar approach is proposed for a PDC used for widearea damping control. Reference [13] focuses on the impact of some PDC settings, and particularly the relative wait time, on the timeliness and incompleteness of the outgoing data stream of a WAMC. All the above-mentioned papers do not consider the possibility of adopting different data pushing logics as specified in [1] and disregard the related effects. Moreover, these works were validated throughout simulations, and, to the best of the Authors’ knowledge, there are no contributions that have analyzed the performance of different data pushing logics in real field trials. III. PDC R EPORTING L ATENCY A NALYSIS In general, when designing a PMU-based monitoring system, one of the main design parameters is the PDC reporting latency, i.e., the time difference between the instant a set of synchrophasor data characterized by the same time-stamp is pushed by the PDC to the subsequent applications and the time-stamp itself. Depending on the supplied applications (see [14] for a complete review of the latency requirements of various WAMC applications), this parameter can vary between few hundreds of milliseconds (e.g., hard real-time applications like synchrophasor-based fault management systems [15]), to few tens of seconds (e.g., soft real-time applications like voltage control [16]). The PDC reporting latency can be decomposed in its individual contributions in order to have a better understanding of the various latency sources (see Fig. 1): •
The PMU measurement reporting latency is defined in the IEEE Std. C37.118.1-2011 [2] as the time delay between the instant a specific event occurs in the power system and the instant the same event is reported by the PMU. This latency is mainly influenced by the adopted window length to estimate the synchrophasor and by the time spent in estimating the synchrophasors. It can be reduced by shortening the window length and, independently of the selected synchrophasor estimation technique, by adopting more performing hardware platforms. However, such a contribution turns out to be quite deterministic compared to others. Additionally, reference [2] provides
•
the maximum reporting latency for a PMU, as a function of its performance class and its reporting rate. The communication network latency is the time difference between the instant a PMU has transmitted a data frame on its physical channel and the instant the same data frame hits the PDC network interface. Together with the PMU measurement reporting latency, it defines the socalled synchrophasor data latency. Synchrophasor data can be carried over any wired or wireless communication layer that has sufficient bandwidth and reduced data transmission latency to support PMU data streams characterized by a specific reporting rate and message size. Depending on the adopted information and communication technology, this contribution might introduce relatively high delays and non-deterministic latency variations. The PDC latency is defined as the time difference between the instant a time-aligned dataset is pushed to the supplied applications and the instant the first message with a given time-stamp hits the PDC. The PDC latency is composed of two contributions: (i) the PDC wait time that starts when the first message with a specific time-stamp enters the PDC and ends when the last one arrives or the associated timeout expires; (ii) the PDC processing time, i.e., the amount of time needed by the PDC to complete the production of an aggregated dataset. Typically the former by far outweighs the latter. It is worth pointing out that a well designed PDC does not introduce any latency: it simply acts as a buffer that mitigates the real-time variation of the synchrophasor data latency, by waiting the necessary amount of time to gather most of the incoming data frames characterized by the same timestamp. Reference [1] does not define a specific limit value to the PDC latency, it just emphasizes the fact that it should be as low as possible, coherently with the PDC wait time setting. IV. P ROPOSED PDC A RCHITECTURE
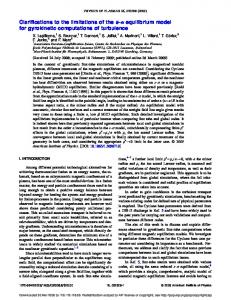
A high-level design of the proposed PDC architecture is shown in Fig. 2. It implements most of the functions described in [1]. However, for the sake of brevity, we focus only on those affecting the PDC reporting latency and the data incompleteness. For each connected PMU, the PDC opens a socket (UDP or TCP) on a specific local port and continuously listens to incoming PMU data frames2 . When a new datagram is received, data validation is performed and invalid frames are discarded. The frame follows a different path based on its type. Once the configuration frame for a given PMU is received, the parsing of data frames coming from that specific PMU can start (as it is known, configuration frames enable the PDC to interpret the data frames). Finally, the PDC time-aligns 2 The use of Deep Packet Inspection (DPI) in next-generation firewalls enables to inspect the incoming traffic based on flows and not per TCP or UDP port. In this sense, as all PMU traffic has the same type of flow, each PMU packet is inspected by the same DPI rule. Therefore, the use of several sockets does not cause any extra security concerns and could help in multithread applications [17], [18].
1949-3053 (c) 2016 IEEE. Personal use is permitted, but republication/redistribution requires IEEE permission. See http://www.ieee.org/publications_standards/publications/rights/index.html for more information.
This article has been accepted for publication in a future issue of this journal, but has not been fully edited. Content may change prior to final publication. Citation information: DOI 10.1109/TSG.2016.2622725, IEEE Transactions on Smart Grid 3
PDC
Data Concentration
PMU2
1
2
CFG frame Parsing
App1
1
1
App2 CFG
2 2 N
Data frame Parsing
1
Data Aggregation
...
...
Data
1
Data Pushing 1
1
1 2
PMUN
N
N
N
N
N
N
N
...
...
...
...
...
...
...
2 1
...
PMU1
Data Identification
N
AppP
ts
Fig. 2. Architecture of the proposed PDC collecting data frames from N PMUs and pushing time-aligned datasets to P applications.
the data and pushes the aggregated dataset to the supplied applications. To accomplish the data aggregation and data pushing functions, a circular fixed-size data buffer is adopted (see Fig. 3). The buffer is implemented as a 2D array, having N columns, one for each PMU, and M rows, one for each stored timestamp. During the initialization phase, a specific column of this buffer is assigned to each PMU data stream, based on the stream IDCODE, a number that identifies a specific PMU data stream [19]. The number of rows M is hereafter called buffer depth and represents the amount of time-stamps that are stored in the buffer. The buffer history length Th can be derived from the buffer depth and the PMU reporting rate as Th = M/Fr = M · Tr , being Fr = 1/Tr the PMU reporting rate and Tr the PMU reporting interval. Each row represents a time-aligned dataset gathering data frames with a specific time-stamp ts from all PMUs. A pointer p points to the next line to be pushed to real-time applications. The line order is such that time-stamps are monotonically increasing within the circular buffer. When the buffer is filled new data overwrites the old one. This avoids to rotate the buffer’s elements when data are released. A. Stand-alone logic for Data Aggregation In the developed PDC, data aggregation is performed with time-alignment. A new data frame is filled in position (m, n) of the buffer, being m the buffer line corresponding to its time-stamp ts and n the column corresponding to its PMU ID. Before inserting the data frame in a specific buffer position (m, n), the buffer lines are updated depending on the received time-stamp ts unless ts < tmin , in which case the data frame is discarded. If tmin ≤ ts ≤ tmax the buffer time-stamps are not updated. If ts > tmax , the oldest lines are first fed to soft realtime applications and then replaced with the newest ones. In this case, starting from the line characterized by the minimum
time-stamp tmin , a set of ((ts − tmax )/Tr ) ∈ N empty lines3 , characterized by newer time-stamps up to ts , overwrites the older ones. If a data-frame characterized by a time stamp greater than the actual UTC time is received (i.e., a timestamp coming from the future), the data frame is discarded. This plausibility check is possible only by synchronizing the PDC to an absolute time reference. Such a data aggregation logic, that overwrites older lines whenever a newer time-stamp is received at the PDC, gathers data frames independently of the adopted data pushing logic without causing any memory leak. B. Absolute and Relative Time Data Pushing logics In order to present a possible implementation of the absolute and relative time data pushing logics, let us consider the aggregation process of data frames characterized by timestamp ts coming from a set of N PMUs (see Fig. 4). Let us also assume that the arrival times of the first and last data frames hitting the PDC are ta,i and ta,j respectively, i.e., the arrival times of the data frames generated by the i-th and j-th PMUs. In case an absolute time data pushing logic is adopted, the PDC must be synchronized to an absolute time reference. The wait time refers to the data frames time-stamp ts and elapses at time tp = ts + Tabs , (1) being tp the PDC push time and Tabs the absolute PDC wait time. Besides, in case a relative time data pushing logic is adopted, the wait time counter is triggered by the reception of the first data frame characterized by a time-stamp ts and elapses at time tp = ta,i + Trel , (2) 3 Please note that the ratio ((t − t s max )/Tr ) belongs to N, because the numerator (i.e., the difference between two time-stamps) is, by definition, an integer multiple of the denominator (i.e., the time interval between two consecutive time-stamps).
1949-3053 (c) 2016 IEEE. Personal use is permitted, but republication/redistribution requires IEEE permission. See http://www.ieee.org/publications_standards/publications/rights/index.html for more information.
This article has been accepted for publication in a future issue of this journal, but has not been fully edited. Content may change prior to final publication. Citation information: DOI 10.1109/TSG.2016.2622725, IEEE Transactions on Smart Grid 4
PDC buffer
N columns # of PMUs tmax-Tr
PMU1
N
2
1
...
N
N
1
2
N
...
1
2
N
ts
1
2
N
...
...
PMUN
i
i
j
PMUN
j
N
p
N
2
PMU1 PMU2
PMUj
i
...
2
i
i
...
1
M rows Buffer Depth
PMUi
tmin+Tr
1
...
tmax tmin
1
ts
N
N
N
ts
ts
ts
ts
ta,i
ta,N
ta,1
ta,j
time
Tabs Absolute and Relative Time Logic:
Fig. 3. Layout of the circular buffer used to aggregate and time-align the incoming data flows generated by N PMUs. It can store up to M time-aligned datasets characterized by time-stamps in the range tmin < ts < tmax . A pointer p points the next line to be pushed to the supplied applications.
being Trel the relative wait time. From equation (2), it is evident that adopting a relative time data pushing logic might not always guarantee to fulfill the latency requirements of the supplied application, which might be affected by the real-time variations of the network latency (i.e., the jitter of the interarrival times). At time tp the aggregated dataset is pushed to the supplied applications and the pointer p is incremented (modulo the buffer depth M ). The introduction of the pointer p guarantees that, even if data frames arrive in the PDC out of order, the time-aligned datasets are always pushed based on the timestamp order. For both absolute or relative time data pushing logics, when the wait time has elapsed, the time-aligned dataset is pushed even if some data have not yet reached the PDC and the missing data is indicated by rising a proper flag. In such a case, the subsequent applications are assumed to cope with incomplete datasets by using replacement techniques or historical information (e.g. [20], [21]). Consequently, a delayed packet that reaches the PDC when its corresponding dataset has already been pushed, is lost and it is no longer available for further applications. Even though this paper does not deal with the optimal selection of the PDC wait time, it is evident that this parameter plays a crucial role in the overall PDC design. It must be selected as a trade-off between the desired dataset completeness and the latency requirements of the power system application being served by the PDC. In case of non real-time applications, to reduce dataset incompleteness due to late data arrival, longer PDC wait times can be set, with the consequent increase of the overall latency of the system. Such an approach cannot be adopted for real-time applications and the PDC wait time must be set accordingly. In the case of absolute time logic, Tabs has to be set according to the measured synchrophasor data latency in order to push time-aligned datasets that are mostly complete. In this
Trel tp
TPDC
Push-when-complete Logic: TPDC
tp = ta,j
Fig. 4. Comparison between the various data pushing logics in the case of a PDC gathering data frames from N PMUs characterized by time-stamp ts . The arrival times of the first and the last data frame characterized by time-stamp ts are indicated by ta,i and ta,j , respectively.
case the minimum allowed buffer depth is4 � � Tabs − Tmin M= +1 Tr
(3)
where d·e represents the ceiling function and Tmin the minimum possible PMU measurement reporting latency. Besides, in case of relative time, Trel has to be set according to the measured time needed to receive all data frames of a specific dataset. Similarly to equation (3), the resulting minimum buffer length is computed as4 � � Trel M= +1 (4) Tr As the same PDC can simultaneously supply applications characterized by different time requirements, several instances of the presented data pushing logics can run in parallel on the same buffer. Each one has its own PDC wait time setting and its own pointer p. In such a case, the actual buffer depth M is defined by the maximum PDC wait time. Therefore, the data aggregation process in a buffer line that has already been pushed to a hard real-time application continues until the limit allowed by the buffer depth. Consequently, datasets that are more likely to be complete are fed to soft real-time applications (for instance, a local database). C. Push-when-complete logic If the synchrophasor network is properly designed and the PDC wait time correctly set, most of the datasets are 4 Please note that the +1 in equations (3) and (4) is necessary in order to properly handle data frames arriving at the PDC at the same time instant when their corresponding dataset is being pushed. In the case of an absolute time logic, this can occur only when the difference (Tabs − Tmin ) is an exact multiple of Tr , whereas in the case of a relative time logic this can occur at any time.
1949-3053 (c) 2016 IEEE. Personal use is permitted, but republication/redistribution requires IEEE permission. See http://www.ieee.org/publications_standards/publications/rights/index.html for more information.
This article has been accepted for publication in a future issue of this journal, but has not been fully edited. Content may change prior to final publication. Citation information: DOI 10.1109/TSG.2016.2622725, IEEE Transactions on Smart Grid 5
completed before the timeout elapses. According to the logics presented so far, these datasets would keep on waiting in vain for the wait time to elapse before being pushed. In this respect, a consistent approach would push the dataset once it is complete regardless of the wait time. The majority of the datasets will be then pushed according to this logic, unless data frames are lost or delayed. In such a case the absolute or relative time logics would take over and push uncompleted datasets once the PDC wait time has elapsed. Such a logic has the main advantage of minimizing the PDC reporting latency, that is reduced to the synchrophasor data latency of the latest received data frame, and enables to increase the time budget allocated for the other functionalities. On the contrary, the main drawback of such an approach is that the data pushing time tp varies based on the data frames arrival time. Hence, the supplied applications should be designed in order to properly cope with non-deterministic datasets arrival. In this respect the easiest solution is to embed dedicated FIFO (First-In-First-Out) data structures in each one of the supplied applications, in order to take care of the nondeterministic synchrophasor data latency (see Fig. 2). V. PDC P ERFORMANCE A SSESSMENT The proposed PDC architecture and the presented data pushing logics have been implemented using LabVIEW and experimentally validated in two different field trials. The first is a PMU installation in the 125 kV sub-transmission network of Lausanne, Switzerland, that adopts a telecommunication infrastructure based on optic fiber links. The second refers to the PMU-based monitoring system of a 10 kV distribution feeder located in Huissen, the Netherlands, that exploits a public 4G LTE wireless network. In both field trials, synchrophasor data are streamed using the UDP protocol, as it represents the recommended protocol to deal with the high reporting rates of PMUs, by sacrificing the data reliability to the traffic speed [22]. In order to characterize the latency contributions highlighted in Fig. 1, in both field trials the PDC was equipped with a GPS receiver providing absolute time information with a resolution of 1 ms, due to the limited precision of the LabVIEW get time function. The data flow was tracked along the whole process by measuring the data frame time-stamps ts , their arrival times ta and the PDC push time tp 5 . The synchrophasor data latency of each data frame and the PDC reporting latency of each timealigned dataset were computed for the various data pushing logics presented in Section IV. In particular, four different data pushing logics were examined over an observation window of 24 hours: 1) absolute time logic (hereafter referred as Logic 1); 2) absolute time integrating push-when-complete logic (hereafter referred as Logic 2); 3) relative time logic (hereafter referred as Logic 3); 4) relative time integrating push-when-complete logic (hereafter referred as Logic 4). 5 It is worth pointing out that a Real-Time Operating System (RTOS) provides more deterministic performance. However, neither of the field trials implemented the PDC on a RTOS.
Line
Bus with PMUs 1
1 km
7
6 2
5 4 3
Fig. 5. Network topology of the SiL 125 kV sub-transmission grid showing the PMUs and PDC locations.
For each field trial, the experimental results are presented by means of three histograms representing the probability density function (PDF) of the following quantities6 : a) the aggregated synchrophasor data latencies from all PMUs; b) the comparison between the PDC reporting latency in Logics 1 and 2; c) the comparison between the PDC reporting latency in Logics 3 and 4. Also, for each data pushing logic, the dataset incompleteness is presented by means of a table showing the percentage of incomplete datasets pushed by the PDC during the 24 hours observation window. In order to properly set the PDC wait time, a preliminary test was performed to measure the characteristic synchrophasor data latencies of both field trials together with their jitter over a time window of 24 hours. This quantity has then been set to guarantee the collection of the majority of the data frames with a particular time-stamp, independently of the adopted data pushing logic. A. Experimental validation in the SiL field trial Services Industriels de Lausanne (SiL), the Distribution Network Operator (DNO) of the city of Lausanne, has deployed a PMU-based advanced and upgradable monitoring system on its 125 kV sub-transmission network that eventually will constitute the backbone of their future SCADA system. The electrical network is composed of 7 electrical substations connected through 15 cabled and overhead lines (see Fig. 5) and has been equipped with 15 PMUs that monitor the current flows and nodal voltages (the number of PMUs installed in each substation is proportional to the number of power lines being monitored). 6 Please recall that the bin width is 1 ms, as dictated by the measurement resolution.
1949-3053 (c) 2016 IEEE. Personal use is permitted, but republication/redistribution requires IEEE permission. See http://www.ieee.org/publications_standards/publications/rights/index.html for more information.
This article has been accepted for publication in a future issue of this journal, but has not been fully edited. Content may change prior to final publication. Citation information: DOI 10.1109/TSG.2016.2622725, IEEE Transactions on Smart Grid 6
30
20 CDF ≤ 99.99 %
PDF [%]
25
15 10 5 0 30
40
50
60
70
80
90
80
90
80
90
Aggregated synchrophasor data latency [ms]
(a) 100
PDF [%]
80
Logic 1 Logic 2
60 40 20 0 30
40
50
60
70
PDC reporting latency - Absolute time logic [ms]
(b) 100 80
PDF [%]
The PMUs are based on the National Instruments Grid Automation System, a programmable CompactRIO platform with PMU capability that meets the IEEE Std. C37.118.12011 measurement requirements for both classes P and M. The PMUs are configured to meet the P-class performance requirements, implementing the synchrophasor estimation algorithm presented in [23] that adopts a 60 ms observation window. They are all streaming with a reporting rate of 50 fps, and characterized by a mean PMU measurement reporting latency of 44 ms. Each PMU is equipped with 8 voltage and 8 current channels, therefore can be connected to maximum 2 threephase (plus neutral) power lines. Depending on the number of lines that are effectively monitored, the total UDP frame size can vary between 134 bytes when streaming a single set of phasors (together with frequency, ROCOF and power values) and 198 bytes when streaming 2 sets of phasors. The PDC is running on a workstation placed in the control room of SiL (see Fig. 5) equipped with an Intel Xeon Processor at 2.4 GHz, 8 GB of RAM and running Windows Server 2008. The PDC supplies a real-time linear state estimator of the sub-transmission grid of Lausanne, a user interface that displays in real-time both the measured and the estimated values and a local database. The telecommunication physical channel is the legacy optical fiber of SiL. Each substation is equipped with a switch connecting the optical fiber and the PMUs through an Ethernet cable. The communication is established through a dedicated Virtual LAN (VLAN). Such a solution, among the available communication technologies for WAMC, represents the favorite one when deploying a synchrophasor network, as it enables to guarantee a fast and reliable data delivery in almost any operating condition and to exploit every feature of the PMU technology. The experimental results are presented in Fig. 6. Both the absolute and relative PDC wait time were set by analyzing the aggregated synchrophasor data latencies from all PMUs measured along an interval of 24 hours, as shown in Fig. 6a. The histogram represents the aggregated data, because an analysis by PMU data stream showed no significant differences among the various PMUs. As it can be noticed, they are characterized by a mean value of 44 ms and standard deviation of 2 ms. Nevertheless, as more than 99.99% of the packets is received with a latency smaller than 60 ms, the absolute PDC wait time Tabs was set to this value. Besides, the average amount of time needed to receive all data frames with specific time-stamp is 3 ms, whereas more than 99.99% of datasets takes less than 20 ms to complete. Hence, the relative PDC wait time Trel was set to 20 ms. The comparison between Logics 1 and 2 (Fig. 6b) shows the improvement introduced by adopting the push-when-complete logic, that enables to reduce the PDC reporting latency by 14 ms. Nevertheless, the latter increases the jitter of the PDC reporting latency that is less deterministic compared to Logic 1 as it is always influenced by the arrival time of the lastreceived data frame with a specific time-stamp. The pushwhen-complete logic also reduces the PDC reporting latencies when adopting a relative time data pushing logic, with an
Logic 3 Logic 4
60 40 20 0 30
40
50
60
70
PDC reporting latency - Relative time logic [ms]
(c) Fig. 6. Experimental results in the SiL field trial showing the PDF of: (a) the combined synchrophasor data latencies; (b) the PDC reporting latency when adopting an absolute time logic (Logic 1) and when integrating it with a push-when-complete logic (Logic 2); c) the PDC reporting latency when adopting a relative time logic (Logic 3) and when integrating it with a pushwhen-complete logic (Logic 4). TABLE I DATASET INCOMPLETENESS WHEN ADOPTING DIFFERENT DATA LOGICS IN THE S I L FIELD - TRIAL .
PUSHING
% of incomplete datasets Missing data frames
Logic 1
Logic 2
Logic 3
Logic 4
1 2 3 >3
2.3·10−5
2.3·10−5
0 6.8·10−5 1.5·10−3
0 6.8·10−5 1.5·10−3
0 0 4.5·10−5 5·10−4
0 0 4.5·10−5 5·10−4
Total
1.6·10−3
1.6·10−3
5.4·10−4
5.4·10−4
average improvement of 15 ms (see Fig. 6c comparing Logics 3 and 4). In such a case the PDC reporting latency jitter is slightly improved by adopting Logic 4 but it is still nondeterministic as in case of Logic 1. Based on the adopted PDC wait time setting (Tabs = 60 ms, Trel = 20 ms), the incompleteness of the time-aligned datasets is presented in Table I. As expected, when transmitting data frames through a dedicated wired telecom infrastructure, the dataset incompleteness is negligible and in the order of few parts per million regardless of the adopted data pushing logic. Nevertheless, occasionally the PMU data frames are simultaneously delayed by a considerable amount of time and
1949-3053 (c) 2016 IEEE. Personal use is permitted, but republication/redistribution requires IEEE permission. See http://www.ieee.org/publications_standards/publications/rights/index.html for more information.
This article has been accepted for publication in a future issue of this journal, but has not been fully edited. Content may change prior to final publication. Citation information: DOI 10.1109/TSG.2016.2622725, IEEE Transactions on Smart Grid 7
do not reach the PDC before the expiration of the absolute PDC wait time. This causes the PDC to push empty datasets in case of Logics 1 and 2, yielding to a total dataset incompleteness that is one order of magnitude higher compared to Logics 3 and 4.
Bus without PMU
Line
Bus with PMU 8
7 1 km 5
6
9
10
11
12
B. Experimental validation in the Alliander field trial Alliander, one of the DNOs of the Netherlands, has deployed, in the framework of the FP7 project C-DAX (Cybersecure DAta and Control Cloud for Power Grids) [24] a PMUbased monitoring system on a medium voltage (10 kV) distribution feeder. The feeder is composed of 1 primary substation and 17 secondary substations supplying the surroundings of the city of Huissen, connected as shown in Fig. 7 by means of underground cables. 10 PMUs, based on the NI CompactRIO platforms have been installed in 10 buses according to Figure 7, and are synchronously streaming synchrophasor data with a reporting rate of 50 fps. One PMU is installed in Bus 1 (primary substation) and measures the phase to ground voltages and the three-phase currents flowing in the feeder. The rest of the PMUs are installed in the secondary substations to measure their phase to ground voltages and their absorbed currents. In both cases the PMUs stream two sets of phasors, together with frequency and ROCOF, for a total UDP frame size of 116 bytes. The PMUs are configured to meet the P performance class by adopting the same synchrophasor estimation algorithm running in the SiL field trial. Nevertheless, the meteorological characterization highlighted a PMU measurement reporting latency of 38 ms that is slightly lower than the SiL case due to the lower number of PMU input channels (3 voltages and 3 currents instead of 8 voltages and 8 currents). PMU data are streamed through a public 4G LTE network, provided by the local service provider Vodafone, to a PDC running in the Alliander data center in Haarlem (see Fig. 7). The PDC supplies a real-time linear state estimator, a monitoring user interface and a local database. It is integrated in a Linux RedHat server equipped with an Intel Xeon CPU at 2.00 GHz and 64 GB of RAM that supplies a real-time state estimation process used to monitor the nodal voltage and line power flow variations of the feeder. In order to support the PMU data stream, each PMU has been connected to dedicated 4G routers from Garderos [25] through the CompactRIO Ethernet switched interface. The Wide Area Network (WAN) interface of the routers connects to the Vodafone network through a dedicated IP address range without any specific service level implemented, so that the PMU traffic is not prioritized. The advantages of such a wireless solution are its high availability, its cost-effectiveness and its easy deployment. Nevertheless, the main drawback is that the latency depends on the real-time availability of the wireless physical mean and on the instantaneous network load, which leads, as it will be demonstrated later, to shortterm variations of the network latency and eventual data incompleteness or packet reordering. Fig. 8 shows the experimental results. Similarly to what stated previously, both the absolute and relative PDC wait
13
14 16 15
17 18
4
3
Haarlem Huissen
2
1
Fig. 7. Network topology of the Alliander 10 kV feeder showing the PMUs and PDC locations.
times have been set according to the measured synchrophasor data latencies shown in Fig. 8a. As it can be noticed, by adopting a 4G telecom infrastructure, the measured synchrophasor data latency shows a bimodal distribution characterized by a mean value of 70 ms that, as expected, is higher than the SiL case. The same distribution can be observed by analyzing each PMU data stream separately. Such a behavior could be attributed to the varying conditions of the wireless medium (e.g., interference, noise, congestion, etc.) across the duration of the measurement. However, as the public 4G network operator did not provide any additional detail on the network topology and data traffic, a deeper investigation was not possible. Moreover, the measured distribution highlights a behavior that is typical of 4G LTE networks, that is the presence of several outliers scattered through time and through PMU data stream, characterized by a synchrophasor data latency up to 1 second (not visible in Fig. 8a). For this reason, the absolute PDC wait time has been set to 100 ms, as a trade-off between the lowest achievable PDC reporting latency and an acceptable dataset completeness. In particular, before this time, more than
1949-3053 (c) 2016 IEEE. Personal use is permitted, but republication/redistribution requires IEEE permission. See http://www.ieee.org/publications_standards/publications/rights/index.html for more information.
This article has been accepted for publication in a future issue of this journal, but has not been fully edited. Content may change prior to final publication. Citation information: DOI 10.1109/TSG.2016.2622725, IEEE Transactions on Smart Grid 8
12
8
CDF ≤ 99.84 %
PDF [%]
10
6 4 2 0 50
60
70
80
90
100
110
100
110
Aggregated synchrophasor data latency [ms]
(a) 100
PDF [%]
80
Logic 1 Logic 2
60 40 20 0 50
60
70
80
90
VI. C ONCLUSIONS
PDC reporting latency - Absolute time logic [ms]
(b) 100
PDF [%]
80
Logic 3 Logic 4
60 40 20 0 50
60
70
80
90
PDC reporting latency that, in such a case is highly affected by the real-time variation of the 4G network latency. Looking at the same Figures it is also evident how the only logic that guarantees a certain determinism in the PDC reporting latency is Logic 1 as it is the only one that is not influenced by the data frame arrival times. Finally, the dataset incompleteness is presented in Table II. Compared to the SiL case, the 4G network performance, and particularly its latency variations, considerably affect the dataset completeness that is strongly influenced by the choice of the absolute and relative PDC wait time. In particular, based on the adopted PDC wait time settings, (Tabs = 100 ms, Trel = 40 ms), the reported cumulative data incompleteness is around 1.4% in the case of Logics 1 and 2 and around 1.2% in the case of Logics 3 and 4.
100
110
PDC reporting latency - Relative time logic [ms]
(c) Fig. 8. Experimental results in Alliander field trial: a) PDF of the aggregated synchrophasor data latencies from the 10 PMUs; b) PDF of the PDC reporting latency when adopting an absolute time logic alone (Logic 1) and when integrating the push-when-complete logic (Logic 2); c) PDF of the PDC reporting latency when adopting a relative time logic alone (Logic 3) and when integrating the push-when-complete logic (Logic 4).
TABLE II DATASET INCOMPLETENESS WHEN ADOPTING DIFFERENT DATA LOGICS IN THE A LLIANDER FIELD - TRIAL .
PUSHING
% of incomplete datasets Missing data frames
Logic 1
Logic 2
Logic 3
Logic 4
1 2 3 >3
1.295 0.027 0.009 0.042
1.295 0.027 0.009 0.042
1.193 0.018 0.005 0.013
1.192 0.018 0.005 0.013
Total
1.372
1.372
1.229
1.229
99.84% of data frames are received at the PDC, which is acceptable for the supplied applications, whereas augmenting the threshold up to 1 second would not bring a significant improvement. Besides, the average amount of time needed to receive all data frames with specific time-stamp is 22 ms, and more than 98.91% of datasets are completed within 40 ms. Hence, the relative PDC wait time Trel was set to 40 ms. The improvements introduced by adopting the push-whencomplete logic are visible for both absolute and relative time logics. In particular, Figures 8b and 8c show an average reduction of the PDC reporting latency of 18 and 19 ms respectively. This comes at the price of a higher jitter of the
This paper has presented the architecture of a PDC that integrates both the absolute and relative time data pushing logics together with a third one that enables to minimize the PDC latency without decreasing the data completeness. We have then experimentally assessed the performance of the developed PDC and related logics within the context of two real PMU installations that adopt different communication infrastructures. The first one is based on optical fiber links; the second one on a wireless 4G LTE public network. The assessment of the PDC performance has quantified the influence of the adopted telecom infrastructure and PDC data pushing logic on the achievable PDC reporting latency. In particular the experimental validation has demonstrated that the push-when-complete logic is characterized by the lowest PDC latency, that is only influenced by the synchrophasor data latency: in the case of optical fiber links the PDC latency is on average 3 ms, whereas in the case of a 4G network, this value increases to 12 ms. Nevertheless, the latency reduction introduced by this logic involves a reduced determinism of the outgoing PDC data flow. As a consequence, in order to correctly operate, this logic has to be properly coupled with dedicated FIFO structures to mitigate the variations in the PDC reporting latency. On the contrary, the only logic that, independently of the network characteristics, is capable of guaranteeing a constant PDC reporting latency and the consequent mitigation of the synchrophasor data latency variations is the absolute one. In such a case, the PDC reports time-aligned datasets at a constant reporting rate (corresponding to the PMU one) with a PDC reporting latency that is fixed and coincides with the absolute PDC wait time. In such a case, the average PDC latency is 16 ms in the case of optical fiber links and 30 ms in the case of 4G network. Finally, the paper has discussed the importance of properly selecting the PDC wait time that has demonstrated to influence both the PDC reporting latency and the dataset completeness. The latter, particularly in the case of non-deterministic networks, might be degraded up to values that do not enable to exploit any longer the availability of synchrophasor data. More specifically, regardless of the adopted data pushing logic,
1949-3053 (c) 2016 IEEE. Personal use is permitted, but republication/redistribution requires IEEE permission. See http://www.ieee.org/publications_standards/publications/rights/index.html for more information.
This article has been accepted for publication in a future issue of this journal, but has not been fully edited. Content may change prior to final publication. Citation information: DOI 10.1109/TSG.2016.2622725, IEEE Transactions on Smart Grid 9
in the case of optical fiber links the the cumulative dataset incompleteness is in the order of few parts per million, whereas in the case of 4G network is in the order of 1%. R EFERENCES [1] “IEEE guide for phasor data concentrator requirements for power system protection, control, and monitoring,” IEEE Std C37.244-2013, pp. 1–65, May 2013. [2] “IEEE standard for synchrophasor measurements for power systems,” IEEE Std C37.118.1-2011 (Revision of IEEE Std C37.118-2005), pp. 1–61, Dec 2011. [3] L. Zhang, A. Bose, A. Jampala, V. Madani, and J. Giri, “Design, testing, and implementation of a linear state estimator in a real power system,” IEEE Transactions on Smart Grid, vol. PP, no. 99, pp. 1–8, 2016. [4] J.-A. Jiang, J.-Z. Yang, Y.-H. Lin, C.-W. Liu, and J.-C. Ma, “An adaptive PMU based fault detection/location technique for transmission lines. I. theory and algorithms,” IEEE Transactions on Power Delivery, vol. 15, no. 2, pp. 486–493, Apr 2000. [5] M. Adamiak, M. Kanabar, J. Rodriquez, and M. Zadeh, “Design and implementation of a synchrophasor data concentrator,” in IEEE PES Conference on Innovative Smart Grid Technologies - Middle East (ISGT Middle East), 2011, Dec 2011, pp. 1–5. [6] M. Kanabar, M. Adamiak, and J. Rodrigues, “Optimizing wide area measurement system architectures with advancements in phasor data concentrators (PDCs),” in IEEE Power and Energy Society General Meeting (PES), 2013, July 2013, pp. 1–5. [7] Y. Guan, M. Kezunovic, A. Sprintson, and M. Yan, “Verifying interoperability and application performance of PDCs in synchrophasor system solution,” in North American Power Symposium (NAPS), 2012, Sept 2012, pp. 1–6. [8] H. Retty, J. Delport, and V. Centeno, “Development of tests and procedures for evaluating phasor data concentrators,” in IEEE Grenoble PowerTech (POWERTECH), 2013, June 2013, pp. 1–5. [9] A. Armenia and J. H. Chow, “A flexible phasor data concentrator design leveraging existing software technologies,” IEEE Transactions on Smart Grid, vol. 1, no. 1, pp. 73–81, June 2010. [10] M. He and J. Zhang, “Deadline-aware concentration of synchrophasor data: An optimal stopping approach,” in IEEE International Conference on Smart Grid Communications (SmartGridComm), 2014, Nov 2014, pp. 296–301. [11] K. Zhu, M. Chenine, L. Nordstr¨om, S. Holmstr¨om, and G. Ericsson, “Design requirements of wide-area damping systems - using empirical data from a utility IP network,” IEEE Transactions on Smart Grid, vol. 5, no. 2, pp. 829–838, March 2014. [12] K. Zhu, S. Rahimi, L. Nordstr¨om, and B. Zhang, “Design phasor data concentrator as adaptive delay buffer for wide-area damping control,” Electric Power Systems Research, vol. 127, pp. 22 – 31, 2015. [13] M. Chenine and L. Nordstr¨om, “Investigation of communication delays and data incompleteness in multi-PMU wide area monitoring and control systems,” in International Conference on Electric Power and Energy Conversion Systems, 2009. EPECS ’09., Nov 2009, pp. 1–6. [14] A. Phadke and J. Thorp, “Communication needs for wide area measurement applications,” in 5th International Conference on Critical Infrastructure (CRIS), 2010, Sept 2010, pp. 1–7. [15] M. Pignati, L. Zanni, P. Romano, R. Cherkaoui, and M. Paolone, “Fault detection and faulted line identification in active distribution networks using synchrophasors-based real-time state estimation,” IEEE Transactions on Power Delivery, 2016, to be published. [16] T. Van Cutsem and C. Vournas, Voltage stability of electric power systems. Springer Science & Business Media, 1998, vol. 441. [17] B. Min and V. Varadharajan, “Design and analysis of security attacks against critical smart grid infrastructures,” in Engineering of Complex Computer Systems (ICECCS), 2014 19th International Conference on, Aug 2014, pp. 59–68. [18] D. Wei, Y. Lu, M. Jafari, P. M. Skare, and K. Rohde, “Protecting smart grid automation systems against cyberattacks,” IEEE Transactions on Smart Grid, vol. 2, no. 4, pp. 782–795, Dec 2011. [19] “IEEE standard for synchrophasor data transfer for power systems,” IEEE Std C37.118.2-2011 (Revision of IEEE Std C37.118-2005), pp. 1–53, Dec 2011. [20] M. Pignati, L. Zanni, S. Sarri, R. Cherkaoui, J.-Y. Le Boudec, and M. Paolone, “A pre-estimation filtering process of bad data for linear power systems state estimators using PMUs,” in Power Systems Computation Conference (PSCC), 2014, Aug 2014, pp. 1–8.
[21] K. D. Jones, A. Pal, and J. S. Thorp, “Methodology for performing synchrophasor data conditioning and validation,” IEEE Transactions on Power Systems, vol. 30, no. 3, pp. 1121–1130, May 2015. [22] M. Hoefling, F. Heimgaertner, D. Fuchs, M. Menth, P. Romano, T. Tesfay, M. Paolone, J. Adolph, and V. Gronas, “Integration of IEEE C37.118 and publish/subscribe communication,” in IEEE International Conference on Communications (ICC), 2015, June 2015, pp. 764–769. [23] P. Romano and M. Paolone, “Enhanced interpolated-DFT for synchrophasor estimation in FPGAs: Theory, implementation, and validation of a PMU prototype,” IEEE Transactions on Instrumentation and Measurement, vol. 63, no. 12, pp. 2824–2836, Dec 2014. [24] “Cyber-secure data and control cloud for power grids.” [Online]. Available: http://www.cdax.eu/ [25] “R-1300 series industrial-grade routers.” [Online]. Available: https://www.garderos.com/images/publications/Garderos Data Sheet R1300 V2 9 eng.pdf
Asja Derviˇskadi´c (M’15) was born in Sarajevo, Bosnia and Herzegovina, in 1990. She received the B.Sc. and M.Sc. degrees (Hons.) in electrical engineering from the University of Rome “La Sapienza,” Rome, Italy, in 2012 and 2015, respectively. She is currently pursuing the Ph.D. degree with the Distributed Electrical System Laboratory (DESL) of the Swiss Federal Institute of Technology of Lausanne (EPFL), Switzerland. Her research interests include the development of enhanced Phasor Measurements Units (PMUs) for active distribution networks.
Paolo Romano (M’12) is a Postdoctoral fellow at the Distributed Electrical Systems Laboratory (DESL) of the Swiss Federal Institute of Technology of Lausanne (EPFL). He received his BSc and MSc degree (with honors) in electronics engineering from the University of Genova, Italy, in 2008 and 2011 respectively, and his Ph.D. from the Swiss Federal Institute of Technology of Lausanne in 2016. His research interests refer to the synchrophasor area and particularly to the development of advanced Phasor Measurement Units for the real-time monitoring of active distribution networks.
Marco Pignati (M’13) received the B.Sc. and M.Sc. degrees (Hons.) in electrical engineering from the University of Bologna, Italy, in 2009 and 2012, respectively. He is currently pursuing the Ph.D. degree with the Distributed Electrical System Laboratory, Swiss Federal Institute of Technology of Lausanne, Switzerland. His current research interests include real-time monitoring and control of active distribution networks with particular focus on synchrophasor-based applications.
1949-3053 (c) 2016 IEEE. Personal use is permitted, but republication/redistribution requires IEEE permission. See http://www.ieee.org/publications_standards/publications/rights/index.html for more information.
This article has been accepted for publication in a future issue of this journal, but has not been fully edited. Content may change prior to final publication. Citation information: DOI 10.1109/TSG.2016.2622725, IEEE Transactions on Smart Grid 10
Mario Paolone (M’07 - SM’10) received the M.Sc. (Hons.) and Ph.D. degrees in electrical engineering from the University of Bologna, Bologna, Italy, in 1998 and 2002, respectively. In 2005, he was an Assistant Professor in power systems at the University of Bologna, where he was with the Power Systems Laboratory until 2011. In 2010, he received the Associate Professor eligibility from the Politecnico di Milano, Italy. He is currently an Associate Professor at the Swiss Federal Institute of Technology, Lausanne, Switzerland, where he accepted the EOS Holding Chair of the Distributed Electrical Systems Laboratory. He is the Secretary and Member of several IEEE and Cigr´e Working Groups. He was the Co-Chairperson of the Technical Committee of the 9th edition of the International Conference of Power Systems Transients (2009) and of the 19th Power Systems Computation Conference (2016). He is author or coauthor of more than 220 scientific papers published in reviewed journals and international conferences. He is the Editor-in-Chief of the Elsevier journal Sustainable Energy, Grids and Networks and the Head of the Swiss Competence Center for Energy Research “FURIES.” His research interests include power systems with particular reference to real-time monitoring and operation of active distribution networks, integration of distributed energy storage systems, power system protections and power system transients. In 2013, he received the IEEE EMC Society Technical Achievement Award.
1949-3053 (c) 2016 IEEE. Personal use is permitted, but republication/redistribution requires IEEE permission. See http://www.ieee.org/publications_standards/publications/rights/index.html for more information.


![Introduction Camera architecture[1] - Infoscience - EPFL](https://m.moam.info/img/260x300/introduction-camera-architecture1-infoscience-epfl_5c9b11dd097c4718558b4664.jpg)