ReflectWorld: A Distributed Architecture for Meetings and Groups Evolution Analysis Flaviu Roman, Omar Mubin, Pierre Dillenbourg Centre de Recherche et d’Appui pour la Formation et ses Technologies (CRAFT) Ecole Polytechnique Federale de Lausanne (EPFL) Lausanne, Switzerland
[email protected] Abstract — In this paper, we describe the efforts in taking advantage of the latest IT developments, (especially of the development of mobile computing devices such as tablets or phones) to create a comprehensive architecture for face-to-face meetings support and groups evolution analysis. The main purpose of the architecture is to mitigate frequent meetings problems by providing state-of-the-art technological support to groups or teams. This paper introduces ReflectWorld, the distributed architecture created on top of the principles of Reflect Table, a meeting support and analysis system centered on individuals’ participation and interactions.
to the “investment” in the meeting (in terms of time, costs and participants). In the light of these problems of meetings, research effort has been devoted to creating solutions and evaluating their efficiency. From a management perspective meetings have been generally classified into brainstorming, problem solving, decision making, information - presentation, and feedback or progress meetings. For the Human-Computer interaction community, the impact of new technologies has represented the prerequisite for hardware and software developments aimed at creating meeting support systems. Kiesler and Sproull [4] discussed changes in technologies and their possible impact on the way people collaborate and make decisions. Their discussion features the laboratory-tested effects of technology, which in their view does not scale to real life situations. Zigurs and Buckland [5] write about the importance of the task itself in determining the correct fit of a group support system (GSS).
Keywords – Meetings; Distributed System Architecture; Visualization; Group Evolution; Human Computer Interaction.
I.
INTRODUCTION
Nowadays collaborative environments are ubiquitous, present in all types of organizations, research labs, companies, or academic settings. Our line of research follows the background of introducing technology into meetings, evaluating its adoption, utility, creation principles and effects. Certain aspects of meetings, such as balanced participation, agenda management, or in-meeting collaborative work, are key research elements for which we create technological solutions to enable, support, or improve these aspects.
1) Balanced participation One of the widely mentioned causes of lack of meetings aftereffect is the unbalanced participation. Salomon and Globerson [6] studied socio-psychological effects of this concluding that it has a negative effect on teams’ performances. Cohen [7] investigates productivity and learning outcomes in small groups, stating that collaborative exchanges are required for conceptual effectiveness. The prototype we describe in this paper also addresses participation balancing issues.
Therefore we are concerned with researching from meetings problems and meetings solutions, to creation of software or technology that could help ease or diminish the shortcomings or deficiencies in meetings, widely known to lead to reduced efficiency and high costs. A. Related Aspects in Literature The large-scale development of communication has been able to break the space-time barrier of meetings, and part of research in meetings and group decision support systems has evolved to support remote collaborations [1]. However, in our research, we focus only on face-to-face encounters, which are still largely dominant in today’s industrial, corporative, and organizational world [2]. In this paper we will refer thus only to face-to-face meetings.
2) Architectures and Data Visualizations The solutions we propose have inherently a visual part, both in-meeting and for after the meeting. Bringing awareness to the meeting is generally the method employed to make latent information available to the participants. Studies in the area include work by Bergstrom [8], whose time visualization patterns show circular time evolution, but where the colors matching with their corresponding participant is a challenge. Skog et al. [9] also produced a visualization system that projects multiple measured parameters on a vertical space or wall. Architectures for Collaborative Applications are thoroughly discussed by Dewan [10].
Romano and Nunamaker [3] among others have conducted studies in which they analyze quantitatively the problems of meetings and their outcomes. They identify a list of suboptimal practices that lead to poor outcomes with respect
978-1-4673-1382-7/12/$31.00 ©2012 IEEE
389
internet access technologies.
Some interesting post meeting support and data analysis tools have been created and studied by Nijholt [11] and Hunter [12]. In the first case, a smart room contains several types of sensors which capture information, and in the second case, a meeting table acts as a “collective memory” and historical database. Though their solutions are commendable, the confinement in both cases, the privacy issues in the first, and size of such systems in the second make them unpractical and restrictive relative to the current trend of technological development. The lack of supporting software in their system is another limitation.
points
and
wireless
internet
access
To enable the evolution and transition from a localized architecture to a distributed one, we chose to use of a serverclient type of architecture for its simplicity (as opposed to agents architecture), with engines running on remote and heterogeneous devices, and information transferred via wireless networks. The paper is structured as follows: Section II describes the global architecture of the developed system and considerations regarding the choices of this solution. Section III introduces the modules, presenting them individually in more detail, and relates their position in the architecture with respect to their features. Sections IV deals with future developments and studies planned, while Section V synthesizes the conclusions of this research.
B. Rationale of design We have previously designed, constructed, and used the Reflect Table [13]. It was built with the aim to be a mirror of a group interaction, neutral in terms of judging the quality of interaction. Its design principles included unobtrusiveness to avoid distractions from the goal of the meeting, shared semiambient display to integrate information into the table surface and avoid the active seeking of the information by the participants, and a low-resolution display, and doubled with a minimal interactivity with users (Fig. 1).
II.
REFLECT WORLD ARCHITECTURE
A. Premises of the chosen design We are concerned with studying actor interactions in meetings, and have performed several studies with the Reflect Table, obtaining encouraging results in assessing group cohesion, evolution, and roles emerging in new groups. However, location and centralization constraints have a negative impact on the capacity and duration of meeting data analysis. By passing to a distributed solution, we enable not just the use of such a system for everyone (possessing a smart device) but also the quick feedback and analysis of the results.
Nevertheless there are some inherent limitations that arise from its development as interactive furniture. The size and weight confine its use to a single, and the lack of connectivity prevents the automatic distribution of meetings data. The table has no support for in-depth post-meeting analysis; it is only capable of displaying summaries of in-meetings measurements of speech time on its panels of LEDs. The advances of today’s technology towards the omniscience and powerfulness of tablet computers, phones, and user-based devices can eliminate these limitations. Therefore, we propose a solution that shifts the initial, centralized architecture, towards a distributed version, while retaining the key design features and adding extra elements.
The methodology that we plan to follow with this new technology is to equip participants in teams with such devices to support giving immediate feedback about their participation behavior. Enabling the use of such a system outside a specific space can also help participants act more naturally, while more complex feedback about their behavior can help reduce team / task force management times by enabling quick assessment of the teams’ cohesion. What we call the “dematerialization” of the Reflect Table brings about three major challenges: the need to properly and reliably exchange information among modules located on distinct devices, the guarantee of consistency of timestamps of events occurring throughout independent elements, and the scattered as opposed to centralized diarization (detection) of the speaker. We chose to adopt the TCP/IP technology over Wi-Fi or 3G for information exchange, after carefully analyzing its advantages and disadvantages over Bluetooth. In favor of the TCP/IP were several factors, such as easy timestamp synchronization, remote availability of all data (useful, for example, for analysis tools), and easier devices identification for data transfer.
Figure 1. Reflect Table
We leverage the adoption of these devices, and benefit from their availability (both in terms of hardware, and connectivity). The features and “always on” mode of these devices went hand-in-hand with the development and spread of mobile
390
main module for the in-meeting use called ReflectAll records minute-based participation times using speakers’ identification. Finally, compatibility is ensured by a set of conversion tools containing three conversion modules for data format conversion from meetings assisted by the Reflect Table. The software is created such that the required user interaction is kept minimal.
Then, we had to choose between a network broadcastingtype of system (one-to-many) and a centralized-server type of system (one-to-one with the server). The last one was preferred for the capacity of the server to also act as a storage and data manager as well as disseminator, without input or output functionalities. Hence this server needs not be a mobile device, but a PC service (process), which can be optimized for power and speed.
C. Network Protocol and API Several human-readable data interchange protocols (also called data serialization formats) have been defined and standardized on top of network layers, for information exchange, like XML (extended markup language), JSON (JavaScript object notation), or CSV (comma separated values).
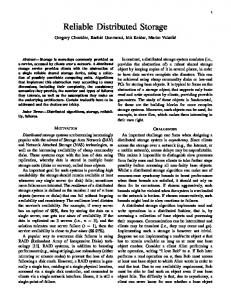
B. System Overview Given the above examinations, we started defining and creating the elements of the architecture. We shaped them so that they would provide full support to meeting analysis, including not only modules for participation detection, but also for participants’ interaction through feedback and tools for scientific analysis of the produced data. This way the Reflect World becomes a full-featured and complete meeting analysis system.
We chose to create our own exchange protocol as a variation of CSV, mainly to minimize data transfer. All the messages exchanged follow a request-response like behavior over TCP sockets. Our messages have the form H|D, where H (header) is a numerical value identifying the type of operation / message / request that is being transmitted. Successful operations respond back with the same ID of the request, while failures place an error-specific value in the header. The D (data) field was designed to accommodate a variety of forms of data, thus has been defined as a matrix of values, with rows and cells separated by a predefined character separator.
The services that the modules of the Reflect World need to provide are storage, information management and distribution, information analysis, feedback exchange with participants, and speaker identification for participation measurement. For backward compatibility we also chose to support conversions from the protocols employed by the Reflect Table. The system also needs to support scaling to allow the integration of future modules or service providers that are not part of the initial design.
III.
MODULES
We present here in greater detail the modules that compose the ReflectWorld. They are heterogeneous, take advantage of the standardizations defined, and therefore were created using the most appropriate technologies for each of them. The components running on PCs are built using Microsoft .net 4.0 and written in C#, while those running on portable devices are created on iOS using objective-c. A. Reflect Server The core of the Reflect World is the Reflect Server. As a backend module, it deals with the most difficult and complex mechanisms: data management mechanisms, storage, distribution and network interfacing. It has been designed as a server, required to run continuously, and thus created as a Windows Service based on .net 4.0 running on Windows and installed on a server PC with a permanent internet connection and a static IP address. This way, the location of the server is known to all the other modules, therefore removing the need for an extra broker component or module to handle the discovery of the server’s address.
Figure 2. Reflect World System Design
The architecture as shown in Fig. 2 is centered on a server component, called ReflectServer, which acts as a storage manager and on-demand data disseminator. It defines the data transfer protocol that is employed by all the modules. The analysis component, called ReflectMeetingAnalyzer, can collect data from the server and perform analysis, generate meeting reports and export data to statistical formats. The feedback component called ReflectYou creates a two-way feedback communication channel with the participants. The
The networking component of the server defines the network protocol described above and declares network codes to be used as headers. It also contains a specific parser for the data, based on the type of message received.
391
can use moving-averaged data on a selectable window, to smoothen / sharpen the curves.
The data component takes care of the data serialization for storage. We decided not to use a mainstream database because of a reduced amount of required storage, for which we considered that a synchronized file system solution is more efficient. The server is also able to detect external changes to the file system and reload the contents if they are changed, thus preserving consistency between the data stored on the disk and the data stored in the server’s memory. The data model is created around the notion of sessions, and the system is required to support multiple parallel such sessions. A session is a model that holds meta-information, such as timestamps, participants, and syntheses (such as numerical values of minute based speech time, intensity, etc.). The participant model contains information about the participant’s ID, color, a list of minute-based speech times and average intensities. A session manager bridges and handles transfers between the received information from the network and the sessions. Similarly, a different manager for feedback is created, which handles feedback communications between the meeting analyzer, the feedback module, and the database.
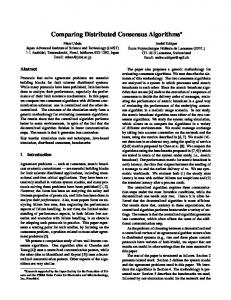
Figure 3. Reflect Meeting Analyzer: Single Meeting
1) Single Meeting This tab shows graphical information about any single meeting (Fig. 3). The information displayed includes individual meeting speech time and voice intensity histograms, participants’ interactions around the table in the form of floor taking, and speech evolution data per participant and as a group.
The kernel of the server module is built around an asynchronous TCP listener, which accepts connections and passes on messages to parallel threads to process the received code, communicates with the database, performs the requested operations, and sends back an adequate reply. An asynchronous solution was necessary to enable parallelization of connections, as well as to improve response times for bulk requests. The information transferred is then synchronized at the memory level and serialized. After several cycles of tests and refinements, our server proved robust enough to be able to deal with approximately 2000 connections at any one instant, without destabilizations and impact on the response times. We consider this figure to be large enough for any use case of the Reflect World modules. The robustness of the server has been boosted by creating the Windows Service in such a way that it supports restarting and complete previous state restoration upon crashes, although no crashes have been formally reported since an early stage of development.
The individual graph plot helps to identify sudden changes in participation time. We acknowledge this as a form of behavioral adjustment, or a change in the agenda or plan which prompts a steady floor transfer to a different participant. The group evolution is useful to segment and analyze meeting phases. Certain aspects, such as the sudden drop in the group speech at a specific moment could indicate, for example, the exhaustion of a discussion subject, as well as high values could indicate moments of tension or high effervescence of many participants. The table interactions graphic (or speech turns) shows the interactivity of pairs of participants, using a white-black gradient, where black shows more interactivity. This is not necessarily correlated to the total speech time, as some participants could be monopolizing the floor without being interrupted or generating utterances in reply from others.
B. Reflect Meeting Analyzer and Report The analysis module acts both as a frontend to the Reflect World, and a feature extractor. It can be used remotely by meeting facilitators, and even by participants themselves. The tool connects to the server and downloads the list of all existing completed meetings. Then, a selection tool allows the user to download all the information about chosen meetings, employing filters by Groups or Sessions. A second communication with the server downloads the information for the selected meetings, and processes them. Then, the software contains a series of visual tabs (Fig. 3.), which enable different types of visual analysis. Throughout all these visualization modes, the user can copy or save any of the individual or full screen images generated. Also, some plots
Figure 4. Side by Side Meetings Visualization
392
2) Side by side comparison This tab shows side-by-side comparisons of any two selected meetings (Fig. 4). A central control can choose which feature to be displayed (speech histogram, individual evolution, group evolution, or turn takings). Scales are normalized on the y axis for the comparison to be meaningful. This mode is useful when comparing selected sessions of one group, or for any comparison involving different conditions for two meetings.
Figure 6. Sessions Report
The last tab is a distribution / integration engine, which captures all the measurable parameters of the system and places them as variables for statistical analysis, by creating associated columns. Each row is then filled in with the data from each meeting. The table created can be exported to various formats like CSV, XLS, or formats for statistical tools like R or SPSS.
3) Multiple Meetings A third visual tab supports analysis of group evolution. This is the most important visualization because it enables qualitative assessment of the group dynamics over an extended period of time. The user can filter on the downloaded meetings by group or session. Plot options are similar to the side-byside meetings (e.g. evolution or general overview – Fig. 5). The engine automatically splits the list of meetings by a vertical bar.
C. ReflectYou It is acknowledged that manually collecting feedback through questionnaires is a tiresome job for scientists. Moreover, when the feedback is voluntary, a second problem arises: the time and energy required to fill in a meaningful questionnaire might be too high, thus yielding insufficient motivation for the subjects to make such efforts, resulting in scarce or inconsistent feedback. Online questionnaires like Google Spreadsheet Forms, questionpro, surveymonkey, or even solutions internal to individual organizations have addressed this issue up to a certain point, reducing the time required both for the respondent to fill in his answers, and for the scientist to collect and format the data. However, an important limitation still remains: they are mainly aimed at PCs and require users to know how to access the survey locations. We came up with a solution that solves both the problems: ReflectYou, a universal iPhone/iPad application (Fig. 7). We devised a framework that supports dedicated feedback for our studies. The application connects to the server, downloads a session and group based questionnaire, and the participant is only required to pick his answer and optionally type his comments. This way, the application offers fast access to questionnaires on portable devices, reduced effort requirements and direct storage of feedback on the server, which compensate very well for the higher degree of generality offered by online survey platforms.
Figure 5. Multiple Meetings Visualization
4) Report, Summary of Feedback and Statistics A preview screen was created in the report tab for an exportable graphical PDF report of a chosen single meeting (Fig. 6). The first page shows the graphics for the selected meeting, and the second page contains the 4 most important categories of data available in the multiple meetings tab. The report can be saved to disk and sent as an email attachment directly from the interface. Another tab manages the summary of feedback received through the ReflectYou module.
To make the module as flexible as possible, we created a questionnaire management routine on the server, which is able to provide the questions and choice answers to this application upon connection. For this, we designed 2 types of feedback (simple text and internet links), 2 types of questions (with single and multiple choices – all mandatory), and one type of open text, or comments. This design was aimed at controlling the content of the questionnaire from the server, so that the user would never have to install updates to the application.
The user selects a meeting and a question asked in that meeting, and the system downloads the answers data and plots a bar chart of the frequency of choice of each answer to that question. This makes it easy to integrate the answers into presentation or statistical analysis.
393
mechanism based on proximity, by gathering the intensity (dB) levels from all devices and doing a server-side comparison to determine the speaker. The technique proved not to be robust enough in tests, with a reliability factor not exceeding about 70%. Problems arise due to the microphones positioning, and participants’ movements with respect to the microphone direction. On iPads, which are our main target, the problems are augmented by the position of the microphone (on top instead of bottom, and right on landscape-working mode).
The questionnaire is thus generated on the server and sent to the application upon its request from the user. The application automatically builds its own interface with questioncorresponding controls based on the feedback elements it receives. Then, the user’s answers are sent back to the server, which keeps their counter.
Therefore we opted to employ a local calibration-based speaker identification system. The user calibrates the system by reading a short text. A voice fingerprint is saved on the device as a synthesis of the voice spectrum, which is checked against chunks of speech obtained during the meeting conversation. A threshold in the decibels levels is used to remove ambient noise. This method is more reliable and offers the participants the most freedom to position themselves with respect to the location of their device’s microphone. In the initial tests, this solution, though more computationally expensive for the mobile device, proves more reliable. The numerical values of the speech times measured this way are sent to the server. 3) Operation Because one of the most important features of the Reflect World is to enable parallel (concurrent) meetings, this software is required to employ a login system. When starting a meeting, one of the participants will create a session, being asked for his group name and a session number, which will be seen by other participants in a list of online sessions to join (Fig. 8).
Figure 7. ReflectYou on iPhone
D. ReflectAll The key module of the architecture is the universal iPad/iPhone application equivalent version of the Reflect Table itself. This module is used in the meetings by participants possessing iPads or iPhones, and is the main source of data production. 1) Consistency of data The first main challenge of the system is the fact that using multiple and heterogeneous devices might not guarantee consistency of timestamps (because devices internal clocks cannot be assumed to be synchronized). Therefore we were required to synchronize all timed operations, and the technique used was to adjust every device’s event with the time span between the server’s and the device’s clocks, centralizing all operations with the server’s timestamp. The devices store this span after polling for the server’s timestamp and measuring the communication delay, after which the span is set at the moment which is half way through this delay.
Figure 8. ReflectAll iPhone: Main Screen and Login
The participant needs to choose a color, which will remain stored on his device for future meetings. After logging in, the application computes the numerical values of speech time of the participant and the intensity, which are transmitted at a timed interval to the server. It also asks the server for the summary values and statuses of each participant. A pie is
2) Speaker Identification The second challenge is detecting how much each participant was speaking (which translates to determining the identity of the speaker). At first we used a speaker detection
394
operations if necessary), then creates a meeting session and sends it as an archive to the server, who stores it along the other finished sessions. All data contains numerical speech time values only.
created showing the ratios of the total participation (on both device types) plus short-term participation and voice intensity (on iPad only, Fig. 9.). 4) Meeting Status For awareness reasons, an “idle” mechanism has been employed, which marks a participant as idle if a participant is registered within the meeting but fails to communicate with the server after some interval. Then, the non-idle participants are notified about the idle participants. Similarly, if a participant does not receive data for some time, a dimming effect is employed on his graphics to show that the information displayed is not up to date any more. The system responds to possible errors by notifying the participant of ways to solve them. For example, if a participant who selected the same color is already in the meeting, the system will provide a notification asking him to select a different color.
IV.
FUTURE
The system will be used in recurrent meetings of groups having the same participants, each of them possessing his/her own iPhone or iPad. We will evaluate in-meeting participation, after-meeting debriefing of the results and group evolution. Our post-meetings interactivity with the participants is expected to grow compared to the Reflect Table studies. The type of studies we can address range from controlled, academic meetings, to real world organizational environments of managers’ meetings. Among the new features we plan to add is the detection of location of participants, which enables them to login easier into a meeting. Another new feature will be to enable users to access their historical data on their device, by means of a lite mobile version of the Meeting Analyzer. V.
CONCLUSIONS
We presented a novel distributed architecture for meetings and groups support and participation assessment. The main contributions lie in the process of leveraging state-of-the-art mobile devices and distributed information-exchange architectures, to deploy personalized technology for meetings support. We’ve also bundled powerful analysis tools and fast feedback engines that aim to deliver a full-fledged meeting support and analysis system. The flexibility, openness and adaptability of it make it easy to integrate new processes, share data, and interact with the participants. Heterogeneous modules are created to supply specific services, and they are integrated through the means of a standardized data transfer protocol, employed by each module.
Figure 9. ReflectAll iPad: Speech Display
By enabling easy data dissemination, the results can be easily distributed to participants and facilitators, who can access information and insight about their meeting behaviors anytime and anywhere. Also, by means of the feedback module, each participant can directly communicate to the facilitator or meeting managers to exchange feedback about the meetings or tools.
E. Conversion Tools To ensure compatibility and to continue to benefit from the data generated by meetings held with the Reflect Table, a collection of conversion tools from the Reflect Table logs protocol to the new format has been created. The first one targets possible errors in the speaker detection based on the centralized system of 3 microphones [13]. When the meeting attendance is less than 6 participants, infrequent errors in the estimation of the sound direction with respect to the seats may lead to sparse detection of sound from a direction of an empty seat. The module parses the Reflect Table data and eliminates any trace of non-existent participants. Secondly, we use a tool to converts the existing timestamps into ordered array values, supported by the Reflect World format. Finally, the engine that performs the conversion of the formats was created. It parses the Reflect Table data (adjusted with previous two
ACKNOWLEDGMENT We are strongly indebted to Banque Privée Edmond de Rothschild, Geneva, Switzerland, member of the Edmond de Rothschild Group, for the sponsorship and support of our research.
395
[7]
REFERENCES [1]
[2]
[3]
[4]
[5]
[6]
A. R. Dennis, J. F. George, L. M. Jessup, J. F. Nunamaker, Jr. and D. R. Vogel. “Information Technology to Support Electronic Meetings”. MIS Quarterly, Vol. 12, No. 4 (Dec., 1988), pp. 591-624 C. W. Scott, L. R. Shanock, and S. G. Rogelberg. “Meetings at Work: Advancing the Theory and Practice of Meetings”. Small Group Research, Nov. 2011. N. Romano Jr. and J. Nunamaker Jr. “Meeting analysis: Findings from research and practice”. In Proceedings of the 34th Annual Hawaii International Conference on System Sciences ( HICSS-34)-Volume 1 Volume 1, HICSS ’01, pages 1072–, Washington, DC, USA, 2001. IEEE Computer Society. S. Kiesler, L. Sproull. “Group decision making and communication technology”. In Organizational Behavior and Human Decision Processes, Vol. 52, Issue 1, June 1992, pg. 96-123. I. Zigurs and B. K. Buckland. “A Theory of Task/Technology Fit and Group Support Systems Effectiveness”. MIS Quarterly, Vol. 22, No. 3 (Sep., 1998), pp. 313-334. G. Salomon and T. Globerson. “When teams do not function the way they ought to”. 1989.
[8]
[9]
[10]
[11]
[12]
[13]
396
E. G. Cohen. “Restructuring the classroom: Conditions for productive small groups”. Review of Educational Research, 64(1):1–35, Spring 1994. T. Bergstrom, and K. Karahalios. “Conversation Clock: Visualizing audio patterns in co-located groups”, In Proceedings of the 40th Annual Hawaii International Conference on System Sciences, HICSS '07, 2007, pg. 78-. T. Skog, S. Ljungblad, L. E. Holmquist, “Between Aesthetics and Utility: Designing Ambient Information Visualizations” In Proceedings of InfoVis 2003 IEEE, 2003, pg. 233 – 240 P. Dewan. “Architectures for Collaborative Applications”. In Trends in Software, special issue on Computer Supported Cooperative Work, 1998, 7:169-194. A. Nijholt, R. Rienks, and D. Reidsma. “Online and offline visualization of meeting information and meeting support. The visual computer”, 2006. S. Hunter, P. Maes, S. Scott, H. Kaufman. “MemTable: an integrated system for capture and recall of shared histories in group workspaces”, In Proceedings of the 2011 annual conference on Human factors in computing systems, CHI '11, 2011, pg. 3305-3314. K. Bachour. “Augmenting Face-to-Face Collaboration with LowResolution Semi-Ambient Feedback”. PhD thesis, EPFL, Lausanne, 2010.