CI
Cancer Imaging (2005) 5, 11–16 DOI: 10.1102/1470-7330.2005.0016
ARTICLE Computer-aided detection for virtual colonoscopy James J Perumpillichira∗ , Hiroyuki Yoshida† and Dushyant V Sahani∗ ∗ Department
of Radiology, Massachusetts General Hospital, Boston, MA 02114, USA; Radiology, The University of Chicago, Chicago, IL 60637, USA
† Department
of
Corresponding address: James Perumpillichira, Assistant Professor, Department of Radiology, Wake Forest University Baptist Medical Center, Medical Center Blvd, Winston-Salem, NC 27157, USA E-mail:
[email protected] Date accepted for publication 5 April 2005 Abstract Colon cancer is one of the leading causes of cancer deaths in the developed countries. Most colon cancers can be prevented if precursor colon polyps are detected and removed. Virtual colonoscopy, or CT colonography, has shown promise to be the future screening tool for polyp detection, with a number of studies performed at academic institutions showing high sensitivity and specificity. Two main factors limiting CT colonography in general use are its excessive interpretation time and the variable sensitivity among readers. This article discusses the potential of computer-aided detection to address these problems. We also review the current state of research in this field and the future roles and challenges of CAD for CT colonography. Keywords: Colon CT; colon neoplasms; diagnosis; computers; diagnostic aid.
Introduction The American Cancer Society has estimated that approximately 147 500 new cases of colorectal cancer and 57 100 deaths from the disease occurred in 2003 [1] . Colon cancer is also the second leading cause of cancer-related deaths in the United States [1,2] . Most colorectal cancers arise from benign adenomatous polyps over a course of several years [3] . Detection and removal of adenomas have been shown to reduce the incidence of colorectal cancer and of mortality due to this disease [4,5] . Recent studies have shown that CT colonography (CTC) is a robust technique for the detection of colorectal polyps greater than 1 cm in diameter and of cancers in screening as well as in symptomatic patient populations [6–8] (Fig. 1). Currently, a typical CTC data set contains 500–1600 images. Therefore, the interpretation of CTC can be timeconsuming, requiring up to 30 min [6,9,10] . A potential pitfall of having a large number of images to review and a long interpretation time is that it can lead to fatigue, misdiagnosis, and limited throughput. This can reduce the utility of the CTC examination as a screening test.
Another limitation that can impede the use of CTC as a screening tool is large interobserver variability, with one study reporting 25% interobserver variability among four radiologists who detected polyps greater than or equal to 10 mm in size [11,12] . These limitations of CTC provide an impetus for the development of computer-aided detection (CAD) [16,20,24,26] . CAD has the potential to reduce radiologists’ interpretation time and to decrease interobserver variability. Currently, no commercial CAD system is available, although such a system is expected to appear on the market soon. Therefore, in the following sections, we review the current state of the prototype research systems, their performance in the detection of polyps and masses, and the future roles and challenges of CAD for CTC.
Computer-aided detection algorithm Most of the CAD systems developed as research prototypes employ the following four main steps: (1)
This paper is available online at http://www.cancerimaging.org. In the event of a change in the URL address, please use the DOI provided to locate the paper.
1470-7330/05/010011 + 06
c 2005 International Cancer Imaging Society
12
J J Perumpillichira et al. (a)
(b)
(c)
Figure 1 Ten millimeter polyp detected on CTC, which was missed on an initial colonoscopy. This lesion turned out to be a 10 mm adenocarcinoma confirmed by sigmoidoscopy done at a later date. (a) Axial prone view in lung window setting showing the 10 mm polyp (yellow arrow). (b) Endoluminal view showing the same polyp. (c) Same polyp as seen on sigmoidoscopy. extraction of the colonic wall; (2) detection of polyp candidates; (3) reduction of false-positive candidates; (4) display of detected polyps.
Extraction of the colon Most of the fully automated methods for extraction of the colon use the contrast of the CT values between the colonic wall and the air in the colonic lumen for the extraction task [13–15,17,18] . Typically, in the first step, an isotropic volume is reconstructed by interpolation of the axial CT images in a CTC data set. Then thresholding is applied to the isotropic volume, based on the CT values characteristic of the colonic wall, for extraction of most parts of the colonic wall, followed by a regiongrowing method for extraction of the complete colonic wall. A method called knowledge-guided segmentation further makes use of anatomic knowledge of the colon for efficient extraction of the colonic wall, including collapsed regions; as a result, approximately 98% of the entire colon can be extracted [18] . Methods for reducing the amounts of extra-colonic structures that are erroneously extracted along with the colon have been proposed [19] ; these methods reduce the extra-colonic structures to 1% of the entire extracted colon.
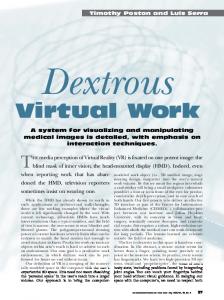
Detection of polyp candidates After the colonic wall is extracted, polyp candidates are detected by extraction of geometric features that characterize polyps at each point in the colonic wall. In general, polyps tend to appear as bulbous, caplike structures adhering to the colonic wall, whereas folds appear as elongated, ridge-like structures. The colonic wall appears as a large, nearly flat, cup-like structure. Methods for detection of polyps need to characterize these shape differences among polyps, folds, and the colonic wall. To this end, various methods have been developed, including use of a volumetric
shape index and curvedness [20] , surface curvature with a rule-based filter [16] , surface normal overlap [21] , and sphere fitting [22] , each of which has been shown to be effective in the detection of polyps. For example, the volumetric shape index analyzes the vicinity of a voxel and determines to which of the following five topologic classes a voxel belongs: cup, rut, saddle, ridge, or cap [20] (Fig. 2). A region representing the highest shape index values corresponds to a cap-like shape, and thus the region is detected as a polyp candidate.
Reduction of false-positive candidates Typically, the polyp candidates thus detected include a large number of false positives. Studies showed that prominent folds and stool are major sources of false positives in CAD [23,24] . Various methods characterizing false positives have been developed for reduction of their number. These methods include texture analysis and gradient concentration [25] , CT attenuation [26] , random orthogonal shape section [27] , and optical flow [28] . Differentiation of folds is based on the difference in appearance between polyps and folds with folds generally appearing to be much more elongated objects [24,28] . Differentiation of stool is based on the difference in internal density variations between polyps and stool. Stool often has an inhomogeneous textural pattern, or mottle pattern, due to fat and air bubbles. Therefore, use of texture analysis that characterizes the homogeneity of the CT density is effective in characterizing stool [25] . The final detected polyps are obtained by application of a statistical classifier, which is based on the image features extracted in the previous steps, to the differentiation of polyps from false positives. To this end, investigators use parametric classifiers such as quadratic discriminant analysis [20,28] , as well as non-parametric classifiers such as neural networks [22,29,30] and a support vector machine [27] . These classifiers generate a decision boundary that optimally partitions the feature space into a polyp class and a false-positive class based on supervised
Computer-aided detection for virtual colonoscopy learning. Those candidates that belong to the polyp class are reported as polyps detected by CAD.
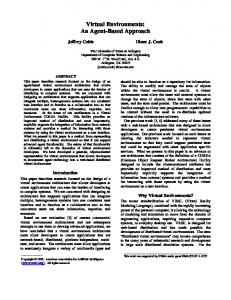
Display of detected polyps The polyps detected by CAD are displayed on a workstation for visualization and navigation of CTC data, so that the CAD output is integrated into 2D multiplanar reconstruction views and 3D endoluminal views of the colon. The display mode can be a simple marker such as a circle on a 2D axial image or an arrow in 3D views, which indicates the location of a detected polyp. The display mode can also use an elaborate system of colorcoding of the detected polyps and of normal structures such as folds (Fig. 3). In Fig. 3, detected polyps are shown as a list of icons on the right margin of the screen. By clicking on one of the icons, radiologists can jump to the corresponding polyp on the 2D and 3D views for easy examination of the location and the shape of the polyp.
Figure 2 Detection of polyps by extraction of geometric features. Polyps tend to appear as bulbous, cap-like structures adhering to the colonic wall, whereas folds appear as elongated, ridge-like structures. The colonic wall appears as a large, nearly flat, cup-like structure. The volumetric shape index determines the shape in the vicinity of each voxel, and determines to which of the five topologic classes the voxel belongs: ‘cup’, ‘rut’, ‘saddle’, ‘ridge’, or ‘cap’; therefore, a high value of the volumetric shape index that is close to 1.0 indicates whether a polyp-like structure is located.
for polyps ranging from 5 to 25 mm in diameter in 72 patients, with 1.3 false positives per patient [31] . A CAD scheme developed at the National Institutes of Health by Summers et al. yielded an 83% by-polyp sensitivity for polyps ranging from 5 to 25 mm in diameter in 40 patients, with 2.9 false positives per patient [29] . A CAD scheme developed at the University Hospital Gasthuisberg, Belgium, by Kiss et al. yielded 100% bypolyp sensitivity for polyps greater than 10 mm in size in 18 patients, with 8 false positives per patient [22] . A CAD scheme developed at Stanford University by Paik et al. had 100% by-polyp sensitivity for polyps greater than 10 mm in size in 8 patients, with 7 false positives per patient [21] (Table 1). The results of the above studies indicate that CAD had a performance comparable with that of human readers in detecting polyps [6–8] .
Figure 3 Example of a display mode of the polyps detected by CAD. The upper-left, lower-left, lowerright images show the 2D multiplanar reconstruction (MPR) views of the colon. The upper-right image shows a 3D endoluminal view of the colon. CAD output is integrated into the 2D MPR and 3D endoluminal views by use of the coloring scheme that delineates the detected polyps and the normal structures in the colonic lumen (see Fig. 2). Detected polyps are shown as a list of icons on the right margin of the screen and are color coded in green. By clicking on one of the icons, radiologists can jump to the corresponding polyp on the 2D and 3D views for easy examination of the location and shape of the polyp.
Table 1
Performance of CAD in CT colonography Several academic institutions have conducted clinical evaluation of CAD in the detection of polyps in CTC cases. Among published studies, a CAD scheme developed at the University of Chicago by Yoshida et al. yielded a 100% by-patient and 95% by-polyp sensitivity
13
Summary of CAD performance
CAD scheme
No. of cases
Sensitivity (%) per polyp (polyp size (mm))
No. of false positives per patient
University of Chicago [31]
72
95 (5–25)
1.3
NIH, Betheseda [29]
40
83 (5–25)
2.9
University Hospital Gasthuisberg, Belg [22]
18
100 (>10)
8
Stanford University [21]
8
100 (>10)
7
14
J J Perumpillichira et al.
Another role of CAD is the detection of colorectal masses. A CAD scheme developed at the University of Chicago detected 13 of 14 masses in 82 patients, with 0.21 false positives per patient. The detection of masses did not affect the performance of polyp detection [32] . Because CAD is designed as a detection aid for radiologists, it is imperative that the use of CAD leads to improved sensitivity and specificity of radiologists without substantially increasing, or even with decreasing, their reading time. A study by Mani et al. [33] evaluated the performance of three radiologists reading 41 CTC studies with and without CAD. Readers without CAD detected 63% of polyps greater than or equal to 10 mm in diameter. The sensitivity improved to 74% with CAD. The by-patient sensitivity improved from 73% to 90%. However, neither of these improvements was statistically significant. An important finding of the study was that CAD significantly decreased the interobserver variability among the three radiologists. The total reading time did not improve; however, the average time to detection of the first polyp decreased significantly. A study by Summers et al. [34] also showed that CAD improved the sensitivity of human readers from 48% to 64%.
primary reader because, for serving for such a purpose, the CAD system should have a very high sensitivity and specificity; in other words, the ROC curve for the CAD system has to be raised to a level close to the upper left corner. Further research is required for development of a CAD system that will miss almost no polyps or cancer, but at the same time will not call benign findings abnormal.
Limitations of current CAD results in CT colonography
Detection of polyps in low dose scanning techniques
Most of the CAD results in the detection of polyps were obtained with fewer than 80 patients and 40 polyps acquired at a single institution. Also, only a few, small-scale studies have been published so far evaluating the clinically relevant benefits of CAD, such as improving the sensitivity of the human reader, decreasing the interpretation time, and decreasing the interobserver variability. Therefore, the performance and the benefits of CAD should be confirmed with a larger database of CTC cases collected at different institutions in prospective studies.
For CTC to be used as a tool for colon cancer screening, it should use the lowest possible radiation dose in order to avoid excessive radiation exposure to a screening population [35] . A low-dose CTC technique tends to produce noisy images. No studies have been performed in a human population on how such noisy images will affect the detection of polyps and masses by CAD. This will be an important area on which future research has to concentrate to assess the performance of CAD in lowradiation-dose settings.
Challenges and future directions for CAD in CT colonography
Detection of polyps in a setting of fecal tagging and bowel contrast subtraction
Developing a CAD system with high sensitivity and specificity For a CAD system to be clinically viable, it should have high sensitivity and specificity, that is, a low false positive rate. The diagnostic performance of CAD systems is represented by a receiver-operating characteristic (ROC) curve. There is a trade off between sensitivity and specificity; namely, increased sensitivity leads to detection of an increased number of false positives. A large number of false positives may increase the areas of the colon that radiologists have to review and, in turn, increases the interpretation time. This is especially problematic when a CAD system is to be used as a
Detection of flat lesions and wall-thickening-type cancers Few studies have been conducted for evaluation of the detection of flat lesions and cancers that show a mucosal wall-thickening type of growth pattern [32] . Detection of flat lesions and wall-thickening-type cancers poses a challenge because neither has a significant intraluminal component. It is also difficult to distinguish circumferential cancers from peristalsis or under-distension of the colon. Further research is needed for improvement of the detection of these types of lesions.
Thorough bowel cleansing required for colonoscopy and barium enema has been shown to be a compliance barrier for colon cancer screening [36] . Fecal tagging with oral contrast agents such as barium or water soluble iodinated contrast material, followed by subtraction of tagged feces, has the potential to eliminate or decrease the requirement for bowel cleansing [37] . However, incomplete tagging of feces can be a potential source of false-positive lesions. Digital subtraction of tagged stool may also lead to artifacts that can mimic polyps [37,38] . These factors can cause additional challenges for CAD systems, and thus CAD for fecal tagging remains a subject for future research.
Computer-aided detection for virtual colonoscopy
Co-registration of supine and prone data sets One of the effective ways of discriminating a polyp from retained stool of homogenous density is by assessing the location of a lesion in supine and prone data sets. A polyp stays in the same location within the colon, whereas nonadherent stool moves to the dependent wall [39] . This can be a very challenging task because several parts of the colon are mobile. Another factor that can increase the complexity of this task is the difference in distension in various segments between the supine and prone data sets, because air accumulates more in non-dependent loops. Few preliminary studies have used the correspondence of supine and prone data sets for improving the performance of CAD [40,41] ; one of these studies showed that the number of false-positive detections could be reduced by 20% by use of supine–prone correspondence [41] . Although the preliminary result is encouraging, further studies are needed for evaluating the use of co-registering the supine and prone datasets to reduce false-positive rates in CAD.
Integration of CAD systems into clinical workflow Various vendors have produced workstations tailored for reviewing CTC studies. However, none of these workstations have CAD integrated into their workflow. Studies need to be done for determination of an optimal method for displaying the CAD results in the workstations as well as a method for interpreting CTC images with CAD output. The question regarding whether CAD should be integrated into the workflow as a first reader or second reader should also be addressed.
Conclusion Initial results of CAD for CTC are promising. CAD has shown sensitivity comparable to that of human readers, with relatively low false-positive rates. CAD for CTC has also shown the potential to increase the diagnostic sensitivity of human readers and to decrease interobserver variability among readers. Therefore, CAD has the potential to bring CTC one step closer to costeffective clinical practice, especially to the screening setting. There are, however, many challenges for CAD that need to be addressed before it is ready for clinical use. To this end, further studies on the evaluation of the performance of CAD should be conducted based on a large database of CTC cases that are obtained with an upto-date CTC image acquisition protocol.
References [1] American Cancer Society. Cancer facts and figures, 2003. Available from http://www.cancer.org/downloads/
15
STT/CAFF2003PWSecured.pdf. [2] Jemal A, Murray T, Samuels A, Ghafoor A, Ward E, Thun MJ. Cancer statistics, 2003. Cancer J Clin 2003; 53: 5–26. [3] Bond JH. Clinical evidence for the adenoma-carcinoma sequence, and the management of patients with colorectal adenomas. Semin Gastrointest Dis 2000; 11: 176–84. [4] Mandel JS, Bond JH, Church TR et al. Reducing mortality from colorectal cancer by screening for fecal occult blood. N Engl J Med 1993; 328: 1365–71 (Erratum, N Engl J Med 1993; 329: 672). [5] Winawer SJ, Zauber AG, Ho MN et al. Prevention of colorectal cancer by colonoscopic polypectomy. N Engl J Med 1993; 329: 1977–81. [6] Yee J, Akerkar GA, Hung RK et al. Colorectal neoplasia: performance characteristics of CT colonography for detection in 300 patients. Radiology 2001; 219: 685–92. [7] Pickhardt PJ, Choi JR, Hwang I et al. Computed tomographic virtual colonoscopy to screen for colorectal neoplasia in asymptomatic adults. N Engl J Med 2003; 349: 2191–200. [8] Macari M, Bini EJ, Jacobs SL et al. Colorectal polyps and cancers in asymptomatic average risk patient: Evaluation with CT colonography. Radiology 2004; 230: 629–36. [9] Johnson CD, Dachman AH. CT colonography: the next colon screening examination. Radiology 2000; 216: 331–41. [10] Fenlon HM, Nunes DP, Schroy PC III et al. A comparison of virtual and conventional colonoscopy for the detection of colorectal polyps. N Engl J Med 1999; 341: 1496–503. [11] Johnson CD, Harmsen WS, Wilson LA et al. Prospective blinded evaluation of computed tomorgraphic colonography for screen detection of colorectal polyps. Gastroenterology 2003; 125: 311–9. [12] Johnson CD, Toledano AY, Herman BA et al. Computerized tomographic colonography: performance evaluation in a retrospective multicenter setting. Gastroenterology 2003; 125: 688–95. [13] Chen D, Liang Z, Wax MR, Li L, Li B, Kaufman AE. A novel approach to extract colon lumen from CT images for virtual colonoscopy. IEEE Trans Med Imaging 2000; 19: 1220–6. [14] Wyatt CL, Ge Y, Vining DJ. Automatic segmentation of the colon for virtual colonoscopy. Comput Med Imaging Graph 2000; 24: 1–9. [15] Hong L, Liang Z, Viswambharan A, Kaufman A, Wax M. Reconstruction and visualization of 3D models of colonic surface. IEEE Trans Nucl Sci 1997; 44: 1297–1302. [16] Summers RM, Beaulieu CF, Pusanik LM et al. Automated polyp detector for CT colonography: feasibility study. Radiology 2000; 216: 284–90. [17] Masutani Y, Yoshida H, MacEneaney PM, Dachman AH. Automated segmentation of colonic walls for computerized detection of polyps in CT colonography. J Comput Assist Tomogr 2001; 25: 629–38. [18] N¨appi J, Dachman AH, MacEneaney P, Yoshida H. Automated knowledge-guided segmentation of colonic walls for computerized detection of polyps in CT colonography. J Comput Assist Tomogr 2002; 26: 493–504. [19] N¨appi J, Frimmel H, Dachman AH, Yoshida H. A new highperformance CAD scheme for the detection of polyps in CT colonography. In: Medical Imaging 2004: Image Processing, Sonka M, Fitzpatrick JM, eds. SPIE, 2004: 839–48. [20] Yoshida H, N¨appi J. Three-dimensional computer-aided diagnosis scheme for detection of colonic polyps. IEEE Trans Med Imaging 2001; 20: 1261–74. [21] Paik DS, Beaulieu CF, Rubin GD et al. Surface normal overlap: a computer-aided detection algorithm with application to colonic polyps and lung nodules in helical CT. IEEE Trans Med Imaging 2004; 23: 661–75. [22] Kiss G, Van Cleynenbreugel J, Thomeer M, Suetens P, Marchal G. Computer-aided diagnosis in virtual colonography via combination of surface normal and sphere fitting methods. Eur Radiol 2002; 12: 77–81.
16
J J Perumpillichira et al.
[23] Yoshida H, Masutani Y, MacEneaney P, Rubin DT, Dachman AH. Computerized detection of colonic polyps at CT colonography on the basis of volumetric features: pilot study. Radiology 2002; 222: 327–36. [24] Yoshida H, N¨appi J, MacEneaney P, Rubin DT, Dachman AH. Computer-aided diagnosis scheme for detection of polyps at CT colonography. Radiographics 2002; 22: 963–79. [25] N¨appi J, Yoshida H. Automated detection of polyps with CT colonography: evaluation of volumetric features for reduction of false-positive findings. Acad Radiol 2002; 9: 386–97. [26] Summers RM, Johnson CD, Pusanik LM, Malley JD, Youssef AM, Reed JE. Automated polyp detection at CT colonography: feasibility assessment in a human population. Radiology 2001; 219: 51–9. [27] Gokturk SB, Tomasi C, Acar B et al. A statistical 3-D pattern processing method for computer-aided detection of polyps in CT colonography. IEEE Trans Med Imaging 2001; 20: 1251–60. [28] Acar B, Beaulieu CF, Gokturk SB et al. Edge displacement field-based classification for improved detection of polyps in CT colonography. IEEE Trans Med Imaging 2002; 21: 1461–7. [29] Jerebko AK, Malley JD, Franaszek M, Summers RM. Multiple neural network classification scheme for detection of colonic polyps in CT colonography data sets. Acad Radiol 2003; 10: 154–60. [30] Jerebko AK, Summers RM, Malley JD, Franaszek M, Johnson CD. Computer assisted detection of colonic polyps with CT colonography using neural networks and binary classification trees. Med Phys 2003; 30: 52–60. [31] N¨appi J, Yoshida H. Feature-guided analysis for reduction of false positives in CAD of polyps for computed tomographic colonography. Med Phys 2003; 30: 1952–601. [32] N¨appi JJ, Frimmel H, Dachman AH et al. Computerized detection of colorectal masses in CT colonogrpahy based on
[33]
[34]
[35]
[36]
[37]
[38]
[39]
[40]
[41]
fuzzy merging and wall thickness analysis. Med Phys 2004; 31: 860–72. Mani A, Napel S, Paik DS, Jeffrey RB Jr et al. Computed tomography colonography: feasibility of computer-aided polyp detection in a first reader paradigm. J Comput Assist Tomogr 2004; 28: 318–26. Summers RM, Jerebko AK, Franaszek M et al. Colonic polyps: complimentary role of computer-aided detection in CT colonography. Radiology 2002; 225: 391–9. Hara AK, Johnson CD, Reed JE et al. Reducing data size and radiation dose for CT colonography. AJR Am J Roentgenol 1997; 168: 1181–4. Weitzman ER, Zapka J, Estabrook B et al. Risk and reluctance: understanding impediments to colorectal cancer screening. Prev Med 2001; 32: 502–13. Zalis ME, Perumpillichira J, Del Frate C et al. CT colonography: digital subtraction bowel cleansing with mucosal reconstruction initial observation. Radiology 2003; 226: 911–7. Pickhardt PJ, Choi JH. Electronic cleansing and stool tagging in CT colonography: advantages and pitfalls with primary threedimensional evaluation. AJR Am J Roentgenol 2003; 181: 799–805. Chen SC, Lu DS, Hecht JR et al. CT colonography: value of scanning in both the supine and prone positions. AJR Am J Roentgenol 1999; 172: 595–9. Li P, Napel S, Acar B et al. Registration of central paths and colonic polyps between supine and prone scans in computed tomography colonography: pilot study. Med Phys 2004; 31: 2912–23. N¨appi J, Frimmel H, Okamura A et al. Region-based supineprone correspondence for reduction of false positives in CAD of CT colonography. Proc CARS: Comput Assist Radiol Surg 2004; 1268: 993–8.