Passive Measurement, Performance Management, Server Management, Traffic, ... to monitor multiple metrics that reflect broader ...... Apache cookbook:.
40 International Journal of Adaptive, Resilient and Autonomic Systems, 5(2), 40-56, April-June 2014
Performance Degradation Detection of Virtual Machines via Passive Measurement and Machine Learning Toshiaki Hayashi, Hokuriku Computer Service Co., Ltd., Toyama, Japan Satoru Ohta, Toyama Prefectural University, Toyama, Japan
ABSTRACT Virtualization is commonly used for efficient operation of servers in datacenters. The autonomic management of virtual machines enhances the advantages of virtualization. Therefore, for the development of such management, it is important to establish a method to accurately detect the performance degradation in virtual machines. This paper proposes a method that detects degradation via passive measurement of traffic exchanged by virtual machines. Using passive traffic measurement is advantageous because it is robust against heavy loads, non-intrusive to the managed machines, and independent of hardware/software platforms. From the measured traffic metrics, performance state is determined by a machine learning technique that algorithmically determines the complex relationships between traffic metrics and performance degradation from training data. The feasibility and effectiveness of the proposed method are confirmed experimentally. Keywords:
Passive Measurement, Performance Management, Server Management, Traffic, Virtualization
INTRODUCTION Virtualization (Sahoo, Mohapatra, & Lath, 2010) is an indispensable technique used for the efficient operation of servers in datacenters and for providing cloud services. In this technique, multiple virtual machines run on a physical host computer while sharing the host’s resources.
Virtual machines must be suitably managed to provide adequate quality of service that conforms to the service level agreement (SLA). However, if excessive load is experienced by a virtual machine and the resources of its physical host machine are exhausted, the SLA might be violated due to performance degradation. If this happens, the performance will be restored
DOI: 10.4018/ijaras.2014040103 Copyright © 2014, IGI Global. Copying or distributing in print or electronic forms without written permission of IGI Global is prohibited.
International Journal of Adaptive, Resilient and Autonomic Systems, 5(2), 40-56, April-June 2014 41
by moving the deteriorated virtual machine to another host by using a live migration technique (Clark et al., 2005). To ensure good quality of service to clients and users with the least operational expenditure, autonomic management of virtual machines is required. That is, the mapping between virtual machines and physical hosts should be dynamically rearranged depending on the load offered to each machine. This type of management minimizes the number of operating physical hosts while providing adequate quality of service. To this end, the management system must (1) detect performance degradation in virtual machines, (2) determine the virtual machine to be migrated to an alternative host, and (3) execute a live migration. This paper focuses on detecting performance degradation in virtual machines. Autonomic management of virtual machines has been studied in (Bobroff, Kochut, & Beaty, 2007; Xu & Fortes, 2011; Andreolini, Casolari, Colajanni, & Messori, 2010). The method proposed by (Bobroff, et al., 2007) determines the virtual machines that must be migrated by analyzing changes in CPU utilization. In the method proposed by (Xu & Fortes, 2011), information on resource consumption is obtained for both virtual machines and physical hosts. The resource utilization metrics used in their method include CPU utilization, disk I/O, network utilization, and temperature. The method presented by (Andreolini, et al., 2010) determines the virtual machine to be migrated by considering the state change characteristic of a single load metric, such as CPU utilization. In all these methods, performance state is determined using metrics obtained through the operating system (OS). Thus, degradation detection is intrusive. In addition, the software that gathers the resource consumption information depends on the machine platform. It is also unclear if the employed metrics accurately represent the degradation experienced by users. For example, performance might degrade at very low CPU utilization for some service content and at high CPU utilization for other content.
It is not certain that the existing method can successfully handle this difficulty. Several technical problems arise in detecting performance degradation in a virtual machine. First, performance is degraded by the exhaustion of different resources, such as the CPU, disks, and network interfaces, depending on differences in the service content requested by users. The utilization of packet queuing buffers or setting of the server program parameters also affects performance. Thus, it is necessary to monitor multiple metrics that reflect broader utilization of these resources. Moreover, the relationship between resource utilization and quality of service experienced by users is not necessarily clear. Conflicts among virtual machines on the same physical host complicate the problem further. Obtaining information on resource utilization through the virtual machine or physical host OS is also problematic. That is, if the performance of a machine is greatly degraded, it becomes difficult to successfully extract resource information through the OS. Compatibility is another problem; different measurement software must be developed for different OSs. This increases development time and cost. In addition, the measurement of resource utilization through the OS consumes computational resources of both the virtual machines and their physical hosts. This might lead to a decrease in machine capacity. To avoid these problems, performance degradation in virtual machines should be detected in a manner that is non-intrusive to both virtual machines and physical hosts. The metrics measured for degradation detection should include information that reflects the consumption of various performance related resources. It is also necessary to clarify a method to detect degradation signs among these metrics. The goal of this paper is to develop virtual machine management for use when virtual machines are operated as servers that provide network services. In this case, the paper investigates a method in which performance degradation is detected through several metrics related to traffic sent and received by virtual machines.
Copyright © 2014, IGI Global. Copying or distributing in print or electronic forms without written permission of IGI Global is prohibited.
42 International Journal of Adaptive, Resilient and Autonomic Systems, 5(2), 40-56, April-June 2014
Traffic metrics are passively measured on a machine separate from both virtual machines and physical hosts. Thus, the method is completely non-intrusive and independent of hardware/ software platforms. By employing different types of traffic metrics, the method attempts to find any degradation caused by various resources. It is difficult to theoretically analyze the relationship between passively measured traffic metrics and performance degradation. To avoid this difficulty, a machine learning technique is applied. That is, the rule for detecting degradation using metrics is built from training data by a learning algorithm. The feasibility and effectiveness of the proposed method are confirmed experimentally. The experiment also checks robustness against the characteristic differences of loads given in the training and operation phases. Although the experiment is performed for the World Wide Web (WWW) service, the method is also applicable to a wide range of other network services. This paper is structured as follows. First, previous related works are reviewed. Next, the target of this paper is described. Then, the paper details the proposed method, and the proposed method is evaluated experimentally. Finally, the paper presents our conclusions.
RELATED WORK In (Clark, et al., 2005), the concept of live migration is explored. This concept enables an operator to move a virtual machine from the present physical host to another host without stopping the service. Live migration enables autonomic management of virtual machines. That is, the assignments between virtual machines and physical hosts can be changed dynamically depending on demand for the service. This autonomic control decreases the number of operating physical hosts and thus reduces operational expenditure. The dynamic assignment or “self-reconfiguration” of virtual machines has been reported by (Bobroff, et al., 2007; Xu & Fortes, 2011; Andreolini, et al., 2010; Chen, Qiao, Wei, &
Huang, 2012). The method proposed by (Bobroff, et al., 2007) considers that response time is determined using CPU utilization and presents a way to determine the virtual machines to be reassigned to physical hosts by analyzing CPU utilization characteristics. They also proposed an algorithm that remaps virtual machines to physical hosts to minimize the number of operating physical hosts. However, the problem with this method is that CPU utilization is not a sufficient criterion for identifying performance or service level degradation. For some types of service content, performance might degrade at very low CPU utilization because resources other than the CPU, such as the disk or network, become the bottleneck. Thus, degradation cannot be determined using only CPU utilization. In the method presented by (Xu & Fortes, 2011), the system is managed using information from the virtual machine layer as well as the physical machine layer. Their method employs CPU utilization, disk I/O, network utilization, and temperature as metrics for the offered load. Performance degradation is detected by setting threshold values for these metrics. Because information on various resources is used, performance degradation detection by this method might be more reliable; however, it is unclear if the employment of fixed threshold values is adequate. Performance often degrades at very different values of resource utilization depending on the service content, because there are more resources and parameters that affect performance than are considered in the method proposed by (Xu & Fortes, 2011). In (Andreolini, et al., 2010), the dynamic management of virtual machines consists of four phases: selection of sender hosts, selection of guests, selection of receiver hosts, and assignment of guests. For the selection of sender hosts, they employed a state change characteristic of the load, such as CPU utilization. In addition, their method identifies the guest virtual machine to be migrated by the trend of variations and changes in the load experienced by a virtual machine. Their approach to sender and guest selection might be more practical than simple
Copyright © 2014, IGI Global. Copying or distributing in print or electronic forms without written permission of IGI Global is prohibited.
International Journal of Adaptive, Resilient and Autonomic Systems, 5(2), 40-56, April-June 2014 43
threshold-based approaches; however, their approach assumes that only one load metric, such as CPU utilization, is used. Thus, it will be difficult for the method to deal with a case where multiple service content coexists and provision of different content consumes different levels of various resources. (Chen et al., 2012) also investigated a self-reconfiguration technique for virtual machines. They emphasized that the problems of the technique are time consumption and resource interference caused by migrations. From this viewpoint, they proposed a local resource adjustment technique and a parallel migration algorithm. The former technique eliminates the execution of migrations, while the latter decreases the time required for migration. However, it is unclear how their method detects overloaded virtual machines. According to their study, their method monitors the system information on physical machines and predicts workload trends and resource demands. Unfortunately, the details and effectiveness of these mechanisms are not clearly presented. In the above methods, resource utilization information is obtained through the OS running on the managed machine. This also has disadvantages, which are described in the next section.
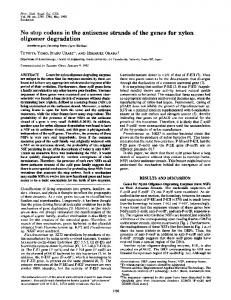
PROBLEM DESCRIPTION Consider a situation in which multiple virtual machines are operated with two or more physical hosts to provide services to users via a network. The quality of service experienced by the users must be sufficient to satisfy the SLA. In this situation, the performance of a virtual machine degrades if users offer an excessively heavy load. If this happens, the quality of service experienced by users will become unsatisfactory. To avoid performance degradation, this virtual machine must be migrated from the current physical host to another host whose load is light. This operation is illustrated in Figure 1. To perform the operation shown in Figure 1 autonomically, several functions must be provided by the management system. First, it is necessary to determine whether the performance of each virtual machine has deteriorated. If performance degradation is detected, the management system must identify a new host to which the virtual machine should be migrated. Next the actual migration is executed. These steps are depicted in the flowchart shown in Figure 2. This paper considers performance degradation detection, which is the first step in the autonomic management of virtual machines.
Figure 1. Autonomic management of virtual machines
Copyright © 2014, IGI Global. Copying or distributing in print or electronic forms without written permission of IGI Global is prohibited.
44 International Journal of Adaptive, Resilient and Autonomic Systems, 5(2), 40-56, April-June 2014
Figure 2. Flowchart of autonomic virtual machine management
The performance of a virtual machine is degraded by the exhaustion of host computer resources shared by multiple virtual machines. Various host resources, such as the CPU, hard disk, bus, and network interfaces affect performance. Performance also depends on the settings on each virtual machine; for example, the assigned memory, datagram receipt/transmission buffer, and socket accept queue buffer for TCP services also affect performance. For example, it was pointed out by (Pradhan, Tewari, Sahu, Chandra, & Shenoy, 2002; Tsai, Shin, Reumann, & Singhal, 2007) that web service performance greatly depends on the usage of the socket accept queue buffer. In addition, performance is affected by setting of server program parameters, such as MaxClients of the Apache (Bowen & Coar, 2008) web server. The service content determines which of these resources, memory/buffer sizes, or parameter settings cause performance degradation. Thus,
to provide service with sufficient quality, monitoring the utilization of only a few resources is inadequate. Considering the above points, the degradation detection problem is specified as follows: • •
Measurement of various metrics that reflect the utilization of various performance related resources; Discovery of degradation signs in the measured metrics.
PROPOSED METHOD Passive Traffic Measurement Information on the consumption of some computational resources is obtainable through the OSs and hypervisors of virtual machines and physical hosts. A typical OS provides
Copyright © 2014, IGI Global. Copying or distributing in print or electronic forms without written permission of IGI Global is prohibited.
International Journal of Adaptive, Resilient and Autonomic Systems, 5(2), 40-56, April-June 2014 45
such information, including CPU utilization, network I/O utilization, and block device I/O. For example, the Linux “/proc” pseudo-files provide this information (Linux Programmer’s Manual, 2010). However, the OS does not necessarily provide utilization information for every performance related resource. Another problem with resource information obtained through the OS (or hypervisor) is robustness against load. That is, if a heavy load greatly exhausts resources, the OS itself, or the program that extracts information through the OS, might not work correctly. If this happens, resource utilization information will not be successfully obtained. Compatibility is another problem. If different OSs are used on different virtual machines, the interfaces provided by each OS will differ. Thus, different software must be developed to extract resource utilization from these virtual machines. This increases the time and cost of software development. In addition, a program that extracts resource information consumes the computational resources of virtual machines and physical hosts to some extent. This might decrease overall machine capacity. When the performance of a virtual machine degrades because of a heavy load, the characteristics of traffic sent and received by the machine are affected. For example, when
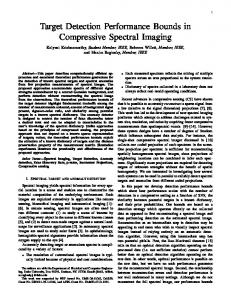
the performance of the web service degrades by the overflow of the socket accept queue buffer, some TCP SYN packets are lost and not responded by SYN ACK packets. Thus, this degradation is reflected on the numbers of TCP SYN and SYN ACK packets in the traffic (Ohta & Andou, 2010). The number of flows is another important traffic parameter to detect degradation, for example, the decrease of a connection throughput. This is because the throughput of a connection is closely related to the ratio of the bit rate and the number of flows (Zhu & Ohta, 2010). This is confirmed by Figure 3, which shows the result of a simple experiment. This figure plots the connection throughput and the number of flows versus request rate. The data shown in the figure was taken for the Apache web server that runs on Pentium E6800, 2GB RAM Linux PC. The page data was 100 HTML files of 1MB size. For this server, page requests were generated by httperf (Mosberger & Jin, 1998) and the connection throughput was measured. To measure the bit rate and the number of flows, a measurement program was written with using the “pcap” library (TCPDUMP/ LIBPCAP, 2012). Figure 3 clearly shows that the number of flows greatly increases when the connection throughput excessively decreased by heavy load. With this result, it is concluded
Figure 3. Connection throughput and the number of flows
Copyright © 2014, IGI Global. Copying or distributing in print or electronic forms without written permission of IGI Global is prohibited.
46 International Journal of Adaptive, Resilient and Autonomic Systems, 5(2), 40-56, April-June 2014
that the number of flows include information on the throughput degradation. As stated above, the characteristics of traffic exchanged by virtual machines include information on their performance. Using traffic characteristics as a performance information source has several advantages. First, traffic can be passively measured on a machine that is separate from virtual machines and physical hosts. Thus, performance information can always be extracted, even under extreme performance degradation. It is also possible to non-intrusively detect degradation without affecting machine capacity. Moreover, the measurement program does not depend on the software or hardware platforms of virtual machines and physical hosts. Thus, even if the OS on virtual machines changes, it is not necessary to redevelop the measurement program. To detect performance degradation using traffic characteristics, it is obviously inadequate to set a fixed threshold for a single traffic metric. For example, assume that a performance bottleneck is the capacity of the network interface and performance degradation is detected by the bitrate of traffic. In this case, the bit rate at which the performance of a virtual machine degrades depends on the traffic volumes of other virtual machines on the same physical host (Hayashi & Ohta, 2012). Therefore, it is impossible to determine an appropriate bitrate threshold for detecting the degradation of the monitored virtual machine. In addition, because various resources affect performance, degradation signs will appear in various traffic metrics. Thus, it is essential to monitor multiple traffic metrics that reflect the consumption of any performance related resource. Moreover, it is necessary to identify mapping from metrics to performance states. As the above example implies, it is inadequate to set a fixed threshold for each metric. This means that the mapping will be represented by a complex function. It is difficult to derive this function analytically. Therefore, it must be determined from the measured sample data.
Applying the Machine Learning Technique To find a function that maps multiple traffic metrics to performance states, this paper employs a machine learning approach. The framework of machine learning is expressed as follows. Suppose a system state that falls into one of n classes s1, …, sn. Information about the unknown current state class is obtained by monitoring m attributes a1, …, am. Then, the machine learning technique builds a classifier that estimates the unknown current class from the measured attribute values. The classifier is constructed from training data that include the vectors of the actual class as well as the attribute values measured under that class. A classifier is obtained by entering training data to a machine learning algorithm. This framework is known as “supervised learning” (Marsland, 2009). The above framework is applied for detecting performance degradation in a virtual machine by considering traffic metrics as attributes and performance states as classes. The machine learning approach enables finding the complex mapping from traffic metrics to performance states algorithmically using training data. The approach consists of two phases. In the first phase, the training data is obtained by artificially generating load on virtual machines and measuring the performance. In the second phase, the unknown state of the managed virtual machine is inferred by inputting the traffic attributes to the classifier while it is actually providing services to users. Hereafter, these phases are referred to as the training phase and the operation phase, respectively. In the machine learning field, several learning models, such as the artificial neural network, naïve Bayes classifier, Bayesian network, and a support vector machine are used (Marsland, 2009). This paper employs a decision-tree-based method (Safavian & Landgrebe, 1991). A decision tree is a tree-shaped diagram representing a sequential decision process in which attribute values are successively tested to
Copyright © 2014, IGI Global. Copying or distributing in print or electronic forms without written permission of IGI Global is prohibited.
International Journal of Adaptive, Resilient and Autonomic Systems, 5(2), 40-56, April-June 2014 47
infer an unknown state. As shown in Figure 4, a decision tree is a “rooted tree.” The inference process starts at its root and proceeds to a leaf. An attribute is assigned to each internal node, while each leaf is labeled with the most likely state. When the inference process reaches an internal node, the value of the attribute assigned to the node is tested to decide which child node the process should proceed to. When the process reaches a leaf, the leaf label is considered to be the current state. As (Marsland, 2009) points out, an advantage of the decision-tree-based method is its very low computational cost of querying the trained classifier. This advantage is very important for real time virtual machine management, which requires the immediate response to the attributes input. The method is also advantageous because the inference process by a decision tree is transparent and easy to understand (Marsland, 2009). Another advantage is that a reliable program, c4.5, is available for this method. The algorithm of c4.5 is detailed by (Quinlan, 1993). The c4.5 program has been tested and used for various studies on system management (Amor, Benferhat, & Elouedi, 2004; Li & Moore, 2007; Ohta & Hirota, 2011; Ohta, Kurebayashi, & Kobayashi, 2008). Thus, it is
considered sufficiently reliable for the scope of this paper.
Traffic Metrics Various resources influence the performance of a virtual machine. The consumption of different resources affects the behavior of different traffic metrics. Thus, for successful performance degradation detection, it is necessary to monitor multiple traffic metrics and discover signs of degradation from these metrics. Therefore, this paper employs the following metrics: • • • • •
Bitrate Packet rate Connection rate TCP SYN loss rate Number of flows
Among these metrics, bitrate is obviously important for network I/O capacity. For short packets, data transmission is limited by packet rate rather than bitrate. Thus, packet rate might provide significant information. Because the connection establishment process consumes some resources, it is reasonable to use con-
Figure 4. Decision tree
Copyright © 2014, IGI Global. Copying or distributing in print or electronic forms without written permission of IGI Global is prohibited.
48 International Journal of Adaptive, Resilient and Autonomic Systems, 5(2), 40-56, April-June 2014
nection rate. TCP SYN loss rate is defined as follows. Let NS and NA denote the numbers of TCP SYN and SYN ACK messages, respectively. Then, the TCP SYN loss rate rS is given as follows: rS =
NS − NA NA
(1)
It is known that rS is closely related to the response time of a web server (Ohta & Andou, 2010). This is because this metric identifies overflows of the socket accept queue buffer. The number of flows is defined as the number of TCP connections existing in the last Δt s. Methodology for counting flows has been explored by (Estan, Varghese, & Fisk, 2006; Kim & O’Hallaron, 2003; Zhu & Ohta, 2012). When the number of flows is excessively large, decrease in connection throughput is predictable. Thus, the number of flows provides information on performance degradation. In this paper, Δt is set to 1 s, and the average value over 60 s is used.
Performance Class The following two state classes are defined in this paper: • •
OK: Performance is sufficient, thus migration of virtual machines is not necessary; NG: Performance is insufficient, thus migration of virtual machines is necessary.
To prepare the training data, the state class of virtual machines must be determined from the measured parameters. This paper employs the throughput of a TCP connection as the criterion for performance by assuming page data downloads using the WWW (httpd) service. Let s denote the average file size in bits and t denote the average download time. Furthermore, assume that download time has a standard deviation σ. These parameters are obtainable from the output of Web benchmark software (httperf). Then, the bitrate r is computed as follows:
r=
s t +σ
(2)
If r exceeds 10 Mb/s, the state class is judged to be OK; otherwise, the state class is NG. This criterion ensures that DVD-quality video streaming is provided satisfactorily when the class is OK. In the denominator of (2), standard deviation is added to download time to consider variations in download time. By including deviation in download time, a sufficiently high throughput is provided for a large portion of users when the class is OK. This paper employed the throughput of a connection to determine the state class for simplicity as the first step of study. For this criterion, it may not be necessary to measure all five traffic metrics mentioned in the previous subsection. This is because the connection throughput is evaluated via the bit rate and the number of flows (Zhu & Ohta, 2010). However, for the strict state class decision, it is essential to consider other performance parameters in addition to the throughput. For example, the TCP connection establishment time, which determines the Web response time, is also a very important criterion. For this criterion, the TCP SYN loss rate will become an informative metric because the loss of TCP SYN packets greatly affects the connection establishment time (Ohta & Andou, 2010). Thus, every traffic metric will provide valuable information for the state class decision if the system uses performance parameters other than the connection throughput. It is planned that the system of this paper will use additional performance parameters to achieve more practical class decision in the future. Therefore, the system builds a decision tree with using all five traffic metrics rather than using only the bit rate and the number of flows.
EVALUATION The effectiveness of the proposed method was experimentally evaluated. The experimental
Copyright © 2014, IGI Global. Copying or distributing in print or electronic forms without written permission of IGI Global is prohibited.
International Journal of Adaptive, Resilient and Autonomic Systems, 5(2), 40-56, April-June 2014 49
configuration is illustrated in Figure 5. The system consisted of a server PC, a traffic monitoring PC, and two client PCs. All four PCs were connected by a 1 Gb/s Ethernet. A Linux OS ran on each PC. The server PC had a Core2Duo 2.66GHz CPU and 4 GB of memory. On the server PC, two virtual machines, V1 and V2, were constructed using the Xen hypervisor (Barham et al., 2003; Xen, 2012). Each virtual machine (V1 and V2) was assigned 256 MB of memory. The Apache Web server (Bowen & Coar, 2008) ran on each virtual machine and two sets of HTML files were placed on V1 and V2 as page data. Each of these file sets included 100 files, referred to as file set #1 and #2. For file set #1, the size of each file was randomly determined as 1, 2,…, 100 MB, with a probability of 1/100. The content of each file was a sequence of random characters. Similarly, the file sizes for file set #2 were randomly selected as 0.1, 0.2, …, 10 MB. Since the average file size of file set #2 was 1/10 that of file set #1, the characteristics of the load generated by each was considerably different. These file sets were created so as to emulate real world web page data, whose file sizes are widely distributed. It is considered that the sizes of file set #1 approximate those of common movie clip files. Meanwhile, picture or document files are modeled by file set #2. As described above, the experiment was performed on a minimal system, which includes only two virtual machines. However, this system is sufficient to show the basic characteristic and feasibility of the proposed approach.
On the client PCs, denoted as C1 and C2, the Web benchmark program “httperf” (Mosberger & Jin, 1998) ran as the client program. The “httperf” program on C2 requested page data from V2 and generated background traffic for the server PC. Similarly, the “httperf” program on C1 generated load and measured the performance for V1. The traffic metrics were simultaneously measured on the traffic monitoring PC for the packet stream delivered from V1 to C1. Note that the configuration of Figure 5 is a minimal system to experimentally confirm the feasibility of the approach. In this configuration, all the packets sent and received by the server go through the monitoring PC. Therefore, it is likely that the monitoring PC will become a performance bottleneck if multiple physical server machines are employed to achieve larger capacity. This problem can be avoided by the configuration shown in Figure 6. In this figure, packets are copied by the port mirroring function of the switches and then sent to the monitoring computers. Thus, the traffic exchanged between the servers and clients does not pass through the monitoring computers. This means that the capacity of monitoring computers would not affect system performance. Moreover, the capacity of computing the traffic parameters is enlarged by employing multiple monitoring computers. Thus, it becomes easier to monitor each of many packet streams by virtual machines on a large system. This also improves system scalability. For traffic measurement, we used a program that estimates traffic metrics from captured
Figure 5. Configuration of the experimental system
Copyright © 2014, IGI Global. Copying or distributing in print or electronic forms without written permission of IGI Global is prohibited.
50 International Journal of Adaptive, Resilient and Autonomic Systems, 5(2), 40-56, April-June 2014
Figure 6. Realistic configuration for a larger system
packets. The program was built using the C language and “pcap” (TCPDUMP/LIBPCAP, 2012) library. The program outputs metric values every 60 s. Training and test data were constructed using these metric values and the “httperf” output. The experimental evaluation was performed in two steps. In the first step, the correctness of state inference by the proposed method was confirmed. Then, in the second step, the proposed method was examined for robustness against different load characteristics in the training and operation phases.
Step 1: Correctness of State Inference Using the configuration illustrated in Figure 5, we checked the state inference correctness by the machine learning approach. Training and test data were obtained as follows. File set #1 was used as the requested page data to generate the measured load on V1 and the background traffic load on V2. First, the maximum page request rate RM was obtained for the case where no background traffic exists. This was achieved by generating page requests only on C1 and changing the request rate of “httperf”. Then, the request rate of the background traffic between C2 and V2 was set to 0.1RM, 0.5RM, or
0.9RM for the training data. For test data, the background rate was set to 0.1RM, 0.3RM, 0.5RM, 0.7RM, or 0.9RM. For each of these background traffic conditions, the request rate of the traffic monitored between C1 and V1 was set to the following values: R1, R2, …, R10. Ri = 0.1iRM (1 ≤ i ≤ 10)
(3)
By combining the above background and monitored traffic rates, training and test data were generated for 30 and 50 traffic conditions, respectively. Traffic metrics were measured 20 times for each traffic condition. Simultaneously, performance class was determined from the “httperf” output on C1. Thus, the resulting training data included 600 instances and the test data included 1000 instances. Approximately half of these instances fall into class NG. For the execution of “httperf,” the interval between page data requests was randomly determined according to an exponential distribution. The measurement time was 60 s for each data instance. The training data were then fed to the c4.5 program (Quinlan, 1993). The program constructed a decision tree that infers performance from traffic metrics. Then, test data were entered into the obtained decision tree.
Copyright © 2014, IGI Global. Copying or distributing in print or electronic forms without written permission of IGI Global is prohibited.
International Journal of Adaptive, Resilient and Autonomic Systems, 5(2), 40-56, April-June 2014 51
The error ratio was evaluated by comparing the inference of the decision tree with the true class. Error ratio is defined as the ratio of the number of misclassified data instances and the total number of data instances. For the 1000 test data instances, we found that the error ratio was as small as 2.2%. Thus, degradation detection by the proposed method is considered reliable in most cases. Figures 7 and
8 compare the class inferred by the decision tree and true class. In these figures, the monitored traffic rate was changed from 0.1RM to RM. The background traffic rates were fixed at 0.5RM and 0.3RM for Figures 7 and 8, respectively. The x axis represents the monitored traffic rate Ri. Figure 7 clearly shows a case where the performance class is correctly inferred for every value of the monitored traffic rate. An
Figure 7. True class and inferred class when background traffic rate is 0.5 RM
Figure 8. True class and inferred class when background traffic rate is 0.3 RM
Copyright © 2014, IGI Global. Copying or distributing in print or electronic forms without written permission of IGI Global is prohibited.
52 International Journal of Adaptive, Resilient and Autonomic Systems, 5(2), 40-56, April-June 2014
inference error is found in Figure 8. This figure shows that the error occurs only near the border rate, which separates the classes OK and NG. Except for this region, the inference is very reliable. It is easily understood that inference is more difficult for conditions that are close to the border between OK and NG. Figure 9 shows the relationship between the error ratio and background traffic rate. The error ratio is small and independent of background traffic. Note that the background traffic conditions 0.3RM and 0.7RM were not included in the conditions used for generating training data. Thus, the low error ratio for these background traffic rates confirms that the method provides correct inferences even for unlearned conditions. This characteristic is very advantageous for practical operation because it is difficult to prepare training data that covers all possible load conditions. The number of employed training data should be sufficiently large to obtain a small error ratio. Figure 10 shows the relationship between the average error ratio and number of training data instances. The error ratio decreases against the increase of training data instances. However, the figure reveals that the error ratio does not change greatly when the number of
instances exceeds 420. Therefore, it is concluded that 600 data instances are sufficiently large to obtain a low error ratio.
Step 2: Robustness against the Different Load Characteristics It is possible that the load characteristic observed in the training phase was different from that in the operation phase. Therefore, it was necessary to confirm how robust the proposed method is for this difference in load characteristics in the training operation phases. This was assessed for the following cases, where the traffic characteristics differ for the training and operation phases: Case 1: The monitored traffic in the operation phase is the same as that in the training phase, and the background traffic in the operation phase is different from that in training phase; Case 2: The same background traffic was generated in the training and operation phases; however, the load on the monitored virtual machine in the operation phase is different from that in the training phase.
Figure 9. Error ratio versus background traffic rate
Copyright © 2014, IGI Global. Copying or distributing in print or electronic forms without written permission of IGI Global is prohibited.
International Journal of Adaptive, Resilient and Autonomic Systems, 5(2), 40-56, April-June 2014 53
Figure 10. Average error ratio versus the number of training data instances
This step of the experiment employs the same decision tree used in Step 1. The tree was built by the training data obtained by offering page requests to file set #1 on V1 and V2. For Case 1, the page request for V2 was sent to file set #2 to provide background load different from the load in the training phase. Meanwhile, the load on V1 was produced by sending requests for file set #2 for Case 2. For this case, the background traffic was offered by file set #1. These settings are summarized in Table 1. The test data was obtained in the same way as in Step 1, except for the difference in the employed file set. Thus, each test data set included 1000 instances. The machine learning approach was considerably robust against the variation of the background traffic. This is shown in Figure
11, which presents the results for Case 1. The figure plots the obtained error ratio against the background traffic rate. As the figure shows, the maximum error rate was 3% and the minimum rate was 1.5%. The average error rate was 2.2%. Thus, the error ratio did not change significantly between the file sets #1 and #2 used for background traffic generation despite the characteristic difference. This suggests that the degradation inference is reliable even if very different background traffic is offered to other virtual machines on the same physical machine. While the inference is robust for the difference of the background traffic, the training data must be prepared by accurately approximating the practical load. This was strongly suggested by the result of Case 2, shown in Figure 12. The error ratio is unacceptably high for this case. This
Table 1. File sets used in Step 2
Copyright © 2014, IGI Global. Copying or distributing in print or electronic forms without written permission of IGI Global is prohibited.
54 International Journal of Adaptive, Resilient and Autonomic Systems, 5(2), 40-56, April-June 2014
Figure 11. Error ratio when the background traffic was generated for file set #2
Figure 12. Error ratio when the monitored traffic is generated for file set #2
is because the characteristic of the actual load in the operation phase greatly differs from that of the load used to obtain the training data. That is, in the training phase, it is necessary to produce the load that accurately approximates the actual load generated during the operation phase.
CONCLUSION Performance degradation detection is important for the autonomic management of virtual servers. This paper proposed a method for detecting performance degradation. The proposed method
Copyright © 2014, IGI Global. Copying or distributing in print or electronic forms without written permission of IGI Global is prohibited.
International Journal of Adaptive, Resilient and Autonomic Systems, 5(2), 40-56, April-June 2014 55
employs passive measurement of traffic metrics as well as a machine learning approach. The proposed method has several advantages. First, passive traffic measurement is robust against extreme degradation of the managed virtual machines and is non-intrusive to both virtual machines and physical hosts. The method is also independent of the platforms used in virtual machines and physical hosts. This decreases software development costs. Because degradation is associated with various bottleneck resources or parameter settings, it is necessary to measure multiple traffic metrics that reflect information regarding different resources and parameters. The relationship between traffic metrics and performance degradation is expressed by a complex function. The proposed method employs a machine learning technique to obtain this function. Using training data, the technique algorithmically constructs a classifier that maps metrics to performance state classes. To assess the feasibility and effectiveness of the proposed method, an experiment was performed. The results indicated that the method yields correct inference of a performance class in most cases. In particular, the error ratio is low even for background traffic conditions that were not included in the training data. Moreover, the error ratio is low even if the characteristic of the background traffic is very different from that of the training data. These results confirm the practicality of the proposed method.
Andreolini, M., Casolari, S., Colajanni, M., & Messori, M. (2010). Dynamic load management of virtual machines in cloud architectures. In D. R. Avresky, M. Diaz, A. Bode, B. Ciciani, & E. Dekel (Eds.), Cloud Computing (Vol. 34, pp. 201–214). Springer Berlin Heidelberg. doi:10.1007/978-3-642-12636-9_14
ACKNOWLEDGMENT
Hayashi, T., & Ohta, S. (2012). Detecting the performance degradation of virtual machines through passive measurement and machine learning, IEICE Technical Report, (IN2012-49) (in Japanese)
The authors would like to thank Enago (www. enago.jp) for the English language review.
REFERENCES Amor, N. B., Benferhat, S., & Elouedi, Z. (2004, March). Naive Bayes vs decision trees in intrusion detection systems, Proceedings of the 2004 ACM Symposium on Applied Computing (SAC 2004), (pp. 420-424) doi:10.1145/967900.967989
Barham, P., Dragovic, B., Fraser, K., Hand, S., Harris, T., & Ho, A. et al. (2003). Xen and the art of virtualization, Proceedings of the Nineteenth ACM Symposium on Operating Systems Principles (SOSP ‘03), (pp. 164-177) doi:10.1145/945445.945462 Bobroff, N., Kochut, A., & Beaty, K. (2007). Dynamic placement of virtual machines for managing SLA violations, Proceedings of the 10th IFIP/IEEE International Symposium on Integrated Network Management (IM ‘07), (pp. 119-128) doi:10.1109/ INM.2007.374776 Bowen, R., & Coar, K. (2008). Apache cookbook: solutions and examples for Apache administrators (Second Edition), Sebastopol, CA: O’Reiley Chen, W., Qiao, X., Wei, J., & Huang, T. (2012). A two-level virtual machine self-reconfiguration mechanism for the cloud computing platforms, Proceedings of the 9th International Conference on Autonomic & Trusted Computing (ATC 2012), (pp.563-570) doi:10.1109/UIC-ATC.2012.39 Clark, C., Fraser, K., Hand, S., Hansen, J. G., Jul, E., Limpach, C., et al. (2005). Live migration of virtual machines, Proceedings of the 2nd Symposium on Networked Systems Design & Implementation (USENIX NSDI ‘05), 2, (pp. 273-286) Estan, C., Varghese, G., & Fisk, M. (2006). Bitmap algorithms for counting active flows on high-speed links. IEEE/ACM Transactions on Networking, 14(5), 925–937. doi:10.1109/TNET.2006.882836
Kim, H.-a., & O’Hallaron, D. R. (2003). Counting network flows in real time, Proceedings of the IEEE Global Telecommunications Conference 2003 (GLOBECOM 2003), (pp. 3888-3893) Li, W., & Moore, A. W. (2007). A machine learning approach for efficient traffic classification, Proceeding of the 15th International Symposium on Modeling, Analysis, and Simulation of Computer and Telecommunication Systems (IEEE MASCOTS’07), (pp. 310-317) doi:10.1109/MASCOTS.2007.2
Copyright © 2014, IGI Global. Copying or distributing in print or electronic forms without written permission of IGI Global is prohibited.
56 International Journal of Adaptive, Resilient and Autonomic Systems, 5(2), 40-56, April-June 2014
Linux Programmer’s Manual. (2010). proc - process information pseudo-file system. Retrieved 2012, from http://www.kernel.org/doc/man-pages/online/pages/ man5/proc.5.html
Safavian, S. R., & Landgrebe, D. (1991). A survey of decision tree classifier methodology. IEEE Transactions on Systems, Man, and Cybernetics, 21(3), 660–674. doi:10.1109/21.97458
Marsland, S. (2009). Machine learning: an algorithmic perspective. Boca Raton, FL, USA: Chapman and Hall/CRC.
Sahoo, J., Mohapatra, S., & Lath, R. (2010). Virtualization: a survey on concepts, taxonomy and associated security issues, Proceedings of the Second IEEE International Conference on Computer and Network Technology (ICCNT 2010), (pp. 222-226) doi:10.1109/ICCNT.2010.49
Mosberger, D., & Jin, T. (1998). httperf – A tool for measuring web server performance. Performance Evaluation Review, 26(3), 31–37. doi:10.1145/306225.306235 Ohta, S., & Andou, R. (2010). WWW server load balancing technique employing passive measurement of server performance. ECTI Trans. EEC, 8(1), 59–66. Ohta, S., & Hirota, T. (2011). Machine learning approach to the power management of server clusters, Proceedings of the 11th IEEE International Conference on Computer and Information Technology (CIT 2011), (pp. 571-578) doi:10.1109/CIT.2011.49 Ohta, S., Kurebayashi, R., & Kobayashi, K. (2008). Minimizing false positives of a decision tree classifier for intrusion detection on the Internet. Journal of Network and Systems Management, 16(4), 399–419. doi:10.1007/s10922-008-9102-4 Pradhan, P., Tewari, R., Sahu, S., Chandra, A., & Shenoy, P. (2002). An observation-based approach towards self-managing web server, Proceedings of the 10th IEEE/IFIP International Workshop on Quality of Service (IWQoS 2002), (pp. 13-20) doi:10.1109/ IWQoS.2002.1006570 Quinlan, J. R. (1993). C4.5: programs for machine learning. San Mateo, CA: Morgan Kaufmann.
TCPDUMP/LIBPCAP. (2010). TCPDUMP/LIBPCAP Repository, Retrieved 2012, from http://www. tcpdump.org/ Tsai, C.-H., Shin, K. G., Reumann, J., & Singhal, S. (2007). Online web cluster capacity estimation and its application to energy conservation. IEEE Transactions on Parallel and Distributed Systems, 18(7), 932–945. doi:10.1109/TPDS.2007.1028 Xen. (2012). Xen Hypervisor Project. Retrieved 2012, from http://www.xen.org/products/xenhyp.html Xu, J., & Fortes, J. A. B. (2011). A Multi-objective approach to virtual machine management in datacenters, Proceedings of the 8th IEEE/ACM International Conference on Autonomic Computing (ICAC ‘11), (pp. 225-234) doi:10.1145/1998582.1998636 Zhu, S., & Ohta, S. (2010). Simple method to passively estimate the throughput of a TCP flow in IP networks, Proceedings of the International Conference on Information Networking 2010 (ICOIN 2010), (paper 5B-3) Zhu, S., & Ohta, S. (2012). Real-time flow counting in IP networks: strict analysis and design issues, Cyber Journals: Multidisciplinary Journals in Science and Technology [JSAT]. Journal of Selected Areas in Telecommunications, 3(2), 7–17.
Copyright © 2014, IGI Global. Copying or distributing in print or electronic forms without written permission of IGI Global is prohibited.